


 |
市場調查報告書
商品編碼
1850248
網路流量分析:市場佔有率分析、行業趨勢、統計數據和成長預測(2025-2030 年)Network Traffic Analysis - Market Share Analysis, Industry Trends & Statistics, Growth Forecasts (2025 - 2030) |
||||||
※ 本網頁內容可能與最新版本有所差異。詳細情況請與我們聯繫。
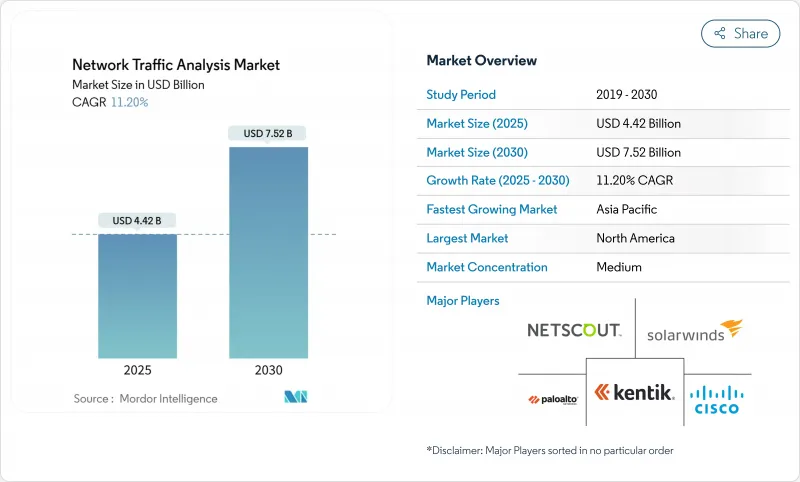
預計到 2025 年,網路流量分析市場規模將達到 44.2 億美元,到 2030 年將達到 75.2 億美元,預測期(2025-2030 年)的複合年成長率為 11.20%。
這種成長反映了安全社群從邊界防禦轉向深度流量視覺的趨勢,因為零信任計畫、5G部署和雲端原生工作負載模糊了傳統的邊界。企業將網路遙測視為單一資料來源,它能夠揭示混合環境中的橫向移動、加密威脅和效能瓶頸。將人工智慧主導的分析與持續資料包擷取相結合的供應商,憑藉其託管偵測與回應 (MDR) 服務,正在贏得市場佔有率,這些服務能夠緩解小型 IT 部門的技能差距,同時幫助安全團隊整合各種獨立工具。同時,平台供應商正競相整合加密流量分析和東西向流量偵測功能,以應對 TLS 1.3 的普及和微服務的激增。
全球網路流量分析市場趨勢與洞察
NTA 的出現使其成為現代安全堆疊的基石。
70% 的進階持續性威脅主要依賴橫向移動,而這種移動可以透過精細化的流量分析來偵測。將資料包分析與安全資訊和事件管理 (SIEM) 以及擴展資料偵測 (XDR) 系統緊密整合,與使用獨立工具相比,可以將平均偵測時間縮短高達 30%。整合遠端檢測還可以減少 40-50% 的關聯分析工作量,從而使稀缺的分析人員能夠專注於優先排序,而不是資料處理。提供開放 API 和雲端規模資料湖的供應商現在為許多零信任計畫提供支持,使網路流量分析 (NTA) 成為端點、身分和雲端防禦的基礎架構。因此,以平台為先的採購模式正在將預算從獨立探測器轉向整合的 SaaS 分析。
網路頻寬的增加和5G部署造成了可視性差距
向 5G 過渡將帶來超高小區密度、分散式用戶平面功能和多接入邊緣運算,這將使傳統的分流器和鏡像連接埠不堪重負。光是在美國,預計到 2027 年,私人 5G 投資就將達到 37 億美元,然而大多數現有的監控協定堆疊無法處理容器化流量或以毫秒精度偵測異常。服務供應商正與安全專家 T-Mobile 的 Prisma SASE 套件合作,將網路切片與線上威脅偵測結合。物聯網的普及給分析引擎帶來了更大的壓力,因為基於特徵碼的工具無法跟上設備行為的多樣化,從而刺激了對基於行為和機器學習的模型的需求。
快速演變的威脅和加密技術的發展速度超過了工具的運行速度。
TLS 1.3 透過加密 95% 的網路流量並隱藏握手元元資料,有效阻止了傳統的深度套件偵測 (DPI)。加密 ClientHello 和 0-RTT 恢復等特性迫使供應商轉向側通道推斷,這種推斷依賴於時間、序列長度和流量形態。諸如多實例加密流量轉換器 (Multi-Instance Encrypted Traffic Transformer) 之類的研究原型已達到 99% 的分類準確率,但需要 GPU 級別的強大運算能力和大多數 IT 團隊所缺乏的資料科學人才。規模較小的供應商正苦於研發成本,並面臨裁員和被收購的風險。
細分市場分析
到 2024 年,雲端部署將佔總營收的 51.2%,凸顯了企業對彈性 SaaS 分析的偏好,這種分析方式可以將資本支出轉化為固定成本。到 2030 年,雲端部署的複合年成長率 (CAGR) 將達到 13.7%,成長主要由混合模式將傳統資料中心與 AWS、Azure 和 GCP 結合。這種混合模式既能確保符合資料駐留規則,又能保持雲端的敏捷性。 Zscaler 的流量擷取服務展示了雲端平台如何在不佔用本地擷取裝置資源的情況下,將原始流量匯出到分析管道。
採用混合架構的公司報告稱,由於升級集中部署,硬體更新成本降低,新檢測功能的部署速度也更快。雖然本地部署的探測器在與空氣間隙且監管嚴格的行業中仍然存在,但隨著監管機構採用雲端認證框架,其在各行業探測器市場中的佔有率正在穩步下降。混合架構的採用正在推動整個網路流量分析市場向缺乏企業級工具的待開發區中型企業擴展。
至2024年,解決方案(包括設備、虛擬感測器和SaaS主機)將佔網路流量分析市場規模的62.4%。然而,隨著監控和事件回應工作量的減少,服務正以14.5%的複合年成長率快速成長。 OPSWAT收購InQuest表明,供應商正在將深度文件偵測和威脅情報整合到託管服務中,以滿足聯邦政府的需求。
採用託管服務是應對分析師短缺和產品複雜性的務實之舉。服務提供者提供全天候可用性、精選威脅情報源和自動化隔離措施,從而推動了資源受限企業的採用。在 100Gbps 以上的骨幹網路中,硬體感測器仍然具有重要意義,因為 FPGA 加速的性能優於虛擬設備。然而,供應商正擴大將這些感測器定位為資料轉發器,為雲端分析提供資料。
網路流量分析市場按配置(本地部署、雲端基礎、混合部署)、組件(解決方案和服務)、組織規模(大型企業和中小企業)、最終用戶行業(銀行、金融服務和保險 (BFSI)、IT 和電信、其他)以及地區進行細分。以上所有細分市場的市場規模和預測均以價值(百萬美元)為單位。
區域分析
受嚴格的隱私法、零信任架構的早期應用以及高額網路安全預算的推動,北美地區預計在2024年將佔全球收入的34.06%。摩根大通的嵌入式人工智慧詐騙系統展現了該地區對資料包主導分析的強勁需求,該系統可將威脅識別速度提升300倍,並每年節省2億美元。印第安納州在其多重雲端中部署流量分析後,顯著提升了公民服務水準。
亞太地區是高速成長引擎,複合年成長率高達14.3%。中國、印度和韓國大規模部署5G網路,加上智慧城市投資和日益增加的勒索軟體攻擊事件,正在推動網路終端分析(NTA)技術的應用。諸如中國的《網路安全法》和澳洲的《關鍵基礎設施法》等地方性法規,都強制要求進行流量日誌記錄和異常檢測。使用專用蜂巢式網路實現工廠數位化的製造商需要進行詳細的監控,以確保營運技術(OT)與資訊技術(IT)的整合。
在歐洲,GDPR違規通知要求和新的人工智慧立法強制要求演算法透明化,這些因素共同推動了強勁的需求。主權雲端計畫正在推動混合部署,資料包保留在區域內,這使得能夠提供精細資料駐留控制的供應商受益。拉丁美洲和中東/非洲地區仍處於起步階段,但已展現出巨大潛力:巴西的銀行、沙烏地阿拉伯的智慧城市計劃以及南非的通訊業者正在試點人工智慧驅動的NTA(網路終端分析),以應對日益嚴格的網路安全法規。
其他福利:
- Excel格式的市場預測(ME)表
- 3個月的分析師支持
目錄
第1章 引言
- 研究假設和市場定義
- 調查範圍
第2章調查方法
第3章執行摘要
第4章 市場情勢
- 市場概覽
- 市場促進因素
- NTA 的出現為現代安全堆疊奠定了基礎。
- 網路頻寬的增加和5G部署造成了可視性差距
- 向雲端和混合架構的遷移將增加對雲端原生網路終端應用(NTA)的需求。
- 基於機器學習的加密流量檢查要求
- 零信任東西向流量激增
- SOC整合推動NTA/NDR整合
- 市場限制
- 威脅和加密技術的快速演變速度超過了工具的進步速度。
- 熟練分析師短缺和解決方案複雜
- 限制深層封包檢測的資料隱私法規
- 將預算重新分配給終端/XDR工具
- 產業價值鏈分析
- 監管環境
- 技術展望
- 產業吸引力-波特五力分析
- 新進入者的威脅
- 買方的議價能力
- 供應商的議價能力
- 替代品的威脅
- 競爭對手之間的競爭
- 影響市場的宏觀經濟因素
第5章 市場規模及成長預測(數值)
- 按配置
- 本地部署
- 雲端基礎的
- 混合
- 按組件
- 解決方案
- 硬體設備
- 虛擬設備
- SaaS平台
- 服務
- 專業服務
- 託管服務
- 解決方案
- 按組織規模
- 主要企業
- 小型企業
- 按最終用戶行業分類
- BFSI
- 資訊科技和通訊
- 政府和國防部
- 能源與公共產業
- 零售與電子商務
- 醫療保健和生命科學
- 製造業
- 其他終端用戶產業
- 透過使用
- 安全與威脅偵測
- 效能監控與最佳化
- 合規與政策執行
- 產能規劃與預測
- 按地區
- 北美洲
- 美國
- 加拿大
- 墨西哥
- 南美洲
- 巴西
- 阿根廷
- 智利
- 其他南美洲
- 歐洲
- 德國
- 英國
- 法國
- 義大利
- 西班牙
- 俄羅斯
- 其他歐洲地區
- 亞太地區
- 中國
- 印度
- 日本
- 韓國
- 馬來西亞
- 新加坡
- 澳洲
- 亞太其他地區
- 中東和非洲
- 中東
- 阿拉伯聯合大公國
- 沙烏地阿拉伯
- 土耳其
- 其他中東地區
- 非洲
- 南非
- 奈及利亞
- 其他非洲地區
- 北美洲
第6章 競爭情勢
- 市場集中度
- 策略趨勢
- 市佔率分析
- 公司簡介
- NETSCOUT Systems Inc.
- Cisco Systems Inc.
- Palo Alto Networks Inc.
- SolarWinds Corporation
- Kentik Technologies Inc.
- Dynatrace LLC
- ExtraHop Networks Inc.
- Flowmon Networks AS(Progress)
- GreyCortex sro
- Genie Networks Ltd.
- ManageEngine(Zoho Corp.)
- Plixer LLC
- Nagios Enterprises LLC
- Gigamon Inc.
- Corelight Inc.
- Vectra AI Inc.
- Ixia(Keysight Technologies Inc.)
- Riverbed Technology LLC
- Nozomi Networks Inc.
- Nokia Corporation
第7章 市場機會與未來趨勢
- 閒置頻段與未滿足需求評估
The Network Traffic Analysis Market size is estimated at USD 4.42 billion in 2025, and is expected to reach USD 7.52 billion by 2030, at a CAGR of 11.20% during the forecast period (2025-2030).
Growth reflects the security community's pivot from perimeter defenses to deep traffic visibility as zero-trust programs, 5G rollouts, and cloud-native workloads muddy traditional boundaries. Enterprises see network telemetry as the single source of truth that can uncover lateral movement, encrypted threats, and performance bottlenecks in a hybrid world. Vendors that marry AI-driven analytics with continuous packet capture are winning mindshare as security teams consolidate point tools, while managed detection and response (MDR) services temper the skills gap in small IT shops. At the same time, platform providers are racing to embed encrypted traffic analytics and east-west inspection to keep pace with TLS 1.3 adoption and microservices proliferation.
Global Network Traffic Analysis Market Trends and Insights
Emergence of NTA as Cornerstone in Modern Security Stacks
Seventy percent of advanced persistent threats rely on lateral movement, detectable primarily through granular traffic analytics, prompting security teams to elevate NTA from a nice-to-have tool to a foundational control. Tightly coupling packet analytics with SIEM and XDR cuts mean time to detect by up to 30% relative to siloed tools. Unified telemetry also trims correlation workloads 40-50%, freeing scarce analysts to focus on triage rather than data wrangling. Vendors that deliver open APIs and cloud-scale data lakes now underpin many zero-trust programs, positioning NTA as the fabric that underlies endpoint, identity, and cloud defenses. As a result, platform-first buying behavior is shifting budget from stand-alone probes toward integrated SaaS analytics.
Expanding Network Bandwidth and 5G Rollouts Create Visibility Gaps
The jump to 5G introduces ultra-dense cells, distributed user-plane functions, and multi-access edge computing that overwhelm classic taps and span ports. Private 5G outlays in the United States alone are expected to hit USD 3.7 billion by 2027, yet most existing monitoring stacks cannot ingest containerized traffic or detect millisecond-scale anomalies. Service providers partner with security specialists-T-Mobile's Prisma SASE bundle is a notable example-to pair network slicing with inline threat detection. IoT proliferation further stresses analytics engines because signature-based tools falter against diverse device behaviors, fueling demand for behavior and ML-centric models.
Rapid Evolution of Threats and Encryption Outpacing Tooling
TLS 1.3 encrypts 95% of web traffic and conceals handshake metadata, thwarting legacy DPI. Features such as Encrypted ClientHello and 0-RTT resumption force vendors to pivot toward side-channel inference that relies on timing, sequence lengths, and traffic morphologies. Research prototypes like multi-instance encrypted traffic transformers hit 99% classification accuracy but demand GPU-class horsepower and data science talent that most IT teams lack. Smaller suppliers struggle with R&D costs, creating potential attrition or acquisition.
Other drivers and restraints analyzed in the detailed report include:
- Migration to Cloud and Hybrid Architectures Boosts Demand for Cloud-Native NTA
- Zero-Trust East-West Traffic Proliferation
- Shortage of Skilled Analysts and High Solution Complexity
For complete list of drivers and restraints, kindly check the Table Of Contents.
Segment Analysis
Cloud deployments controlled 51.2% of 2024 revenue, underscoring preference for elastic SaaS analytics that shift capex to opex. The hybrid model is the growth pacesetter, registering a 13.7% CAGR through 2030 as enterprises knit legacy data centers with AWS, Azure, or GCP estates. That blend ensures compliance with data-residency rules while sustaining cloud agility. Zscaler's Traffic Capture service showcases how cloud platforms can export raw traffic to analytics pipelines without saturating on-premises capture appliances.
Enterprises adopting hybrid architectures report lower hardware refresh spend and faster rollout of new inspection features because upgrades are deployed centrally. On-premises probes persist in air-gapped or highly regulated verticals, yet their share of the network traffic analysis market steadily recedes as regulations embrace cloud certification frameworks. Hybrid adoption consequently propels overall network traffic analysis market expansion into greenfield midsize companies that lacked enterprise-class tooling.
Solutions-appliances, virtual sensors, and SaaS consoles-represented 62.4% of the network traffic analysis market size in 2024. However, services are scaling at 14.5% CAGR as organizations offload monitoring and incident response. OPSWAT's buyout of InQuest illustrates how vendors bundle Deep File Inspection and threat intel with managed offerings to address federal-sector needs.
Managed service uptake is a pragmatic response to analyst scarcity and product complexity. Providers supply 24/7 coverage, curated threat feeds, and automated containment, boosting adoption among resource-constrained firms. Hardware sensors retain relevance in 100 Gbps-plus backbones where FPGA acceleration still outperforms virtual appliances. Even so, vendors increasingly position those sensors as data forwarders feeding cloud analytics.
Network Traffic Analysis Market is Segmented by Deployment (On-Premise, Cloud-Based, and Hybrid), Component (Solutions and Services), Organization Size (Large Enterprises and Small and Medium Enterprises), End-User Industry (BFSI, IT and Telecom, and More), and Geography. The Market Sizes and Forecasts are Provided in Value (in USD Million) for all the Above Segments.
Geography Analysis
North America contributed 34.06% of 2024 revenue thanks to strict privacy statutes, early zero-trust adoption, and high cybersecurity budgets. JPMorgan's AI-infused fraud system illustrates regional appetite for packet-driven analytics that accelerate threat identification 300-fold and save USD 200 million annually. State governments likewise embrace observability; Indiana improved citizen services after deploying traffic analytics across multi-cloud infrastructure.
Asia-Pacific is the high-growth engine with a 14.3% CAGR. Massive 5G rollouts in China, India, and South Korea, combined with smart-city investments and rising ransomware incidents, spur NTA adoption. Local regulations such as China's Cybersecurity Law and Australia's Critical Infrastructure Act compel traffic logging and anomaly detection. Manufacturers digitizing shop floors with private cellular networks need granular monitoring to secure OT and IT convergence.
Europe maintains robust demand owing to GDPR's breach notification requirements and emerging AI legislation that mandates algorithmic transparency. Sovereign-cloud initiatives push hybrid deployments so packets stay in-region, benefitting vendors that provide fine-grained data-residency controls. Latin America and the Middle East and Africa remain nascent but promising: Brazilian banks, Saudi smart-city projects, and South African telcos are piloting AI-fueled NTA in anticipation of stricter cyber mandates.
- NETSCOUT Systems Inc.
- Cisco Systems Inc.
- Palo Alto Networks Inc.
- SolarWinds Corporation
- Kentik Technologies Inc.
- Dynatrace LLC
- ExtraHop Networks Inc.
- Flowmon Networks A.S. (Progress)
- GreyCortex s.r.o.
- Genie Networks Ltd.
- ManageEngine (Zoho Corp.)
- Plixer LLC
- Nagios Enterprises LLC
- Gigamon Inc.
- Corelight Inc.
- Vectra AI Inc.
- Ixia (Keysight Technologies Inc.)
- Riverbed Technology LLC
- Nozomi Networks Inc.
- Nokia Corporation
Additional Benefits:
- The market estimate (ME) sheet in Excel format
- 3 months of analyst support
TABLE OF CONTENTS
1 INTRODUCTION
- 1.1 Study Assumptions and Market Definition
- 1.2 Scope of the Study
2 RESEARCH METHODOLOGY
3 EXECUTIVE SUMMARY
4 MARKET LANDSCAPE
- 4.1 Market Overview
- 4.2 Market Drivers
- 4.2.1 Emergence of NTA as cornerstone in modern security stacks
- 4.2.2 Expanding network bandwidth and 5G rollouts create visibility gaps
- 4.2.3 Migration to cloud and hybrid architectures boosts demand for cloud-native NTA
- 4.2.4 Encrypted traffic ML-based inspection requirements
- 4.2.5 Zero-trust east-west traffic proliferation
- 4.2.6 SOC consolidation pushing NTA/NDR convergence
- 4.3 Market Restraints
- 4.3.1 Rapid evolution of threats and encryption outpacing tooling
- 4.3.2 Shortage of skilled analysts and high solution complexity
- 4.3.3 Data-privacy regulations restricting deep packet inspection
- 4.3.4 Budget reallocation toward endpoint/XDR tools
- 4.4 Industry Value Chain Analysis
- 4.5 Regulatory Landscape
- 4.6 Technological Outlook
- 4.7 Industry Attractiveness - Porter's Five Forces Analysis
- 4.7.1 Threat of New Entrants
- 4.7.2 Bargaining Power of Buyers
- 4.7.3 Bargaining Power of Suppliers
- 4.7.4 Threat of Substitutes
- 4.7.5 Intensity of Competitive Rivalry
- 4.8 Impact of Macroeconomic Factors on the Market
5 MARKET SIZE AND GROWTH FORECASTS (VALUES)
- 5.1 By Deployment
- 5.1.1 On-premise
- 5.1.2 Cloud-based
- 5.1.3 Hybrid
- 5.2 By Component
- 5.2.1 Solutions
- 5.2.1.1 Hardware Appliances
- 5.2.1.2 Virtual Appliances
- 5.2.1.3 SaaS Platform
- 5.2.2 Services
- 5.2.2.1 Professional Services
- 5.2.2.2 Managed Services
- 5.2.1 Solutions
- 5.3 By Organization Size
- 5.3.1 Large Enterprises
- 5.3.2 Small and Medium Enterprises (SMEs)
- 5.4 By End-user Industry
- 5.4.1 BFSI
- 5.4.2 IT and Telecom
- 5.4.3 Government and Defense
- 5.4.4 Energy and Utilities
- 5.4.5 Retail and E-commerce
- 5.4.6 Healthcare and Life Sciences
- 5.4.7 Manufacturing
- 5.4.8 Other End-user Industries
- 5.5 By Application
- 5.5.1 Security and Threat Detection
- 5.5.2 Performance Monitoring and Optimization
- 5.5.3 Compliance and Policy Enforcement
- 5.5.4 Capacity Planning and Forecasting
- 5.6 By Geography
- 5.6.1 North America
- 5.6.1.1 United States
- 5.6.1.2 Canada
- 5.6.1.3 Mexico
- 5.6.2 South America
- 5.6.2.1 Brazil
- 5.6.2.2 Argentina
- 5.6.2.3 Chile
- 5.6.2.4 Rest of South America
- 5.6.3 Europe
- 5.6.3.1 Germany
- 5.6.3.2 United Kingdom
- 5.6.3.3 France
- 5.6.3.4 Italy
- 5.6.3.5 Spain
- 5.6.3.6 Russia
- 5.6.3.7 Rest of Europe
- 5.6.4 Asia-Pacific
- 5.6.4.1 China
- 5.6.4.2 India
- 5.6.4.3 Japan
- 5.6.4.4 South Korea
- 5.6.4.5 Malaysia
- 5.6.4.6 Singapore
- 5.6.4.7 Australia
- 5.6.4.8 Rest of Asia-Pacific
- 5.6.5 Middle East and Africa
- 5.6.5.1 Middle East
- 5.6.5.1.1 United Arab Emirates
- 5.6.5.1.2 Saudi Arabia
- 5.6.5.1.3 Turkey
- 5.6.5.1.4 Rest of Middle East
- 5.6.5.2 Africa
- 5.6.5.2.1 South Africa
- 5.6.5.2.2 Nigeria
- 5.6.5.2.3 Rest of Africa
- 5.6.1 North America
6 COMPETITIVE LANDSCAPE
- 6.1 Market Concentration
- 6.2 Strategic Moves
- 6.3 Market Share Analysis
- 6.4 Company Profiles (includes Global level Overview, Market level overview, Core Segments, Financials as available, Strategic Information, Market Rank/Share for key companies, Products and Services, and Recent Developments)
- 6.4.1 NETSCOUT Systems Inc.
- 6.4.2 Cisco Systems Inc.
- 6.4.3 Palo Alto Networks Inc.
- 6.4.4 SolarWinds Corporation
- 6.4.5 Kentik Technologies Inc.
- 6.4.6 Dynatrace LLC
- 6.4.7 ExtraHop Networks Inc.
- 6.4.8 Flowmon Networks A.S. (Progress)
- 6.4.9 GreyCortex s.r.o.
- 6.4.10 Genie Networks Ltd.
- 6.4.11 ManageEngine (Zoho Corp.)
- 6.4.12 Plixer LLC
- 6.4.13 Nagios Enterprises LLC
- 6.4.14 Gigamon Inc.
- 6.4.15 Corelight Inc.
- 6.4.16 Vectra AI Inc.
- 6.4.17 Ixia (Keysight Technologies Inc.)
- 6.4.18 Riverbed Technology LLC
- 6.4.19 Nozomi Networks Inc.
- 6.4.20 Nokia Corporation
7 MARKET OPPORTUNITIES AND FUTURE TRENDS
- 7.1 White-Space and Unmet-Need Assessment
 2026年全球網路流量分析市場報告2026年全球網路流量分析解決方案市場報告
 2026-2030年全球組織網路分析工具市場
 網路流量分析解決方案市場分析及預測(至2035年):按類型、產品類型、服務、技術、組件、應用、流程、部署類型和最終用戶分類
 網路流量分析解決方案市場 - 全球產業規模、佔有率、趨勢、機會、預測:按部署類型、用戶類型、最終用戶、地區和競爭對手分類,2021-2031 年
 網路流量分析市場規模、佔有率和成長分析(按組件、部署類型、組織規模、最終用戶產業和地區分類)-2026-2033年產業預測網路流量分析市場 - 全球產業規模、佔有率、趨勢、機會和預測,按組件、部署模式、組織規模、最終用戶、地區和競爭格局細分,2020-2030 年預測
 網路流量分析市場機會、成長動力、產業趨勢分析及 2025 - 2034 年預測
 網路流量分析市場規模、佔有率、趨勢分析報告:按組件、部署、組織規模、行業垂直、地區和細分市場進行預測,2025 年至 2030 年
 網路流量分析全球市場規模、佔有率、趨勢分析報告(按組件、按部署類型、按最終用戶、按組織規模、按地區、展望和預測,2024-2031 年)