


 |
市場調查報告書
商品編碼
1850070
控制閥:市場佔有率分析、產業趨勢、統計數據和成長預測(2025-2030 年)Control Valve - Market Share Analysis, Industry Trends & Statistics, Growth Forecasts (2025 - 2030) |
||||||
※ 本網頁內容可能與最新版本有所差異。詳細情況請與我們聯繫。
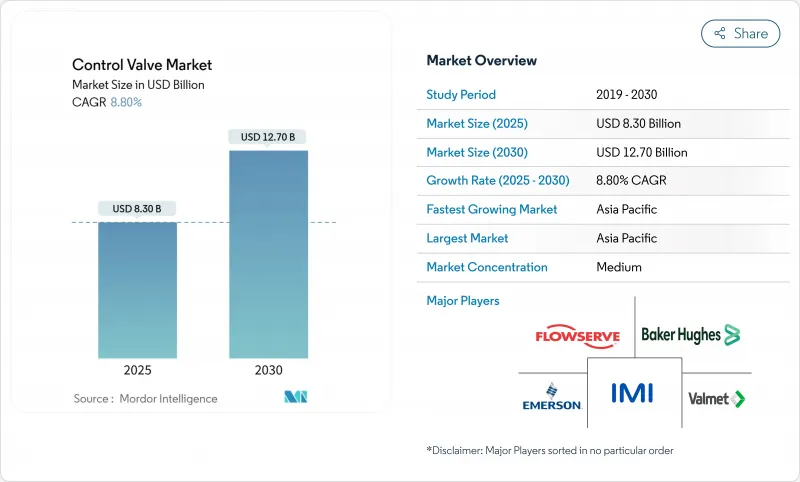
控制閥市場預計將以 8.80% 的複合年成長率成長,到 2025 年達到 83 億美元,到 2030 年達到 127 億美元。
對石油和天然氣、電力和水利基礎設施的穩定資本投資將支持這一成長,而氫能經濟數位化資產管理的擴張將創造新的應用領域。預計到 2035 年,石油和天然氣基礎設施投資將達到 1.6 兆至 1.34 兆美元,從而確保長期需求底線。光是洛杉磯水電局就在實施一項 63 億美元的五年資本計劃,優先升級輸電幹線和處理廠閥門。美國環保署每噸 900 美元的甲烷排放費增加了逸散排放的合規成本,監管勢頭正在加速從氣動到電動致動器的轉變。亞太地區佔 2024 年銷售額的 38.2%,將在全球銷量中佔據主導地位,而北美和歐洲則在數位化維修和嚴格的服務規範方面處於領先地位。
全球控制閥市場趨勢與洞察
增加對用水和污水基礎設施的投資
市政公共產業正在優先考慮資產更新,以滿足日益嚴格的品質要求和氣候適應性目標。田納西州將在2024年為102個計劃提供2.32億美元的撥款,這體現了其替換計劃的廣度,其中電動閥門提供了營運商目前所需的遠端監控功能。加州最大的水務局正在進行為期多年的智慧蝶閥和旋塞閥採購週期,以減少未計費水量水損失。這些承諾支持電動執行器的成長軌跡,同時刺激與診斷軟體結合的售後服務。
老化發電廠和加工廠的現代化改造
火力發電、核能和石化發電領域的脫碳藍圖將縮短傳統流量控制資產的更換週期。美國能源局的核能發電廠現代化策略將控制閥升級列為安全的基礎投資,並為適用於核能發電廠的數位定位器分配了研究資金。水電壽命延長計畫正在撥款近10億美元,用於為監控網路配備整合網路安全保障措施的現代化電子閥門。這些計劃正在將閥門規格轉向精密球體設計和耐腐蝕合金,鞏固高價位市場。
原油價格波動抑製油氣資本支出
大宗商品價格波動抑制了探勘需求,導致嚴重依賴高價值閥門的待開發區管道和液化天然氣計劃延遲。澳洲能源生產商指出,過去五年,該國僅吸引了全球1.2%的探勘支出,凸顯其保守的投資環境。馬來西亞國家石油公司(PETRONAS)的2025-2027年展望也體現了這種謹慎態度,強調棕地最佳化而非產能擴張。雖然基準維護將維持產能基礎的穩健,但在價格前景改善之前,短期可自由支配的支出仍面臨風險。
細分分析
截止閥憑藉其在煉油廠、化學反應器和高壓蒸氣迴路中的精細流動能力,在2024年佔據了控制閥市場佔有率的32%。受惠於OEM備件的強勁售後市場,截止閥的安裝量成長增強了控制閥市場的韌性。球閥因其緊密的關閉性能而備受青睞,佔據了控制閥市場規模的第二大佔有率,支撐了管道迴路隔離作業的需求。蝶閥的複合年成長率最高,達到8.9%,這得益於其緊湊的結構、較低的單位直徑成本和增強的密封性能,使其在中等關鍵應用領域的應用不斷擴展。整合在球閥和蝶閥閥體中的數位定位器體現了機械設計與電子技術日益融合的趨勢。塞閥和隔膜閥分別在漿料和衛生應用中佔據重要的地位,並由哈氏合金和USP級含氟聚合物等特定應用材料製成。
生命週期經濟學傾向於採用硬面閥內件的重型球閥設計,其平均維護間隔比通用裝置長三倍。同時,水務公司正在選擇彈性閥座蝶閥來最佳化資本預算,從而繼續將控制閥市場拓展到製程工業以外的領域。供應商正在透過積層製造的閥內件實現差異化,以解決氣蝕和閃蒸問題,從而擴大其在海水淡化和地熱發電廠中的應用。隨著能源轉型計劃整合氫能和碳捕集工藝,符合 API 6A 標準的金屬閥座球閥正成為關鍵的成長點。
氣壓氣壓維護相對簡單,並支援強大的備件生態系統,從而抑制了向電動式的過渡。然而,到2030年,受零排放運作、更高的扭力額定值以及可直接嵌入工廠乙太網路架構的整合診斷功能的推動,預計電動驅動器的市場規模將成長9.8%。這種動態正在將收益從壓縮機和空氣乾燥器轉移到軟體支援的狀態監控模組,再形成驅動控制閥市場的規模。
在海底和重型採礦領域,液壓驅動裝置雖然地位有限,但具有戰略意義,因為這些領域缺乏故障安全彈簧組件和電池供電。手排變速箱通常以低佔空比運行,但擴大與位置反饋感測器配對,以滿足網路安全主導的資產可視性要求。隨著雲端原生歷史資料庫改進異常檢測,具有嵌入式處理器的電力驅動器可以執行本地邊緣分析,改善迴路調節,並縮短平均修復時間。提供涵蓋電動、氣動和液壓管路的通用控制板的供應商可以提高供應鏈經濟效益,同時簡化使用者培訓。
控制閥市場細分:按類型(截止閥、球閥、蝶閥等)、按最終用戶行業(石油天然氣、化工、石化、化肥等)、按驅動技術(氣動、液壓等)、按材質(鋼、鑄鐵等)以及按地區分類。市場預測以價值(美元)提供。
區域分析
亞太地區佔2024年銷售額的38.2%,到2030年,其銷售量將達到前所未有的水平,複合年成長率也將達到7.9%,成為全球最快的地區。中國東部沿海的大型石化企業和印度24億美元的國家氫能計畫將直接推動高壓截止閥和球閥的採購。東南亞液化天然氣的擴張將增強基準需求,印尼和越南的國有公共正在利用多邊融資來實現水處理現代化,並維持閥門產品組合的平衡。
北美仍然是創新中心,更嚴格的排放法規、數位化維修以及SMR試點計畫推動了高級產品的普及。美國石油協會預計,到2035年,石油和天然氣基礎設施投資將達到1.6兆至1.34兆美元,以支持管道閥門的生產。像洛杉磯為期五年、耗資63億美元的水務項目這樣的基礎設施更新計劃,將為智慧蝶閥和塞閥帶來穩定的售後市場收益。
在歐洲,環保合規是重中之重,這加速了向電動驅動的轉變,並有利於低洩漏閥桿密封系統。在法國和英國,核能發電廠壽命延長計劃正在推動對嚴苛工況閥門的需求,而德國的綠色氫能走廊則指定使用帶有氫滲透屏障的不銹鋼閥門。在中東和非洲,企業正在利用碳氫化合物現金流為海水淡化和太陽能供水計劃提供資金,並採用耐腐蝕的兩相蝶閥。在拉丁美洲,企業在一定程度上受益於智利和秘魯的銅礦開採資本支出,高壓漿料閥抵消了石油收入的週期性變化。
其他福利:
- Excel 格式的市場預測 (ME) 表
- 3個月的分析師支持
目錄
第1章 引言
- 研究假設和市場定義
- 調查範圍
第2章調查方法
第3章執行摘要
第4章 市場狀況
- 市場概況
- 市場促進因素
- 增加對水和污水處理基礎設施的投資
- 老化發電廠和加工廠的現代化改造
- 有關排放的嚴格環境法規
- 擴大氫經濟需要高壓閥門
- 使用數位雙胞胎進行預測性閥門診斷
- 越來越多的 SMR 需要能夠承受嚴苛工況的閥門
- 市場限制
- 原油價格波動抑制了石油和天然氣的資本投資
- 來自低成本亞洲供應商的價格壓力
- 合金供應鏈中斷
- 智慧定位器的網路安全風險
- 價值/供應鏈分析
- 監管格局
- 技術展望
- 波特五力分析
- 供應商的議價能力
- 買方的議價能力
- 新進入者的威脅
- 替代品的威脅
- 競爭對手之間的競爭
- 投資分析
第5章市場規模及成長預測
- 按閥門類型
- 手套
- 球
- 蝴蝶
- 插頭
- 隔膜
- 其他閥門類型
- 驅動技術
- 氣壓
- 油壓
- 電
- 手動的
- 按最終用戶產業
- 石油和天然氣
- 化工、石化、化肥
- 能源和電力
- 水和污水處理
- 金屬和採礦
- 食品/飲料
- 製藥
- 紙漿和造紙
- 其他行業
- 按材質
- 鋼
- 鑄鐵
- 合金基體
- 塑膠(PVC、PP、PVDF)
- 其他成分
- 按地區
- 北美洲
- 美國
- 加拿大
- 墨西哥
- 南美洲
- 巴西
- 阿根廷
- 南美洲其他地區
- 歐洲
- 英國
- 德國
- 法國
- 義大利
- 西班牙
- 俄羅斯
- 其他歐洲地區
- 亞太地區
- 中國
- 日本
- 韓國
- 印度
- 澳洲
- 其他亞太地區
- 中東和非洲
- GCC
- 南非
- 其他中東和非洲地區
- 北美洲
第6章 競爭態勢
- 市場集中度
- 策略趨勢
- 市佔率分析
- 公司簡介
- Emerson Electric Co.
- Flowserve Corporation
- Baker Hughes Co.(Cameron)
- Valmet(Metso)
- IMI plc
- CIRCOR International Inc.
- Christian Brkert GmbH
- Crane Co. Nuclear Division
- Neway Valve(Suzhou)Co. Ltd
- ABB Ltd
- Alfa Laval AB
- Rotork plc
- AUMA Riester GmbH
- Crane Co.
- SAMSON AG
- KSB SE and Co. KGaA
- AVK Holding A/S
- Cla-Val Co.
- Velan Inc
- Spirax-Sarco Engineering plc
第7章 市場機會與未來展望
The control valve market size stands at USD 8.30 billion in 2025 and is projected to reach USD 12.70 billion by 2030, advancing at an 8.80% CAGR.
Steady capital spending in oil, gas, power, and water infrastructure underpins this growth while the scale-up of the hydrogen economy and digitalized asset management create fresh application pockets. Nearly USD 1.06 trillion to USD 1.34 trillion in oil and gas infrastructure investment forecast through 2035 secures a long-range demand floor. Municipal water authorities add structural tailwinds; Los Angeles Department of Water and Power alone is executing a USD 6.3 billion, five-year capital program that prioritizes valve upgrades in transmission mains and treatment plants. Regulatory momentum accelerates the transition from pneumatic to electric actuation as the U.S. Environmental Protection Agency's methane charge of USD 900 per metric ton raises the cost of fugitive emissions compliance. APAC, with 38.2% of 2024 revenue, anchors global volume while North America and Europe lead in digital retrofits and severe-service specifications.
Global Control Valve Market Trends and Insights
Rising investments in water & wastewater infrastructure
Municipal utilities are prioritizing asset renewal to meet tightening quality mandates and climate resilience targets. Tennessee's 2024 grants of USD 232 million for 102 projects illustrate the breadth of replacement programs where electronically actuated valves deliver the remote-monitoring functionality operators now require. Parallel spending in California's largest water district underpins a multi-year procurement cycle for smart butterfly and plug valves that reduce non-revenue water losses. These commitments underpin the electric actuation growth trajectory while stimulating aftermarket services tied to diagnostics software.
Modernisation of aging power & process plants
Decarbonization roadmaps at thermal, nuclear, and petrochemical sites compress replacement cycles for legacy flow-control assets. The U.S. Department of Energy's Nuclear Power Plant Modernization Strategy identifies control valve upgrades as a foundational safety investment and allocates research funding to digital positioners qualified for nuclear service. Hydropower life-extension programs channel nearly USD 1 billion toward modern electronic valves that integrate cybersecurity safeguards for supervisory control networks energy.gov. These projects shift specification toward high-accuracy globe designs and corrosion-resistant alloys, reinforcing premium pricing niches.
Oil-price volatility curbing O&G CAPEX
Commodity swings dampen exploration appetite, deferring greenfield pipeline and LNG projects that rely heavily on high-value valves. Australian Energy Producers note that the country attracted only 1.2% of global exploration spending over five years, underscoring a conservative investment climate . PETRONAS' 2025-2027 outlook echoes this caution, emphasizing brownfield optimization over capacity expansion. While baseline maintenance keeps the installed base active, short-cycle discretionary spending remains at risk until pricing visibility improves.
Other drivers and restraints analyzed in the detailed report include:
- Stringent environmental regulations on emissions
- Hydrogen economy scale-up requiring high-pressure valves
- Pricing pressure from low-cost Asian suppliers
For complete list of drivers and restraints, kindly check the Table Of Contents.
Segment Analysis
Globe valves held a 32% control valve market share in 2024, reflecting their fine throttling capability in refineries, chemical reactors, and high-pressure steam loops. Their installed base drives a substantial aftermarket that favors OEM spare parts, reinforcing stickiness in the control valve market. Ball valves, preferred for tight shut-off, represent the second-largest slice of the control valve market size and sustain demand from pipeline loop-isolation duties. Butterfly valves register the fastest 8.9% CAGR thanks to compact build, lower cost per diameter, and enhanced sealing profiles that extend their use into moderately critical service. Digital positioners embedded on globe and butterfly bodies illustrate the growing convergence of mechanical design with electronics. Plug and diaphragm valves retain niche relevance in slurry and sanitary duties respectively, supported by application-specific materials such as Hastelloy or USP-grade fluoroplastics.
Lifecycle economics tilt in favor of severe-service globe designs with hard-faced trims that triple mean-time-between-maintenance versus commodity units. Concurrently, water utilities choose resilient-seated butterfly valves to optimize capital budgets, continuing to stretch the control valve market beyond process industries. Suppliers differentiate via additive-manufactured trims that handle cavitation and flashing, extending penetration in desalination and geothermal plants. As energy transition projects integrate hydrogen and carbon-capture processes, metal-seated ball valves qualified to API 6A emerge as a vital growth pocket.
Pneumatic units retained a 48% control valve market share in 2024 because intrinsic safety and torque density remain essential in hydrocarbon processing. Their relatively simple maintenance profile underpins a robust spares ecosystem that tempers migration to electrics. However, electric drives are forecast to compound at 9.8% through 2030, supported by zero-emission operation, expanding torque ratings, and the appeal of integrated diagnostics that slot directly into plant Ethernet architectures. This dynamic is reshaping the control valve market size for drives, shifting revenue from compressors and air dryers toward software-enabled condition monitoring modules.
Hydraulic actuation sustains a limited but strategic footprint in subsea and heavy mining where fail-safe spring packages or battery-backed electrics fall short. Manual gearboxes persist in low-duty cycles but are increasingly paired with position feedback sensors to satisfy cybersecurity-driven asset-visibility mandates. As cloud-native historians refine anomaly detection, electric drives with embedded processors can execute local edge analytics, improving loop tuning and lowering mean time to repair. Vendors offering common control boards across electric, pneumatic, and hydraulic lines gain supply-chain economies while simplifying user training.
Control Valve Market Segmented by Type (Globe, Ball, Butterfly and More), End-User Industry (Oil and Gas, Chemical, Petrochemical, and Fertilizer, and More), Actuation Technology (Pneumatic, Hydraulic and More), Material (Steel, Cast Iron and More), and by Geography. The Market Forecasts are Provided in Terms of Value (USD).
Geography Analysis
APAC, representing 38.2% of 2024 sales, combines unmatched volume with the fastest 7.9% CAGR through 2030. Large-scale petrochemical complexes on China's eastern seaboard and India's USD 2.4 billion national hydrogen mission translate directly into high-pressure globe and ball valve procurement. Southeast Asian LNG expansion reinforces baseline demand, while state-owned utilities in Indonesia and Vietnam capitalize on multilateral financing to modernize water treatment, sustaining a balanced valve mix.
North America remains an innovation nucleus where stringent emission rules, digital retrofits, and SMR pilots drive premium product adoption. The American Petroleum Institute expects USD 1.06 trillion to USD 1.34 trillion in oil and gas infrastructure investment through 2035, anchoring pipeline valve volumes. Infrastructure renewal programs such as Los Angeles' five-year USD 6.3 billion water initiative feed consistent aftermarket revenue for smart butterfly and plug valves.
Europe positions environmental compliance at the forefront, accelerating electrification of actuation and favoring low-leakage stem-seal systems. Nuclear life-extension projects in France and the United Kingdom contribute to severe-service valve demand, while Germany's green hydrogen corridors specify stainless valves with hydrogen permeation barriers. The Middle East and Africa leverage hydrocarbon cash flows to fund desalination and solar-powered water projects, adopting corrosion-resistant duplex butterfly valves. Latin America, though smaller, benefits from copper mining CAPEX in Chile and Peru where high-pressure slurry valves offset cyclical volatility in oil revenues.
- Emerson Electric Co.
- Flowserve Corporation
- Baker Hughes Co. (Cameron)
- Valmet (Metso)
- IMI plc
- CIRCOR International Inc.
- Christian Brkert GmbH
- Crane Co. Nuclear Division
- Neway Valve (Suzhou) Co. Ltd
- ABB Ltd
- Alfa Laval AB
- Rotork plc
- AUMA Riester GmbH
- Crane Co.
- SAMSON AG
- KSB SE and Co. KGaA
- AVK Holding A/S
- Cla-Val Co.
- Velan Inc
- Spirax-Sarco Engineering plc
Additional Benefits:
- The market estimate (ME) sheet in Excel format
- 3 months of analyst support
TABLE OF CONTENTS
1 INTRODUCTION
- 1.1 Study Assumptions and Market Definition
- 1.2 Scope of the Study
2 RESEARCH METHODOLOGY
3 EXECUTIVE SUMMARY
4 MARKET LANDSCAPE
- 4.1 Market Overview
- 4.2 Market Drivers
- 4.2.1 Rising investments in water and waste-water infrastructure
- 4.2.2 Modernisation of aging power and process plants
- 4.2.3 Stringent environmental regulations on emissions
- 4.2.4 Hydrogen economy scale-up requiring high-pressure valves
- 4.2.5 Digital-twin enabled predictive valve diagnostics
- 4.2.6 Growth of SMRs demanding severe-service valves
- 4.3 Market Restraints
- 4.3.1 Oil-price volatility curbing Oil and Gas CAPEX
- 4.3.2 Pricing pressure from low-cost Asian suppliers
- 4.3.3 Alloy supply-chain disruptions
- 4.3.4 Cyber-security risks in smart positioners
- 4.4 Value / Supply-Chain Analysis
- 4.5 Regulatory Landscape
- 4.6 Technological Outlook
- 4.7 Porter's Five Forces Analysis
- 4.7.1 Bargaining Power of Suppliers
- 4.7.2 Bargaining Power of Buyers
- 4.7.3 Threat of New Entrants
- 4.7.4 Threat of Substitutes
- 4.7.5 Intensity of Competitive Rivalry
- 4.8 Investment Analysis
5 MARKET SIZE AND GROWTH FORECASTS (VALUE)
- 5.1 By Valve Type
- 5.1.1 Globe
- 5.1.2 Ball
- 5.1.3 Butterfly
- 5.1.4 Plug
- 5.1.5 Diaphragm
- 5.1.6 Other Valve Types
- 5.2 By Actuation Technology
- 5.2.1 Pneumatic
- 5.2.2 Hydraulic
- 5.2.3 Electric
- 5.2.4 Manual
- 5.3 By End-user Industry
- 5.3.1 Oil and Gas
- 5.3.2 Chemical, Petrochemical and Fertilizer
- 5.3.3 Energy and Power
- 5.3.4 Water and Waste-water Treatment
- 5.3.5 Metal and Mining
- 5.3.6 Food and Beverage
- 5.3.7 Pharmaceutical
- 5.3.8 Pulp and Paper
- 5.3.9 Other Industries
- 5.4 By Material
- 5.4.1 Steel
- 5.4.2 Cast Iron
- 5.4.3 Alloy-based
- 5.4.4 Plastic (PVC, PP, PVDF)
- 5.4.5 Other Materials
- 5.5 By Geography
- 5.5.1 North America
- 5.5.1.1 United States
- 5.5.1.2 Canada
- 5.5.1.3 Mexico
- 5.5.2 South America
- 5.5.2.1 Brazil
- 5.5.2.2 Argentina
- 5.5.2.3 Rest of South America
- 5.5.3 Europe
- 5.5.3.1 United Kingdom
- 5.5.3.2 Germany
- 5.5.3.3 France
- 5.5.3.4 Italy
- 5.5.3.5 Spain
- 5.5.3.6 Russia
- 5.5.3.7 Rest of Europe
- 5.5.4 APAC
- 5.5.4.1 China
- 5.5.4.2 Japan
- 5.5.4.3 South Korea
- 5.5.4.4 India
- 5.5.4.5 Australia
- 5.5.4.6 Rest of APAC
- 5.5.5 Middle East and Africa
- 5.5.5.1 GCC
- 5.5.5.2 South Africa
- 5.5.5.3 Rest of Middle East and Africa
- 5.5.1 North America
6 COMPETITIVE LANDSCAPE
- 6.1 Market Concentration
- 6.2 Strategic Moves
- 6.3 Market Share Analysis
- 6.4 Company Profiles (includes Global level Overview, Market level overview, Core Segments, Financials as available, Strategic Information, Market Rank/Share for key companies, Products and Services, and Recent Developments)
- 6.4.1 Emerson Electric Co.
- 6.4.2 Flowserve Corporation
- 6.4.3 Baker Hughes Co. (Cameron)
- 6.4.4 Valmet (Metso)
- 6.4.5 IMI plc
- 6.4.6 CIRCOR International Inc.
- 6.4.7 Christian Brkert GmbH
- 6.4.8 Crane Co. Nuclear Division
- 6.4.9 Neway Valve (Suzhou) Co. Ltd
- 6.4.10 ABB Ltd
- 6.4.11 Alfa Laval AB
- 6.4.12 Rotork plc
- 6.4.13 AUMA Riester GmbH
- 6.4.14 Crane Co.
- 6.4.15 SAMSON AG
- 6.4.16 KSB SE and Co. KGaA
- 6.4.17 AVK Holding A/S
- 6.4.18 Cla-Val Co.
- 6.4.19 Velan Inc
- 6.4.20 Spirax-Sarco Engineering plc
7 MARKET OPPORTUNITIES AND FUTURE OUTLOOK
- 7.1 White-space and Unmet-need Assessment
 控制閥市場按閥門類型、材料類型、驅動技術、最終用途行業、銷售管道和應用分類 - 全球預測 2025-2032
 2025年全球控制閥市場報告半導體氣動閥市場:按閥門類型、材料類型、操作類型、端口配置、功能、壓力範圍、配銷通路和應用 - 2025-2030 年全球預測
 全球多孔流量控制閥市場
 全球控制閥市場(按組件、材質、類型、尺寸、行業和地區分類)- 預測至 2030 年
 2025-2033 年控制閥市場報告(按類型、技術、組件、材料、最終用途行業和地區)2025年全球進氣壓力控制閥市場報告全球陶瓷控制閥市場全球飛機空氣閥市場日本控制閥市場報告(按類型、尺寸、技術、組件、材料、最終用途行業和地區)2025-2033