


 |
市場調查報告書
商品編碼
1850025
氮化鎵半導體裝置:市場佔有率分析、產業趨勢、統計數據和成長預測(2025-2030 年)GaN Semiconductor Devices - Market Share Analysis, Industry Trends & Statistics, Growth Forecasts (2025 - 2030) |
||||||
※ 本網頁內容可能與最新版本有所差異。詳細情況請與我們聯繫。
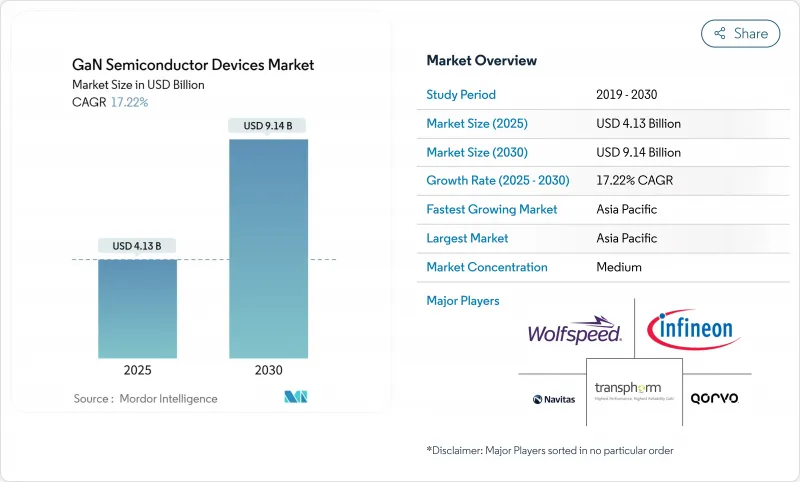
預計到 2025 年,氮化鎵半導體裝置市場規模將達到 41.3 億美元,到 2030 年將達到 91.4 億美元。
這一成長反映了氮化鎵(GaN)相較於傳統矽材料所固有的更高效率、更快開關速度和更優異的散熱性能。同時,日益嚴格的全球能源效率法規促使資料中心營運商和工業OEM廠商尋求基於GaN的轉換級,以降低損耗和冷卻成本。企業投資也印證了這個趨勢,英飛凌和瑞薩等現有企業透過收購擴大GaN產能,而日本和歐盟的區域性激勵措施也加速了能夠處理6吋和8吋晶圓的待開發區的建設。
全球氮化鎵半導體裝置市場趨勢及洞察
中國OEM廠商的藍圖推動了65-240W USB-C PD GaN充電器的普及。
中國消費電子品牌迅速推動了超緊湊型USB(USB)充電器的普及。 2024年推出的新款充電器功率高達240W,但體積卻比同等矽基充電器縮小了40%,零售價格降低了35%。 Anker的GaN Prime系列充電器功率密度超過1.8W/cm³,可在口袋大小的機殼內實現筆記型電腦和行動電話的多重通訊協定充電。成本的下降推動了其在亞太和北美市場的普及,進而帶動了氮化鎵半導體裝置市場的銷售成長。
亞洲和印度的 5G 大規模 MIMO大型基地台部署需要 200W 以上的 GaN-on-SiC 功率放大器
2024年,中國、印度和日本的行動電話電信商在3.5GHz及以上頻寬部署了超過15,000個採用GaN-on-SiC功率放大器的廣域基地台。這項轉變使功耗降低了25%,覆蓋範圍擴大了18%,為日本大型通訊業者每年節省了1,800萬美元的營運成本。這些經濟效益鞏固了GaN功率放大器的應用,並拓展了氮化鎵半導體裝置市場的商機。
由於200mm GaN-on-Si外延晶片供應有限,供應鏈出現瓶頸。
預計到2024年,能夠生產200毫米氮化鎵外延晶圓的優質供應商將不到10家。產量比率比矽基標準低15-20%,限制了產能並維持了高昂的價格。一家歐洲一級汽車供應商的生產延誤了六個月,迫使其建立價值2800萬歐元(3020萬美元)的戰略庫存緩衝。瓶頸正在影響氮化鎵半導體裝置市場的近期銷售。
細分市場分析
預計到2024年,氮化鎵半導體裝置市場中功率半導體部分將佔據55.2%的佔有率,並在2030年之前保持在19.1%的佔有率。資料中心營運商透過升級到效率高達98.2%的氮化鎵伺服器電源,每個設施節省了230萬美元。射頻元件也緊跟其後,因為5G大規模MIMO基礎設施和國防雷達的需求持續強勁。
成熟標誌著一個戰略性的分水嶺。像英飛凌這樣的矽製造商擴展了其車規級氮化鎵MOSFET產品線,而像Wolfspeed這樣的射頻專家則利用碳化矽上氮化鎵的熱餘量,開發出頻率高於3.5 GHz的大型基地台。整合式功率級供應商不再局限於分立元件銷售,而是獲得了更高的利潤。因此,氮化鎵半導體裝置市場經歷了整合和垂直一體化,從而增強了規模優勢。
到2024年,高電子移動性電晶體將佔總收入的57.2%,而單晶片功率積體電路將以31.1%的複合年成長率超越所有其他類別。一家中國智慧型手機OEM廠商透過單一GaN積體電路取代分立開關,將充電器物料成本降低了18%,零件數量減少了45%,推動了銷售成長。
隨著整合化改善電磁相容性並減少寄生效應,氮化鎵半導體元件市場正朝著系統級封裝設計發展,而模組製造商則迎合高功率安裝的需求,二極體在輔助整流領域的銷售依然強勁。
與消費性電子、資料中心和48V工業用電標準相符的100-650V電壓區間,預計到2024年將維持70.3%的市場佔有率。同時,以800V驅動架構為驅動的650V+頻寬,將以42.2%的複合年成長率成長。某高階電動車品牌採用900V氮化鎵(GaN)平台,將10-80%的充電時間縮短至28分鐘,並相比碳化矽(SiC)充電器減輕了3.2公斤的重量。
這項轉變將推動新的分離和測試標準,對純供應商構成挑戰,但氮化鎵半導體裝置市場將獎勵那些能夠檢驗650 V 以上可靠性的供應商,釋放利潤豐厚的汽車價值池。
GaN半導體裝置市場按元件類型(功率半導體、其他)、組件(電晶體、其他)、額定電壓(小於100V、其他)、晶圓尺寸(2英吋、其他)、基板技術(GaN-On-SiC、其他)、封裝(表面黏著技術、其他)、用戶產業(汽車、北美地區、其他國家)。
區域分析
亞太地區將佔2024年銷售額的38.2%,成長最快,複合年成長率達29.1%。中國豐富的鎵資源和國家補貼使Innoscience得以營運全球最大的8吋GaN-on-Si晶圓廠,成本比同業低35%。一家韓國大型家電製造商和一家日本大型汽車製造商成為其大量生產的核心客戶,並維持了需求與產能擴張的良性循環。
北美持續是創新的溫床。一項價值3500萬美元的聯邦晶片創新計劃(CHIPS)撥款幫助GlobalFoundries公司擴大了其位於佛蒙特州的氮化鎵(GaN)產能。一家國防承包商部署了一款基於氮化鎵的相位陣列,在將偵測範圍提高42%的同時,功耗降低了18%,這充分展現了氮化鎵半導體裝置市場在關鍵任務應用方面的優勢。
在歐洲,高階汽車和工業應用場景成為優先考慮的領域。劍橋氮化鎵裝置公司(Cambridge GaN Devices)籌集了3,050萬歐元(約3,310萬美元)用於擴張,反映出投資者對歐洲高功率細分市場的看好。一家德國大型原始設備製造商(OEM)實現了97.8%的充電器效率,並減少了30%的組件,符合歐盟綠色設計指令的要求。拉丁美洲和中東及非洲目前市場佔有率較小,但隨著能源價格和基礎設施建設的融合,這些地區在電訊和智慧城市計劃中展現出令人矚目的成長潛力。
其他福利:
- Excel格式的市場預測(ME)表
- 3個月的分析師支持
目錄
第1章 引言
- 研究假設和市場定義
- 調查範圍
第2章調查方法
第3章執行摘要
第4章 市場情勢
- 市場概覽
- 市場促進因素
- 中國OEM廠商藍圖圖推動65-240W USB-C PD GaN充電器的普及
- 亞洲和印度的 5G 大規模 MIMO大型基地台部署需要 200W 以上的 GaN-on-SiC 功率放大器
- 向 800V 電動車平台的遷移推動了雙向 GaN OBC 和 DC-DC 轉換器的應用。
- 在重量關鍵型電動飛機和電動垂直起降飛行器動力傳動系統中選擇氮化鎵轉換器
- 低衛星群星座衛星過渡到氮化鎵Ku/ Ka波段功率放大器
- 日本和歐盟晶圓廠獎勵加速氮化鎵產能擴張
- 市場限制
- 200毫米GaN-on-Si晶圓供應鏈瓶頸
- 門可靠性挑戰 >175度C 汽車 0 級認證
- 新興市場中低於 3.5GHz 宏功率放大器的成本Delta與 LDMOS 的比較
- E型GaN QFN/CSP封裝的測試/封裝生態系分散
- 價值鏈分析
- 監理與技術展望
- 波特五力分析
- 供應商的議價能力
- 買方的議價能力
- 新進入者的威脅
- 替代品的威脅
- 競爭對手之間的競爭
- 影響市場的宏觀經濟因素
第5章 市場規模與成長預測
- 依設備類型
- 功率半導體
- 射頻半導體
- 光學半導體
- 按組件
- 電晶體(HEMT/FET)
- 二極體(肖特基二極體、PiN二極體)
- 整流器
- 功率積體電路(單晶片、多晶片)
- 模組(半橋、全橋)
- 按額定電壓
- 低於100伏
- 100~650V
- 超過650伏
- 按晶圓尺寸
- 2英吋
- 4吋
- 6吋或以上(包括8吋導輪)
- 透過基板技術
- GaN-on-SiC
- GaN-on-Si
- 藍寶石基板上的氮化鎵
- 體氮化鎵
- 650~1200V
- 1200伏特或以上
- 透過包裝
- 表面黏著技術(QFN、DFN)
- 通孔(TO-220、TO-247)
- 晶片級封裝(CSP)
- 裸晶
- 按最終用戶行業分類
- 汽車與出行
- 電動車
- 充電基礎設施
- 消費性電子產品
- 智慧型手機快速充電器
- 筆記型電腦和平板電腦充電器
- 遊戲主機和虛擬實境
- 通訊和資料通訊
- 5G基地台
- 資料中心電源
- 工業和能源
- 太陽能逆變器
- 馬達驅動
- 電源單元(SMPS)
- 航太與國防
- 雷達系統
- 電子戰
- 衛星有效載荷衛星有效載荷
- 藥品
- 磁振造影和電腦斷層掃描
- 可攜式醫療設備
- 汽車與出行
- 按地區
- 北美洲
- 美國
- 加拿大
- 墨西哥
- 南美洲
- 巴西
- 阿根廷
- 其他南美洲
- 歐洲
- 德國
- 英國
- 法國
- 義大利
- 西班牙
- 其他歐洲地區
- 亞太地區
- 中國
- 日本
- 韓國
- 印度
- 台灣
- 亞太其他地區
- 中東和非洲
- 中東
- 沙烏地阿拉伯
- 阿拉伯聯合大公國
- 土耳其
- 其他中東地區
- 非洲
- 南非
- 其他非洲地區
- 北美洲
第6章 競爭情勢
- 市場集中度
- 策略趨勢
- 市佔率分析
- 公司簡介
- Efficient Power Conversion Corporation
- Navitas Semiconductor
- Transphorm Inc.
- Innoscience Technology Co., Ltd.
- MACOM Technology Solutions Holdings, Inc.
- Tagore Technology Inc.
- VisIC Technologies Ltd.
- Cambridge GaN Devices Ltd.
- NexGen Power Systems, Inc.
- Qromis, Inc.
- EPC Space LLC
- Analog Devices, Inc.
- Power Integrations, Inc.
- Ommic SAS
- Wolfspeed GaN Solutions
- Ampleon Netherlands BV
- Integra Technologies, Inc.
- RFHIC Corporation
- Sumitomo Electric Device Innovations Inc.
- Infineon Technologies AG
- STMicroelectronics NV
- Qorvo Inc.
第7章 市場機會與未來展望
The gallium nitride semiconductor devices market size stood at USD 4.13 billion in 2025 and is forecast to touch USD 9.14 billion by 2030, reflecting a robust 17.22% CAGR.
The surge mirrors GaN's intrinsic ability to deliver higher efficiency, faster switching, and superior thermal performance when compared with legacy silicon. Market momentum was reinforced in 2024 and early 2025 by three concurrent shifts: 800 V electric-vehicle powertrains, large-scale 5G rollouts that require high-power radio-frequency amplifiers, and consumer demand for ultra-compact USB-C chargers exceeding 100 W. At the same time, global energy-efficiency regulations tightened, pushing data-center operators and industrial OEMs toward GaN-based conversion stages that cut losses and shrink cooling overhead. Corporate investment underscored the trend as Infineon, Renesas, and other incumbents expanded GaN capacity through acquisitions, while regional incentives in Japan and the European Union accelerated green-field fabs geared to 6-inch and 8-inch wafers.
Global GaN Semiconductor Devices Market Trends and Insights
Proliferation of 65-240 W USB-C PD GaN Chargers Led by Chinese OEM Road-maps
Chinese consumer-electronics brands propelled a rapid shift toward ultra-compact universal serial bus power-delivery chargers. Models released in 2024 delivered up to 240 W while shrinking volume by 40% relative to silicon equivalents and lowering retail prices by 35%. Anker's GaN Prime line exceeded 1.8 W/cm3 power density, enabling multiprotocol charging for laptops and phones within pocket-sized enclosures. Cost-downs stimulated mainstream uptake across Asia-Pacific and North America, lifting unit volumes that ripple across the gallium nitride semiconductor devices market.
5G Massive-MIMO Macro-Cell Roll-outs Requiring >200 W GaN-on-SiC PAs in Asia and India
Mobile network operators in China, India, and Japan deployed more than 15,000 macro base stations in 2024 using GaN-on-SiC power amplifiers above 3.5 GHz. The switch trimmed power consumption by 25% and stretched coverage by 18%, translating into USD 18 million annual operating expense savings for one leading Japanese carrier. Such economics cement GaN PA design wins and expand addressable revenue across the gallium nitride semiconductor devices market.
Limited 200 mm GaN-on-Si Epi Wafer Supply Chain Bottlenecks
Fewer than 10 qualified suppliers produced 200 mm GaN epitaxial wafers in 2024. Yields sat 15-20% below silicon benchmarks, constraining throughput and sustaining premium pricing. A European Tier-1 automotive supplier recorded a six-month production delay that forced strategic inventory buffers worth EUR 28 million (USD 30.2 million). Bottlenecks weigh on near-term volumes within the gallium nitride semiconductor devices market.
Other drivers and restraints analyzed in the detailed report include:
- Shift to 800 V EV Platforms Driving Bidirectional GaN OBC and DC-DC Adoption
- Weight-Critical More-Electric Aircraft and eVTOL Powertrains Selecting GaN Converters
- Gate Reliability Challenges >175 °C for Automotive Grade-0 Qualification
For complete list of drivers and restraints, kindly check the Table Of Contents.
Segment Analysis
The power-semiconductor slice of the gallium nitride semiconductor devices market held 55.2% share in 2024 and is projected to compound at 19.1% to 2030. Data-center operators saved USD 2.3 million per facility by upgrading to GaN server power supplies that reached 98.2% efficiency. RF devices followed as 5G massive-MIMO infrastructure and defense radar sustained premium demand.
Maturity signaled a strategic fork. Silicon incumbents such as Infineon expanded automotive-grade GaN MOSFET lines, while RF specialists like Wolfspeed leveraged GaN-on-SiC thermal headroom for >3.5 GHz macro cells. Integrated power-stage providers captured a higher margin by moving beyond discrete sales. The gallium nitride semiconductor devices market, therefore, experiences both consolidation and vertical integration, reinforcing scale advantages.
High-electron-mobility transistors occupied 57.2% revenue in 2024, yet monolithic power ICs outpaced all other categories at 31.1% CAGR. A Chinese smartphone OEM cut the charger bill-of-materials by 18% by replacing discrete switches with a single GaN IC, shrinking part count by 45% and catalyzing volume ramps.
Integration improves electromagnetic compatibility and trims parasitics, benefits that explain why the gallium nitride semiconductor devices market is tilting toward system-in-package designs. Module suppliers address high-power installations, while diode sales remain steady in auxiliary rectification roles.
The 100-650 V corridor kept a 70.3% share in 2024 as it aligns with consumer, data-center, and 48 V industrial rails. Meanwhile, the >650 V band races ahead at 42.2% CAGR, fueled by 800 V propulsion architectures. One premium EV brand slashed 10-80% charge time to 28 minutes using 900 V GaN stages and cut charger mass by 3.2 kg versus SiC.
This transition prompts new isolation and test standards, challenging pure-play suppliers. Nevertheless, the gallium nitride semiconductor devices market rewards those able to validate reliability beyond 650 V, unlocking lucrative automotive value pools.
The GaN Semiconductor Devices Market is Segmented by Device Type (Power Semiconductors, and More), Component (Transistors, and More), Voltage Rating (< 100 V, and More), Wafer Size (2-Inch, and More), Substrate Technology (GaN-On-SiC, and More), Packaging (Surface-Mount, and More), End-User Industry (Automotive and Mobility, and More), and Geography (North America, South America, Europe, Asia-Pacific, and Middle East and Africa).
Geography Analysis
Asia-Pacific commanded 38.2% of 2024 sales and remained the fastest riser at 29.1% CAGR. China's access to gallium, plus state subsidies, allowed Innoscience to operate the world's largest 8-inch GaN-on-Si plant at costs 35% below peers. South Korea's consumer-electronics titans and Japan's automotive majors seeded high-volume anchor customers, sustaining a virtuous cycle of demand and capacity growth.
North America stayed an innovation hotbed. Federal CHIPS grants of USD 35 million helped GlobalFoundries broaden GaN capacity in Vermont. Defense contractors deployed GaN-based phased-array radars that boosted detection range by 42% while trimming power by 18%, showcasing mission-critical gains that flow into the gallium nitride semiconductor devices market.
Europe prioritized premium automotive and industrial use cases. Cambridge GaN Devices raised EUR 30.5 million (USD 33.1 million) for expansion, reflecting investor belief in high-power European niches. A leading German OEM realized 97.8% charger efficiency and 30% component reduction, aligning with EU eco-design directives. Latin America, the Middle East, and Africa presently hold modest shares yet demonstrate promising uptake in telecom and smart-city projects as energy prices and infrastructure buildouts converge.
- Efficient Power Conversion Corporation
- Navitas Semiconductor
- Transphorm Inc.
- Innoscience Technology Co., Ltd.
- MACOM Technology Solutions Holdings, Inc.
- Tagore Technology Inc.
- VisIC Technologies Ltd.
- Cambridge GaN Devices Ltd.
- NexGen Power Systems, Inc.
- Qromis, Inc.
- EPC Space LLC
- Analog Devices, Inc.
- Power Integrations, Inc.
- Ommic SAS
- Wolfspeed GaN Solutions
- Ampleon Netherlands B.V.
- Integra Technologies, Inc.
- RFHIC Corporation
- Sumitomo Electric Device Innovations Inc.
- Infineon Technologies AG
- STMicroelectronics N.V.
- Qorvo Inc.
Additional Benefits:
- The market estimate (ME) sheet in Excel format
- 3 months of analyst support
TABLE OF CONTENTS
1 INTRODUCTION
- 1.1 Study Assumptions and Market Definition
- 1.2 Scope of the Study
2 RESEARCH METHODOLOGY
3 EXECUTIVE SUMMARY
4 MARKET LANDSCAPE
- 4.1 Market Overview
- 4.2 Market Drivers
- 4.2.1 Proliferation of 65-240 W USB-C PD GaN Chargers Led by Chinese OEM Road-maps
- 4.2.2 5G Massive-MIMO Macro-Cell Roll-outs Requiring >200 W GaN-on-SiC PAs in Asia and India
- 4.2.3 Shift to 800 V EV Platforms Driving Bidirectional GaN OBC and DC-DC Adoption
- 4.2.4 Weight-Critical More-Electric Aircraft and eVTOL Powertrains Selecting GaN Converters
- 4.2.5 LEO Constellation Satellites Migrating to GaN Ku/Ka-Band SSPAs
- 4.2.6 Japanese and EU Fab Incentives Accelerating GaN Capacity Expansion
- 4.3 Market Restraints
- 4.3.1 Limited 200 mm GaN-on-Si Epi Wafer Supply Chain Bottlenecks
- 4.3.2 Gate Reliability Challenges >175 °C for Automotive Grade-0 Qualification
- 4.3.3 Cost Delta vs. LDMOS in Sub-3.5 GHz Macro PAs in Emerging Markets
- 4.3.4 Fragmented Test/Packaging Ecosystem for E-mode GaN QFN/CSP Packages
- 4.4 Value Chain Analysis
- 4.5 Regulatory and Technological Outlook
- 4.6 Porter's Five Forces Analysis
- 4.6.1 Bargaining Power of Suppliers
- 4.6.2 Bargaining Power of Buyers
- 4.6.3 Threat of New Entrants
- 4.6.4 Threat of Substitutes
- 4.6.5 Intensity of Competitive Rivalry
- 4.7 Impact of Macroeconomic Factors on the market
5 MARKET SIZE AND GROWTH FORECASTS (VALUE)
- 5.1 By Device Type
- 5.1.1 Power Semiconductors
- 5.1.2 RF Semiconductors
- 5.1.3 Opto-Semiconductors
- 5.2 By Component
- 5.2.1 Transistors (HEMT/FET)
- 5.2.2 Diodes (Schottky, PiN)
- 5.2.3 Rectifiers
- 5.2.4 Power ICs (Monolithic, Multi-chip)
- 5.2.5 Modules (Half-bridge, Full-bridge)
- 5.3 By Voltage Rating
- 5.3.1 < 100 V
- 5.3.2 100 - 650 V
- 5.3.3 > 650 V
- 5.4 By Wafer Size
- 5.4.1 2-inch
- 5.4.2 4-inch
- 5.4.3 6-inch and Above (incl. 8-inch Pilot)
- 5.5 By Substrate Technology
- 5.5.1 GaN-on-SiC
- 5.5.2 GaN-on-Si
- 5.5.3 GaN-on-Sapphire
- 5.5.4 Bulk GaN
- 5.5.5 650 - 1200 V
- 5.5.6 > 1200 V
- 5.6 By Packaging
- 5.6.1 Surface-Mount (QFN, DFN)
- 5.6.2 Through-Hole (TO-220, TO-247)
- 5.6.3 Chip-Scale Package (CSP)
- 5.6.4 Bare Die
- 5.7 By End-User Industry
- 5.7.1 Automotive and Mobility
- 5.7.1.1 Electric Vehicles
- 5.7.1.2 Charging Infrastructure
- 5.7.2 Consumer Electronics
- 5.7.2.1 Smartphone Fast Chargers
- 5.7.2.2 Laptop and Tablet Chargers
- 5.7.2.3 Gaming Consoles and VR
- 5.7.3 Telecom and Datacom
- 5.7.3.1 5G Base Stations
- 5.7.3.2 Data Center Power
- 5.7.4 Industrial and Energy
- 5.7.4.1 Solar Inverters
- 5.7.4.2 Motor Drives
- 5.7.4.3 Power Supply Units (SMPS)
- 5.7.5 Aerospace and Defense
- 5.7.5.1 Radar Systems
- 5.7.5.2 Electronic Warfare
- 5.7.5.3 Satellite Payloads
- 5.7.6 Medical
- 5.7.6.1 MRI and CT
- 5.7.6.2 Portable Medical Devices
- 5.7.1 Automotive and Mobility
- 5.8 By Geography
- 5.8.1 North America
- 5.8.1.1 United States
- 5.8.1.2 Canada
- 5.8.1.3 Mexico
- 5.8.2 South America
- 5.8.2.1 Brazil
- 5.8.2.2 Argentina
- 5.8.2.3 Rest of South America
- 5.8.3 Europe
- 5.8.3.1 Germany
- 5.8.3.2 United Kingdom
- 5.8.3.3 France
- 5.8.3.4 Italy
- 5.8.3.5 Spain
- 5.8.3.6 Rest of Europe
- 5.8.4 Asia-Pacific
- 5.8.4.1 China
- 5.8.4.2 Japan
- 5.8.4.3 South Korea
- 5.8.4.4 India
- 5.8.4.5 Taiwan
- 5.8.4.6 Rest of Asia-Pacific
- 5.8.5 Middle East and Africa
- 5.8.5.1 Middle East
- 5.8.5.1.1 Saudi Arabia
- 5.8.5.1.2 United Arab Emirates
- 5.8.5.1.3 Turkey
- 5.8.5.1.4 Rest of Middle East
- 5.8.5.2 Africa
- 5.8.5.2.1 South Africa
- 5.8.5.2.2 Rest of Africa
- 5.8.1 North America
6 COMPETITIVE LANDSCAPE
- 6.1 Market Concentration
- 6.2 Strategic Moves
- 6.3 Market Share Analysis
- 6.4 Company Profiles (includes Global level Overview, Market level overview, Core Segments, Financials as available, Strategic Information, Market Rank/Share for key companies, Products and Services, Recent Developments)
- 6.4.1 Efficient Power Conversion Corporation
- 6.4.2 Navitas Semiconductor
- 6.4.3 Transphorm Inc.
- 6.4.4 Innoscience Technology Co., Ltd.
- 6.4.5 MACOM Technology Solutions Holdings, Inc.
- 6.4.6 Tagore Technology Inc.
- 6.4.7 VisIC Technologies Ltd.
- 6.4.8 Cambridge GaN Devices Ltd.
- 6.4.9 NexGen Power Systems, Inc.
- 6.4.10 Qromis, Inc.
- 6.4.11 EPC Space LLC
- 6.4.12 Analog Devices, Inc.
- 6.4.13 Power Integrations, Inc.
- 6.4.14 Ommic SAS
- 6.4.15 Wolfspeed GaN Solutions
- 6.4.16 Ampleon Netherlands B.V.
- 6.4.17 Integra Technologies, Inc.
- 6.4.18 RFHIC Corporation
- 6.4.19 Sumitomo Electric Device Innovations Inc.
- 6.4.20 Infineon Technologies AG
- 6.4.21 STMicroelectronics N.V.
- 6.4.22 Qorvo Inc.
7 MARKET OPPORTUNITIES AND FUTURE OUTLOOK
- 7.1 White-Space and Unmet-Need Assessment
 2026-2034年全球氮化鎵工業裝置市場規模、佔有率、趨勢與成長分析報告
 氮化鎵半導體裝置市場:2026-2032年全球市場預測(按裝置類型、晶圓尺寸、應用和最終用途產業分類)氮化鎵雷達系統市場:按類型、組件、頻寬、組件範圍和應用分類-2026年至2032年全球預測
 氮化鎵半導體市場:依產品、組件、晶圓尺寸、最終用途、國家及地區分類-全球產業分析、市場規模、市場佔有率及2025年至2032年預測
 高頻氮化鎵半導體市場分析及預測(至2035年):依類型、產品類型、服務、技術、應用、材料類型、裝置、部署類型、最終用戶和功能分類氮化鎵半導體裝置市場分析及預測(至2035年):按類型、產品類型、技術、組件、應用、材料類型、裝置、最終用戶、功能和解決方案分類2026-2034年全球氮化鎵半導體裝置市場規模、佔有率、趨勢和成長分析報告氮化鎵半導體裝置市場:依產品、組件、晶圓尺寸、最終用途、國家及地區分類-全球產業分析、市場規模、市場佔有率及2025年至2032年預測
 GaN HEMT外延晶片:全球市場佔有率和排名、總收入和需求預測(2026-2032年)
 2026年全球氮化鎵半導體裝置市場報告