


 |
市場調查報告書
商品編碼
1849935
中國資料中心冷卻:市場佔有率分析、產業趨勢、統計數據和成長預測(2025-2030)China Data Center Cooling - Market Share Analysis, Industry Trends & Statistics, Growth Forecasts (2025 - 2030) |
||||||
※ 本網頁內容可能與最新版本有所差異。詳細情況請與我們聯繫。
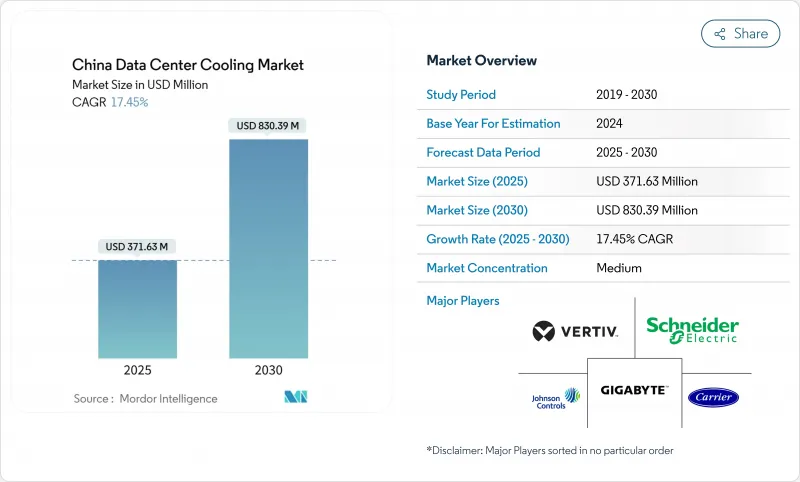
預計到 2025 年,中國資料中心冷卻市場規模將達到 3.7163 億美元,到 2030 年將達到 8.3039 億美元,2025 年至 2030 年的複合年成長率為 17.45%。
強制性的電源使用效率 (PUE) 上限、人工智慧伺服器機架密度不斷提高(其散熱量是傳統工作負載的六到八倍),以及諸如「東部數據」和「西部計算」等政府項目,都在推動對液冷技術的資本投資。營運商優先考慮在一線城市實現 PUE 低於 1.3 的技術,並正從傳統的空氣冷卻系統轉向晶片級直接冷卻、浸沒式冷卻和後門式液冷解決方案。同時,水資源壓力法規也在推動閉合迴路設計的發展,以最大限度地提高散熱效率並最大限度地降低消費量。雖然設備銷售仍然佔據支出的大部分,但隨著設施業主尋求維修和待開發區液冷部署方面的專業知識,對專業服務的需求正在迅速成長。
中國資料中心冷卻市場趨勢及洞察
超大規模資料中心和人工智慧主導的機架密度的興起
現代AI機櫃的功耗高達20-130kW,而傳統伺服器的功耗僅為5-10kW,因此風冷已無法滿足需求,液冷技術也因此廣泛應用。華為的密封液冷機櫃可將冷卻功耗降低96%,並將資料中心的PUE值降至1.1,證明了其在超大規模資料中心環境下的可行性。目前,位於貴安、烏蘭察布和蕪湖的國家級旗艦AI計算叢集正在建設階段指定採用液冷解決方案,這凸顯了資料中心規劃的重大轉變,即散熱設計與晶片性能同等重要。
政府對新建資料中心的PUE上限規定
北京的「十四五」規劃要求所有新建資料中心到2025年PUE值低於1.5,上海則將標準提高到1.3。2023年綠色資料中心標準將擴大合規範圍至用水率和可再生能源利用率,確認液冷是實現大規模能源效率目標的唯一現實途徑。
電費上漲削弱了總擁有成本優勢。
預計資料中心用電量將從2025年的200太瓦時(TWh)增至2030年的400-600太瓦時(TWh),而江蘇和浙江的電價上漲將大幅增加營運成本,足以抵銷舊設備折舊免稅額帶來的成本節約。 「東部數據/西部計算」計畫旨在透過將負載轉移到可再生能源豐富的地區來減輕負擔,但營運商仍需考慮延遲和光纖回程傳輸的限制。
細分市場分析
到2024年,超大規模資料中心將佔中國資料中心冷卻市場收入的46.5%,預計到2030年,其對中國資料中心冷卻市場規模的貢獻將以17.9%的複合年成長率成長。這些公司正在建造單機架功率超過100kW的AI叢集,因此採用液冷技術對於熱感餘量和PUE合規性至關重要。這種規模也降低了單機架的冷卻成本,使其成為企業和邊緣營運商效仿的標竿。然而,在邊緣站點,由於空間和維護方面的限制,緊湊型後門式熱交換器更受歡迎。超大規模資料中心的興起確保了液冷基礎設施在新容量成長中佔據主導地位,而氣動系統則作為輔助選項佔據一席之地。
託管業者正順應這一趨勢,將專用液冷區作為加值服務進行捆綁銷售,將高密度配置轉化為利潤成長和差異化的客戶體驗。企業級設施在全面採用浸沒式冷卻技術方面進展緩慢,但正在試行直接對晶片進行冷卻的迴路,以增強現有冷卻器機組的性能。總而言之,這些舉措表明,隨著各個營運商細分市場向人工智慧賦能的熱感架構邁進,中國資料中心冷卻市場仍保持高速成長。
憑藉成熟的設計框架和運作與資本支出之間的良好平衡,三級資料中心預計在2024年將佔總支出的67.1%。然而,四級資料中心的建設正以19.2%的複合年成長率成長,因為人工智慧訓練工作負載無法容忍即使幾分鐘的計劃外停機。因此,隨著投資人優先考慮容錯性強、可同時維護的液冷系統(即使在維修期間也能將機架溫度保持在30°C以內),中國四級資料中心冷卻市場規模將迅速擴大。
隨著每機架功率和冷卻需求降至15kW以下,一級和二級資料中心的佔地面積正在穩步縮小;而三級資料中心則透過雙迴路液冷基礎設施維修,使營運商能夠在無需額外預算四級資料中心的情況下,滿足客戶新的密度需求。這種分級架構的演進鞏固了液冷技術在中國資料中心冷卻市場人工智慧架構中的基準。
中國資料中心冷卻市場按資料中心類型(超大規模資料中心(自有和租賃)、企業級和邊緣資料中心、託管資料中心)、等級(一級和二級、三級、四級)、冷卻技術(風冷、液冷)以及組件(服務、設備)進行細分。市場預測以美元計價。
其他福利:
- Excel格式的市場預測(ME)表
- 3個月的分析師支持
目錄
第1章 引言
- 研究假設和市場定義
- 調查範圍
第2章調查方法
第3章執行摘要
第4章 市場情勢
- 市場概覽
- 市場促進因素
- 超大規模和人工智慧主導的機架密度爆炸性成長
- 政府為新建築的PUE(能源使用量)設定了上限
- 託管業務快速擴張(機架市佔率年增 51.7%)
- 成熟的液冷供應鏈和本地OEM廠商的規模化生產
- 利用寒冷天氣自然冷卻區的東方數據和西方計算程序
- 將伺服器廢熱轉化為區域供熱網路的收益
- 市場限制
- 高電費削弱了TCO優勢
- 水資源壓力增加會減少蒸發冷卻許可。
- 地方電力配額上限延緩了超大規模計劃
- 對含氟冷媒進口的依賴面臨關稅風險
- 供應鏈分析
- 監管環境
- 技術展望
- 波特五力模型
- 新進入者的威脅
- 買方的議價能力
- 供應商的議價能力
- 替代品的威脅
- 競爭對手之間的競爭
- 影響市場的宏觀經濟因素
第5章 市場規模與成長預測
- 依資料中心類型
- 超大規模資料中心業者(自有和租賃)
- 企業和邊緣運算
- 搭配
- 依層級類型
- 一級和二級
- 三級
- 第四級
- 透過冷卻技術
- 空氣冷卻
- 冷卻器和節熱器(直接膨脹系統)
- 電腦房空調
- 冷卻塔(支援直接冷卻、間接冷卻和兩級冷卻)
- 其他
- 液冷
- 浸沒式冷卻
- 晶片直接冷卻
- 後門熱交換器
- 空氣冷卻
- 按組件
- 透過服務
- 諮詢和培訓
- 安裝與部署
- 維護和支援
- 透過裝置
- 透過服務
第6章 競爭情勢
- 市場集中度
- 策略趨勢
- 市佔率分析
- 公司簡介
- Schneider Electric SE
- Johnson Controls International plc
- GIGA-BYTE Technology Co. Ltd.
- Vertiv Group Corp.
- Carrier Global Corporation
- Rittal GmbH and Co. KG
- Munters Group AB
- Stulz GmbH
- Kstar Science and Technology Co. Ltd.
- Alfa Laval AB
- Huawei Technologies Co. Ltd.
- Hangzhou Envicool Technology Co. Ltd.
- Shenzhen Yimikang Technology Co. Ltd.
- Inspur Group Co. Ltd.
- Lenovo Group Ltd.
- CoolIT Systems Inc.
- Asetek A/S
- Sugon(Dawning Information Industry)
- Midea Group Co. Ltd.(Clivet Division)
- Iceotope Technologies Ltd.
第7章 市場機會與未來展望
The China data center cooling market is valued at USD 371.63 million in 2025 and is forecast to reach USD 830.39 million by 2030, advancing at a 17.45% CAGR during 2025-2030.
Mandatory Power Usage Effectiveness (PUE) caps, surging AI server rack densities that dissipate 6-8 times more heat than legacy workloads, and the government's Eastern Data and Western Compute program are converging to accelerate capital outlays for liquid-based cooling. Operators are prioritizing technology that keeps PUE below 1.3 in Tier 1 cities, driving a pivot away from conventional air systems toward direct-to-chip, immersion, and rear-door liquid solutions. At the same time, water-stress regulations are pushing closed-loop designs that minimise consumption while maximising thermal efficiency. Although equipment sales still dominate spending, demand for specialised services is climbing fast as facility owners seek expertise to retrofit or green-field liquid deployments.
China Data Center Cooling Market Trends and Insights
Surging hyperscale and AI-driven rack densities
Modern AI cabinets consume 20-130 kW versus 5-10 kW for legacy servers, rendering air cooling insufficient and propelling mass adoption of liquid technologies. Huawei's closed liquid-cooled cabinet cuts cooling power by 96% and lowers facility PUE to 1.1, proving viability at the hyperscale level. National flagship AI compute clusters in Gui'an, Ulanqab, and Wuhu now specify liquid solutions at the build-out stage, underscoring a structural shift that places thermal design on par with chip performance in data-center planning.
Government-mandated PUE caps for new builds
Beijing's 14th Five-Year plan requires all new data centers to operate below 1.5 PUE by 2025, while Shanghai tightens the threshold to 1.3. The 2023 Green Data Center standard expands compliance to water-consumption ratios and renewable-energy sourcing, cementing liquid cooling as the only practical route to meet efficiency targets at scale.
High electricity tariffs eroding TCO advantages
Data center power draw is expected to climb from 200 TWh in 2025 toward 400-600 TWh by 2030, with tariffs in Jiangsu and Zhejiang raising operating costs enough to negate savings from legacy equipment depreciation. The Eastern Data and Western Compute initiative counterbalances the burden by relocating load to renewable-rich provinces but requires operators to reconcile latency and fibre-backhaul constraints.
Other drivers and restraints analyzed in the detailed report include:
- Rapid colocation expansion
- Maturing liquid-cooling supply chain and local OEM scale-up
- Growing water-stress curbing evaporative-cooling permits
For complete list of drivers and restraints, kindly check the Table Of Contents.
Segment Analysis
Hyperscalers accounted for 46.5% of 2024 revenue, and their contribution to the China data center cooling market size is forecast to expand at 17.9% CAGR through 2030. These firms build AI clusters that exceed 100 kW per rack, making liquid technology non-negotiable for thermal headroom and PUE compliance. Their scale also drives down per-rack cooling cost, creating a benchmark that enterprise and edge operators now emulate. Edge sites, however, favour compact rear-door heat exchangers due to space and maintenance limits. The hyperscaler wave ensures that liquid infrastructure will dominate new capacity additions, even though air systems retain a retrofit niche.
Colocation operators mirror this trajectory by bundling dedicated liquid zones as premium services, converting density into both margin and differentiated customer experience. Enterprise facilities lag on full immersion adoption but are piloting direct-to-chip loops to stretch existing chiller plants. Combined, these moves keep the China data center cooling market on a high-growth path as every operator segment advances toward AI-ready thermal architectures.
Tier 3 sites captured 67.1% of spending in 2024 thanks to their mature design frameworks and competitive balance of uptime vs. capex. Yet Tier 4 builds are growing at 19.2% CAGR because AI training workloads cannot afford even minutes of unplanned downtime. The China data center cooling market size for Tier 4 facilities will therefore rise swiftly as investors prioritise fault-tolerant, concurrently maintainable liquid systems that keep racks within 30 °C even during maintenance.
Tier 1 and Tier 2 footprints are steadily cannibalised as their power and cooling envelopes top out below 15 kW per rack. Meanwhile, Tier 3 specifications are being retrofitted with dual-loop liquid infrastructure so operators can satisfy new customer density requirements without a green-field Tier 4 budget. This tier evolution reinforces liquid technology as the baseline for any AI-centric build in China's data center cooling market.
China Data Center Cooling Market is Segmented by Data Center Type (Hyperscalers (Owned and Leased), Enterprise and Edge, Colocation), Tier Type (Tier 1 and 2, Tier 3, Tier 4), Cooling Technology (Air Based Cooling, Liquid Based Cooling), Component (Service, Equipment). The Market Forecasts are Provided in Terms of Value (USD).
List of Companies Covered in this Report:
- Schneider Electric SE
- Johnson Controls International plc
- GIGA-BYTE Technology Co. Ltd.
- Vertiv Group Corp.
- Carrier Global Corporation
- Rittal GmbH and Co. KG
- Munters Group AB
- Stulz GmbH
- Kstar Science and Technology Co. Ltd.
- Alfa Laval AB
- Huawei Technologies Co. Ltd.
- Hangzhou Envicool Technology Co. Ltd.
- Shenzhen Yimikang Technology Co. Ltd.
- Inspur Group Co. Ltd.
- Lenovo Group Ltd.
- CoolIT Systems Inc.
- Asetek A/S
- Sugon (Dawning Information Industry)
- Midea Group Co. Ltd. (Clivet Division)
- Iceotope Technologies Ltd.
Additional Benefits:
- The market estimate (ME) sheet in Excel format
- 3 months of analyst support
TABLE OF CONTENTS
1 INTRODUCTION
- 1.1 Study Assumptions and Market Definition
- 1.2 Scope of the Study
2 RESEARCH METHODOLOGY
3 EXECUTIVE SUMMARY
4 MARKET LANDSCAPE
- 4.1 Market Overview
- 4.2 Market Drivers
- 4.2.1 Surging hyperscale and AI-driven rack densities
- 4.2.2 Government-mandated PUE caps for new builds
- 4.2.3 Rapid colocation expansion (+51.7 % rack share YoY)
- 4.2.4 Maturing liquid-cooling supply chain and local OEM scale-up
- 4.2.5 Eastern Data and Western Compute programme exploiting cold-climate free-cooling zones
- 4.2.6 Monetisation of server waste-heat into district-heating grids
- 4.3 Market Restraints
- 4.3.1 High electricity tariffs eroding TCO advantages
- 4.3.2 Growing water-stress curbing evaporative-cooling permits
- 4.3.3 Provincial power-quota caps delaying hyperscale projects
- 4.3.4 Import dependency on fluorinated coolants facing tariff risk
- 4.4 Supply-Chain Analysis
- 4.5 Regulatory Landscape
- 4.6 Technological Outlook
- 4.7 Porter's Five Forces
- 4.7.1 Threat of New Entrants
- 4.7.2 Bargaining Power of Buyers
- 4.7.3 Bargaining Power of Suppliers
- 4.7.4 Threat of Substitutes
- 4.7.5 Competitive Rivalry
- 4.8 Impact of Macroeconomic Factors on the Market
5 MARKET SIZE AND GROWTH FORECASTS (VALUE)
- 5.1 By Data Center Type
- 5.1.1 Hyperscalers (owned and Leased)
- 5.1.2 Enterprise and Edge
- 5.1.3 Colocation
- 5.2 By Tier Type
- 5.2.1 Tier 1 and 2
- 5.2.2 Tier 3
- 5.2.3 Tier 4
- 5.3 By Cooling Technology
- 5.3.1 Air-based Cooling
- 5.3.1.1 Chiller and Economizer (DX Systems)
- 5.3.1.2 CRAH
- 5.3.1.3 Cooling Tower (covers direct, indirect and two-stage cooling)
- 5.3.1.4 Others
- 5.3.2 Liquid-based Cooling
- 5.3.2.1 Immersion Cooling
- 5.3.2.2 Direct-to-Chip Cooling
- 5.3.2.3 Rear-Door Heat Exchanger
- 5.3.1 Air-based Cooling
- 5.4 By Component
- 5.4.1 By Service
- 5.4.1.1 Consulting and Training
- 5.4.1.2 Installation and Deployment
- 5.4.1.3 Maintenance and Support
- 5.4.2 By Equipment
- 5.4.1 By Service
6 COMPETITIVE LANDSCAPE
- 6.1 Market Concentration
- 6.2 Strategic Moves
- 6.3 Market Share Analysis
- 6.4 Company Profiles {(includes Global level Overview, Market level overview, Core Segments, Financials as available, Strategic Information, Market Rank/Share for key companies, Products and Services, and Recent Developments)}
- 6.4.1 Schneider Electric SE
- 6.4.2 Johnson Controls International plc
- 6.4.3 GIGA-BYTE Technology Co. Ltd.
- 6.4.4 Vertiv Group Corp.
- 6.4.5 Carrier Global Corporation
- 6.4.6 Rittal GmbH and Co. KG
- 6.4.7 Munters Group AB
- 6.4.8 Stulz GmbH
- 6.4.9 Kstar Science and Technology Co. Ltd.
- 6.4.10 Alfa Laval AB
- 6.4.11 Huawei Technologies Co. Ltd.
- 6.4.12 Hangzhou Envicool Technology Co. Ltd.
- 6.4.13 Shenzhen Yimikang Technology Co. Ltd.
- 6.4.14 Inspur Group Co. Ltd.
- 6.4.15 Lenovo Group Ltd.
- 6.4.16 CoolIT Systems Inc.
- 6.4.17 Asetek A/S
- 6.4.18 Sugon (Dawning Information Industry)
- 6.4.19 Midea Group Co. Ltd. (Clivet Division)
- 6.4.20 Iceotope Technologies Ltd.
7 MARKET OPPORTUNITIES AND FUTURE OUTLOOK
- 7.1 White-space and Unmet-need Assessment
 資料中心冷卻市場:2026-2032年全球市場預測(以交付方式、系統整合、冷卻方式、額定功率、資料中心類型、最終用戶和部署模式分類)
 全球資料中心冷卻系統市場規模、佔有率、趨勢和成長分析報告(2026-2034年)
 2026年航太港資料中心冷卻全球市場報告
 全球資料中心管道市場:按管道類型、管道材質、應用、資料中心類型和地區分類-預測至2032年英洛冷凍市場:依產品類型、冷凍方式、安裝方式、冷氣量和最終用戶分類-2026-2032年全球預測
 資料中心冷卻市場分析及預測(至2035年):按類型、產品、服務、技術、組件、應用、部署、最終用戶、設備及解決方案分類
 資料中心冷卻市場報告:解決方案、服務、冷卻方法、冷卻技術、資料中心類型、產業和地區(2026-2034 年)整合式機架安裝單元 (CDU) 市場:按階段、容量、應用和最終用戶分類的全球預測,2026-2032 年資料中心CDU市場:按類型、組件、冷卻方式、容量、應用工作負載、最終用途、企業規模、安裝方式、分銷管道分類,全球預測,2026-2032年
 資料中心冷卻市場:依組件、冷卻技術、資料中心類型和行業劃分 - 全球預測至2036年