


 |
市場調查報告書
商品編碼
1848087
儲能:市場佔有率分析、產業趨勢、統計數據和成長預測(2025-2030 年)Energy Storage - Market Share Analysis, Industry Trends & Statistics, Growth Forecasts (2025 - 2030) |
||||||
※ 本網頁內容可能與最新版本有所差異。詳細情況請與我們聯繫。
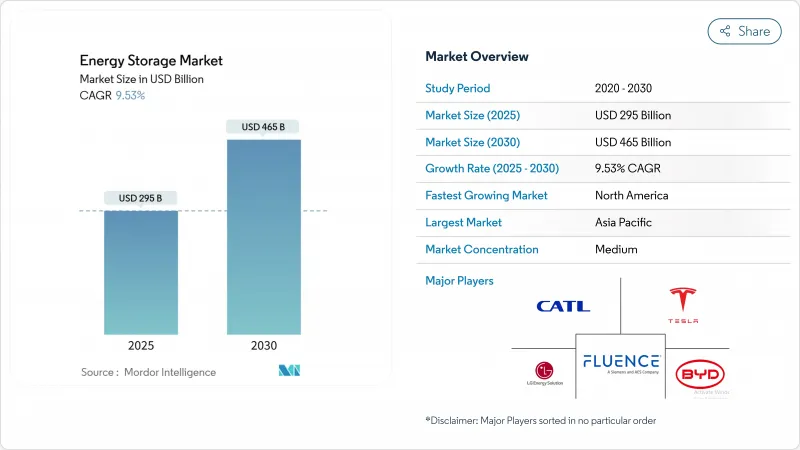
預計到 2025 年,儲能市場規模將達到 2,950 億美元,到 2030 年將達到 4,650 億美元,預測期(2025-2030 年)的複合年成長率為 9.53%。
電池組價格下降、政策獎勵鼓勵獨立儲能以及隨著太陽能和風能發電組合的擴大,對靈活容量的需求日益成長,這些因素共同推動了儲能規模的擴大。磷酸鐵鋰(LFP)技術成本的快速下降、向六小時以上續航時間的電池能源儲存系統(BESS)的轉變以及交通運輸電氣化的加速,都進一步鞏固了當前的成長動能。競爭格局同樣瞬息萬變:中國供應商追求成本領先和全球契約,而北美和歐洲的系統整合商則更注重軟體、電網形成控制和安全合規性。在那些重視多小時調度能力和低生命週期成本的市場中,熱電池、重力電池和液流電池等長壽命技術正開始與鋰離子電池形成互補。
全球儲能市場趨勢與洞察
磷酸鐵鋰電池成本的快速下降將推動電池續航時間達到6小時或更長的儲能系統(BESS)的普及。
2024年,磷酸鐵鋰電池(LFP)價格將創歷史新低,僅115美元/度數,使其穩固確立了長壽命電池儲能系統(BESS)的核心地位。預計到2024年,磷酸鐵鋰電池的裝置佔有率將達到88%,其安全性優勢降低了授權和保險門檻,並允許電力公司用放電時間長達10小時的電池儲能系統取代燃氣儲能系統。中國的過剩供應正在增強買方的影響力,並加速美國和歐洲的吉瓦級採購。
電網級獎勵機制加速市場轉型
美國《通貨膨脹與復甦法案》(IRA)的投資稅額扣抵使得2024年新增電池儲能容量達到11.9吉瓦,預計2025年將新增18.2吉瓦。歐盟的《可再生能源指令III》也帶來了類似的推動力,該指令要求提高再生能源的滲透率;此外,中國的長期儲能目標也在推動液流電池技術的創新。公共津貼,例如加州能源委員會提供的2.7億美元長期試點項目,正在彌合實驗室規模與商業規模之間的差距。
適宜水庫選址的匱乏限制了抽水蓄能發電的發展。
目前,抽水蓄能電站全球儲電量約為9,000吉瓦時,但在歐洲、日本及北美部分地區,新建待開發區的前景十分渺茫。授權可能需要八年甚至更長時間,這削弱了該技術的成本優勢。利用廢棄封閉式的閉迴路系統(例如Energy Vault公司的撒丁島計劃)和重力系統旨在保留長期運作的可能性,但尚未在同等規模上得到驗證。
細分市場分析
預計到2024年,電池系統將佔據490億美元的儲能市場,並在2030年之前以16.5%的複合年成長率成長。價格低於115美元/千瓦時的磷酸鐵鋰電池組能夠實現8小時的調度,使其在日間套利週期中與傳統的抽水蓄能系統競爭。同時,由於水庫用地短缺、授權週期長以及環境限制等因素,歐洲和日本的新計畫停滯不前,預計到2024年,抽水蓄能系統的市場佔有率將下降至84%。
在需要數天甚至數週儲能的場景下,熱電池、重力電池和液流電池正獲得越來越多的支援。鐵空氣電池技術近期獲得了4.05億美元的資金籌措,預計將實現100小時的放電窗口;而鋅溴液流電池和釩液流電池則規避了鋰供應風險。混合拓撲結構允許重力儲能或壓縮空氣儲能模組提供基本負載放電,同時電池在電網故障發生後的最初幾分鐘內提供輔助設備服務。
儲能市場報告按技術(電池、抽水蓄能、熱能儲存、壓縮空氣儲能、液態空氣/低溫儲存、飛輪儲能等)、連接類型(併網和離網)、應用(電網級公用事業、住宅用戶側儲能等)和地區(北美、歐洲、亞太、南美以及中東和非洲)進行細分。
區域分析
亞太地區將在2024年佔全球銷售額的43%,是供應鏈規模化發展的核心。光是中國一國,2024年就將新增81吉瓦時儲能容量,超過世界其他地區的總合,這主要得益於其2025年可再生能源佔比達到33%的目標。澳洲在住宅儲能部署方面處於領先地位,屋頂太陽能的高滲透率和浮動收費系統加速了配套儲能電池的投資回報。印度將於2025年安裝其首個獨立公用事業儲能系統,這標誌著混合可再生能源園區採購週期的開始。
北美是成長最快的地區,預計到2030年將以14.5%的複合年成長率成長。 IRA對獨立儲能的直接獎勵降低了以往太陽能併網的要求,從而釋放了主要集中在加利福尼亞州和德克薩斯的吉瓦級儲能項目。美國能源資訊署(EIA)預測,到2025年,電池儲能將佔新增發電量的18.2吉瓦,僅次於太陽能光電發電。區域趨勢強調在極端天氣事件導致的停電後增強電力系統的恢復能力,這進一步推動了對微電網和社區儲能方案的需求。
預計到2023年,歐洲發電裝置容量將年增94%,達到1,720萬千瓦時。德國運作,這得益於其高昂的零售價格和簡化的授權,預計到2024年底,將有1.9吉瓦時的大型系統投入運作。英國和法國雖然落後,但也有數百吉瓦的裝置容量正在籌建中,這得益於容量市場收入和電網平衡服務。從住宅用電向公用事業規模的轉變也體現在道達爾能源公司(TotalEnergies)位於德國的新建100兆瓦/200兆瓦時電站項目中,該項目將太陽能光伏發電與兩小時的儲能系統相結合,用於白天的電力平滑。
其他福利:
- Excel格式的市場預測(ME)表
- 3個月的分析師支持
目錄
第1章 引言
- 研究假設和市場定義
- 調查範圍
第2章調查方法
第3章執行摘要
第4章 市場情勢
- 市場概覽
- 市場促進因素
- 磷酸鐵鋰電池成本的快速下降將推動續航時間超過6小時的儲能系統(BESS)在亞太地區的普及。
- 電網級獎勵機制(美國IRA、歐盟RED III、中國長期義務)
- 海灣合作理事會可再生能源併網目標強制要求,促進火力發電和壓縮空氣儲能的發展。
- 資料中心電源品質需求 飛輪和儲能系統(北美,北歐)
- 需要固定儲能設施的電動車充電走廊建設計畫
- 企業購電協議的快速成長推動了用戶側儲能的發展(歐盟、澳洲)
- 市場限制
- 缺乏合適的蓄水庫選址限制了抽水蓄能發電的新建(歐盟、日本)
- 釩/鋅電解供應不穩定阻礙了液流電池的規模化生產。
- 嚴格的消防規範(NFPA 855、IEC 62933)推動了都市區對儲能系統(BESS)的投資。
- 新興市場收入累積的不確定性
- 供應鏈分析
- 政府政策和法規
- 技術展望
- 儲能價格趨勢及預測
- 裝置容量和滲透率分析
- 五力分析
- 供應商的議價能力
- 買方的議價能力
- 新進入者的威脅
- 替代品的威脅
- 競爭對手之間的競爭強度
第5章 市場規模與成長預測
- 透過技術
- 電池(鋰離子電池、固體鋰電池、鈉離子電池、鉛酸電池、鈉硫電池、液流電池(釩電池、溴化鋅電池))
- 抽水蓄能發電
- 熱能儲存(顯熱(熔鹽、水)、潛熱(相變材料)、熱化學)
- 壓縮空氣儲能
- 液態空氣/低溫存儲
- 飛輪儲能
- 重力儲能
- 利用氫能進行能量儲存(電能轉換為氫能)
- 其他新興技術(鐵空氣複合技術、鋅空氣複合技術)
- 連結性別
- 併網
- 離網
- 透過使用
- 網格尺度公用事業(電錶正面)
- 住宅電錶後端
- 商業和工業用電錶後端
- 資料中心和關鍵設施
- 偏遠地區及離網/微電網
- 其他(交通/鐵路電氣化、電動車充電基礎設施、電力傳輸和分配的延期)
- 按地區
- 北美洲
- 美國
- 加拿大
- 墨西哥
- 歐洲
- 英國
- 德國
- 法國
- 西班牙
- 北歐國家
- 俄羅斯
- 其他歐洲
- 亞太地區
- 中國
- 印度
- 日本
- 韓國
- 東南亞國協
- 亞太其他地區
- 南美洲
- 巴西
- 阿根廷
- 哥倫比亞
- 其他南美洲
- 中東和非洲
- 阿拉伯聯合大公國
- 沙烏地阿拉伯
- 南非
- 埃及
- 其他中東和非洲地區
- 北美洲
第6章 競爭情勢
- 市場集中度
- 策略性舉措(併購、夥伴關係、購電協議)
- 市場佔有率分析(主要企業的市場排名/佔有率)
- 公司簡介
- Contemporary Amperex Technology Co. Ltd.(CATL)
- LG Energy Solution Ltd.
- Tesla Inc.
- BYD Co. Ltd.
- Fluence Energy Inc.
- Wartsila Energy
- Siemens Gamesa Renewable Energy
- GS Yuasa Corporation
- NGK Insulators Ltd.
- Samsung SDI Co. Ltd.
- General Electric(Vernova)
- ABB Ltd.
- Hitachi Energy Ltd.
- Eaton Corporation
- Mitsubishi Power Americas|
- AES Corporation
- Voith Hydro GmbH
- ANDRITZ AG
- Hydrostor Inc.
- Highview Powe
- Amber Kinetics Inc
第7章 市場機會與未來展望
The Energy Storage Market size is estimated at USD 295 billion in 2025, and is expected to reach USD 465 billion by 2030, at a CAGR of 9.53% during the forecast period (2025-2030).
This scale-up rests on falling battery pack prices, policy incentives that reward standalone storage, and a rising need for flexible capacity as solar and wind portfolios expand. Rapid cost declines in lithium-iron-phosphate (LFP) technology, the pivot to >6-hour battery energy storage systems (BESS), and the accelerating electrification of transport all reinforce the current growth trajectory. Competitive dynamics are equally fluid: Chinese suppliers are pursuing cost leadership and global contracts, while North American and European integrators emphasize software, grid-forming controls, and safety compliance. Longer-duration technologies-thermal, gravity, and flow batteries-are beginning to complement lithium-ion in markets that prize multi-hour dispatchability and low lifetime cost.
Global Energy Storage Market Trends and Insights
Rapid LFP Battery Cost Declines Driving >6-Hour BESS Adoption
Record lows of USD 115/kWh in 2024 firmly repositioned LFP as the anchor chemistry for long-duration BESS. With 88% share of 2024 installations, the chemistry's safety profile is easing permitting and insurance barriers while enabling utilities to displace gas peakers for up to 10 hours of discharge. Chinese oversupply is reinforcing buyer leverage, accelerating multigigawatt procurement rounds in the United States and Europe.
Grid-Scale Incentive Schemes Accelerating Market Transformation
Investment tax credits under the U.S. Inflation Reduction Act (IRA) unlocked 11.9 GW of storage additions in 2024 and a pipeline of 18.2 GW for 2025. Similar momentum stems from the EU Renewable Energy Directive III, which mandates higher renewables penetration, and China's long-duration storage targets that foster flow-battery innovation. Public grants, such as the California Energy Commission's USD 270 million program for long-duration pilots, are bridging the gap between lab and commercial scale.
Scarcity of Suitable Reservoir Sites Limiting New Pumped Hydro
Although pumped hydro still stores about 9,000 GWh worldwide, greenfield prospects are scarce in Europe, Japan, and parts of North America. Permitting can exceed 8 years, eroding the technology's cost advantage. Closed-loop concepts and gravity systems repurposing disused mine shafts, such as Energy Vault's Sardinia project, aim to keep long-duration options alive but remain unproven at comparable scale.
Other drivers and restraints analyzed in the detailed report include:
- Mandatory GCC Renewable-Integration Targets Boosting Thermal & CAES
- Data-Center Power-Quality Demands Spurring Flywheel & BESS
- Fire Safety Regulations Increasing Urban Storage Costs
For complete list of drivers and restraints, kindly check the Table Of Contents.
Segment Analysis
Battery systems delivered USD 49 billion of the energy storage market size in 2024 and are forecast to expand at a 16.5% CAGR through 2030. LFP packs under USD 115/kWh are allowing 8-hour dispatch to compete with conventional pumped hydro for daily arbitrage cycles. Meanwhile, the energy storage market share of pumped-storage hydroelectricity slipped to 84% in 2024 as reservoir-site scarcity, long permitting cycles, and environmental constraints stalled new projects in Europe and Japan.
Thermal, gravity, and flow batteries are gaining traction where multi-day or week-long storage is desired. Iron-air technology, backed by USD 405 million of recent funding, promises 100-hour discharge windows, while zinc-bromine and vanadium flow stacks avoid lithium supply risks. Hybrid topologies are proliferating: gravity or CAES modules supply baseload discharge while batteries handle ancillary services in the first minutes after a grid event.
The Energy Storage Market Report is Segmented by Technology (Batteries, Pumped-Storage Hydroelectricity, Thermal Energy Storage, Compressed Air Energy Storage, Liquid Air/Cryogenic Storage, Flywheel Energy Storage, and Others), Connectivity (On-Grid and Off-Grid), Application (Grid-Scale Utility, Residential Behind-The-Meter, and Others), and Geography (North America, Europe, Asia-Pacific, South America, and Middle East and Africa)
Geography Analysis
Asia-Pacific retained 43% of 2024 revenue and is central to supply-chain scale-up. China alone installed 81 GWh in 2024-more than the rest of the world combined-bolstered by its 33% renewable-energy share target for 2025. Australia leads residential adoption as high rooftop-solar penetration and volatile tariffs accelerate payback for paired batteries. India's first stand-alone utility BESS in 2025 signals an emerging procurement cycle aimed at hybrid renewable parks.
North America is the fastest-growing region at a projected 14.5% CAGR through 2030. The IRA's direct incentive for stand-alone storage flattened the previous solar-coupling requirement, unleashing gigawatt-scale pipelines centered in California and Texas. The U.S. Energy Information Administration expects batteries to supply 18.2 GW of new utility-scale capacity in 2025, second only to solar additions. Regional focus on resilience after extreme-weather outages further reinforces demand for microgrids and community-storage schemes.
Europe recorded a 94% y-o-y capacity jump in 2023, reaching 17.2 GWh. Germany dominates with 1.9 GWh of large-scale systems in operation by late-2024, aided by high retail prices and streamlined permitting. The United Kingdom and France trail but have multigigawatt pipelines backed by capacity-market revenue and grid-balancing services. The continent's shift from residential to utility-scale projects is evident in TotalEnergies' new 100 MW/200 MWh German site that pairs solar with two-hour storage for intraday smoothing.
- Contemporary Amperex Technology Co. Ltd. (CATL)
- LG Energy Solution Ltd.
- Tesla Inc.
- BYD Co. Ltd.
- Fluence Energy Inc.
- Wartsila Energy
- Siemens Gamesa Renewable Energy
- GS Yuasa Corporation
- NGK Insulators Ltd.
- Samsung SDI Co. Ltd.
- General Electric (Vernova)
- ABB Ltd.
- Hitachi Energy Ltd.
- Eaton Corporation
- Mitsubishi Power Americas |
- AES Corporation
- Voith Hydro GmbH
- ANDRITZ AG
- Hydrostor Inc.
- Highview Powe
- Amber Kinetics Inc
Additional Benefits:
- The market estimate (ME) sheet in Excel format
- 3 months of analyst support
TABLE OF CONTENTS
1 Introduction
- 1.1 Study Assumptions & Market Definition
- 1.2 Scope of the Report
2 Research Methodology
3 Executive Summary
4 Market Landscape
- 4.1 Market Overview
- 4.2 Market Drivers
- 4.2.1 Rapid LFP Battery Cost Declines Driving >6-Hour BESS Adoption (Asia-Pacific
- 4.2.2 Grid-Scale Incentive Schemes (IRA-US, EU RED III, China Long-Duration Mandate
- 4.2.3 Mandatory GCC Renewable-Integration Targets Boosting Thermal & CAES
- 4.2.4 Data-Center Power-Quality Demands Spurring Flywheel & BESS (NA, Nordics)
- 4.2.5 EV-Charging Corridor Build-outs Requiring Stationary Storage
- 4.2.6 Corporate PPA Surge Triggering Behind-the-Meter Storage (EU, AUS)
- 4.3 Market Restraints
- 4.3.1 Scarcity of Suitable Reservoir Sites Limiting New Pumped Hydro (EU, JP)
- 4.3.2 Vanadium/Zinc Electrolyte Supply Volatility Hindering Flow-Battery Scale-up
- 4.3.3 Stringent Fire Codes (NFPA 855, IEC 62933) Raising Urban BESS CAPEX
- 4.3.4 Revenue-Stacking Uncertainty in Emerging Markets
- 4.4 Supply-Chain Analysis
- 4.5 Government Policies & Regulations
- 4.6 Technological Outlook
- 4.7 Energy Storage Price Trends & Forecast
- 4.8 Installed Capacity & Deployment Analysis
- 4.9 Porter's Five Forces
- 4.9.1 Bargaining Power of Suppliers
- 4.9.2 Bargaining Power of Buyers
- 4.9.3 Threat of New Entrants
- 4.9.4 Threat of Substitutes
- 4.9.5 Intensity of Competitive Rivalry
5 Market Size & Growth Forecasts
- 5.1 By Technology
- 5.1.1 Batteries (Lithium-ion, Solid-State Li, Sodium-ion, Lead-acid, Sodium-Sulfur, and Flow Batteries (Vanadium, Zinc-Bromine))
- 5.1.2 Pumped-Storage Hydroelectricity
- 5.1.3 Thermal Energy Storage (Sensible Heat (Molten Salt, Water), Latent Heat (Phase-Change Materials), Thermochemical)
- 5.1.4 Compressed Air Energy Storage
- 5.1.5 Liquid Air/Cryogenic Storage
- 5.1.6 Flywheel Energy Storage
- 5.1.7 Gravity-Based Storage
- 5.1.8 Hydrogen-Based Storage (Power-to-H2-to-Power)
- 5.1.9 Other Emerging Technologies (Iron-Air, Zinc-Air)
- 5.2 By Connectivity
- 5.2.1 On-Grid
- 5.2.2 Off-Grid
- 5.3 By Application
- 5.3.1 Grid-Scale Utility (Front-of-Meter)
- 5.3.2 Residential Behind-the-Meter
- 5.3.3 Commercial and Industrial Behind-the-Meter
- 5.3.4 Data Centers and Critical Facilities
- 5.3.5 Remote and Off-Grid/Microgrids
- 5.3.6 Others (Transportation and Rail Electrification, EV-Charging Infrastructure, Transmission and Distribution Deferral)
- 5.4 By Geography
- 5.4.1 North America
- 5.4.1.1 United States
- 5.4.1.2 Canada
- 5.4.1.3 Mexico
- 5.4.2 Europe
- 5.4.2.1 United Kingdom
- 5.4.2.2 Germany
- 5.4.2.3 France
- 5.4.2.4 Spain
- 5.4.2.5 Nordic Countries
- 5.4.2.6 Russia
- 5.4.2.7 Rest of Europe
- 5.4.3 Asia-Pacific
- 5.4.3.1 China
- 5.4.3.2 India
- 5.4.3.3 Japan
- 5.4.3.4 South Korea
- 5.4.3.5 ASEAN Countries
- 5.4.3.6 Rest of Asia-Pacific
- 5.4.4 South America
- 5.4.4.1 Brazil
- 5.4.4.2 Argentina
- 5.4.4.3 Colombia
- 5.4.4.4 Rest of South America
- 5.4.5 Middle East and Africa
- 5.4.5.1 United Arab Emirates
- 5.4.5.2 Saudi Arabia
- 5.4.5.3 South Africa
- 5.4.5.4 Egypt
- 5.4.5.5 Rest of Middle East and Africa
- 5.4.1 North America
6 Competitive Landscape
- 6.1 Market Concentration
- 6.2 Strategic Moves (M&A, Partnerships, PPAs)
- 6.3 Market Share Analysis (Market Rank/Share for key companies)
- 6.4 Company Profiles (includes Global level Overview, Market level overview, Core Segments, Financials as available, Strategic Information, Products & Services, and Recent Developments)
- 6.4.1 Contemporary Amperex Technology Co. Ltd. (CATL)
- 6.4.2 LG Energy Solution Ltd.
- 6.4.3 Tesla Inc.
- 6.4.4 BYD Co. Ltd.
- 6.4.5 Fluence Energy Inc.
- 6.4.6 Wartsila Energy
- 6.4.7 Siemens Gamesa Renewable Energy
- 6.4.8 GS Yuasa Corporation
- 6.4.9 NGK Insulators Ltd.
- 6.4.10 Samsung SDI Co. Ltd.
- 6.4.11 General Electric (Vernova)
- 6.4.12 ABB Ltd.
- 6.4.13 Hitachi Energy Ltd.
- 6.4.14 Eaton Corporation
- 6.4.15 Mitsubishi Power Americas |
- 6.4.16 AES Corporation
- 6.4.17 Voith Hydro GmbH
- 6.4.18 ANDRITZ AG
- 6.4.19 Hydrostor Inc.
- 6.4.20 Highview Powe
- 6.4.21 Amber Kinetics Inc
7 Market Opportunities & Future Outlook
- 7.1 White-space & Unmet-Need Assessment
 儲能市場:依技術、時長、配置和最終用戶分類-2026-2032年全球市場預測
 可再生能源儲存市場預測至2034年-全球分析(按儲存技術、再生能源來源整合、系統類型、容量、所有權、連接方式、組件、應用、最終用戶和地區分類)
 2026-2030年全球人工智慧資料中心可再生能源儲存市場氨基儲能市場預測:至2034年-按儲能類型、技術、應用、最終用戶和地區分類的全球分析雷射核融合中子源市場:按雷射類型、能量範圍、應用和終端用戶產業分類-全球預測,2026-2032年
 儲能市場規模、佔有率和成長分析:按技術、連接方式、產品、應用、最終用途和地區分類-2026-2033年產業預測儲能電感器市場按產品類型、磁芯材料、電路類型、繞組類型、輸入電壓、端子、應用和終端用戶-全球預測,2026-2032年
 全球先進半導體市場規模、佔有率及預測(依技術節點、產品類型、應用、終端用戶產業及封裝技術劃分)
 離網電池儲能市場規模、佔有率、成長及全球產業分析:按類型、應用和地區分類的洞察,2026-2034年預測可再生能源併網電力電子元件,全球市場預測至2034年:按元件類型、應用、最終用戶和地區分類