


 |
市場調查報告書
商品編碼
1848017
美國曳引機市場佔有率分析、行業趨勢、統計數據和成長預測(2025-2030 年)United States Tractor - Market Share Analysis, Industry Trends & Statistics, Growth Forecasts (2025 - 2030) |
||||||
※ 本網頁內容可能與最新版本有所差異。詳細情況請與我們聯繫。
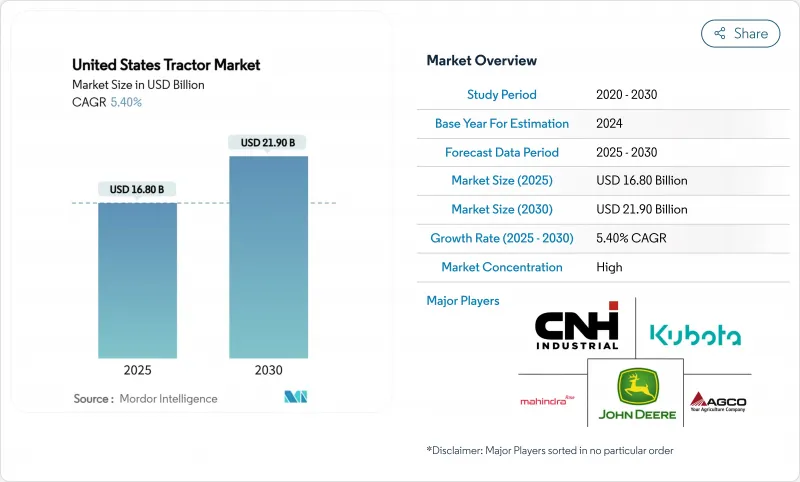
預計 2025 年美國曳引機市場規模將達到 168 億美元,2030 年將達到 219 億美元,預測期內複合年成長率為 5.4%。
強勁的更換需求、40馬力以下車型的快速電氣化以及嵌入式自動駕駛技術正在塑造美國曳引機市場。儘管Tier 4下線引擎成本構成阻力,但即時遠端資訊處理、農業法案激勵措施和碳權收益正在共同推動投資收益。前五名供應商佔據了美國曳引機市場89.6%的佔有率,競爭異常激烈,這不僅強化了定價紀律,也加速了功能部署。監管、互聯互通差距和經銷商整合的相互作用表明,市場正在轉向整合技術方案,這些方案有望在多個作物週期內實現可量化的節省。
美國曳引機市場趨勢與洞察
100匹馬力以下車型繼續電氣化
40 馬力以下的電池供電曳引機現在提供了可觀的回報,因為降低的營業成本可以在三到六個季節內抵消初始支出。約翰迪爾的 E-Power 原型機和 Solectrac 緊湊型系列表明早期產量主要集中在葡萄園、酪農和溫室作業,這些地方低噪音和零廢氣排放至關重要。雖然研發重點是緊湊型系列,但由於電池密度仍限制了大型裝置,預計零件價格自 2023 年以來將下降 14%,從而縮小柴油價格優勢。經銷商教育和充電基礎設施獎勵仍然是限制因素,但《農業法案》的氣候分配正在鼓勵試點採用。約翰迪爾的商業推廣計畫於 2026 年進行,這使得競爭對手面臨越來越短的時間來吸引早期採用者。
智慧實施相容性推動更換需求
該方案有意限制了向後相容性,迫使農民不得不以舊換新,更換使用6到8年的曳引機,而不是傳統的11年周期。這種激增在40-100馬力的曳引機上最為明顯,因為這類曳引機的連作作業依賴於分段控制。因此,目標商標產品製造商 (OEM) 正在將帶有導航功能的線束作為標準配置,以搶佔更換的佔有率。一旦裝置量達到臨界點,這種順風效應將在2027年達到高峰。
Tier-4 Final 引擎的初始成本和維護成本高
符合 Tier 4 Final 標準將導致標價上漲 15% 以上,並引入廢氣處理液收費,這將侵蝕家庭農場主的淨利率。雖然顆粒物排放將減少 95%,但更長的投資回收期將導致許多生產商購買 Tier 4 之前的二手設備或推遲更換。隨著零件供應商提高產量和次市場價格趨於正常化,預計這種緊張關係將在 2026 年後得到緩解。
細分分析
受電池成本下降和政府獎勵的推動,40馬力以下的電動曳引機預計將以10.8%的複合年成長率成長,幾乎是美國曳引機市場整體規模的兩倍。該細分市場受益於溫室、酪農和城市農業,這些產業優先考慮零排放、低噪音性能。到2024年,40-100馬力的電動曳引機將維持美國曳引機市場佔有率的51%。 100馬力以上的電動曳引機用於大型農場,在這些農場中,柴油的能量密度仍然最低,每英畝成本最低。
電動式農機新進者更重視的是擁有成本指標,而非環境保護,理由是燃油節省60%,維護成本降低40%。迪爾公司130馬力的E-Power原型機凸顯了向可擴展電氣化的轉變,但由於電池質量較大,大型車架的採用仍處於試驗階段。 Solectrac的銷售額從2021年的180萬美元成長到2022年的1,100萬美元,但其淨虧損顯示基礎建設的障礙仍然存在。如果磷酸鋰鐵化學技術普及,到2027年,電池組成本可能會下降20%,從而有可能削弱柴油的領先。
到2024年,多用途曳引機將佔總出貨量的41%,這反映出它們適用於多種作業,包括家牛運輸、乾草運輸和物業管理。儘管如此,果園和葡萄園曳引機的成長速度仍將超過美國曳引機市場的平均水平,到2030年,複合年成長率將達到11.4%。它們的高價位源自於其窄底盤、自動控制設備以及零排放動力傳動系統,這些系統在窄行行距下表現優異。田間曳引機的需求保持穩定,這與玉米和大豆種植面積息息相關,但隨著原始設備製造商在高馬力性能和價格敏感型種植者之間尋找平衡,其利潤壓力正變得越來越大。
Case IH 的 FieldOps 平台及其 Connectivity Included 功能免除了新果園曳引機的資訊服務費,從而降低了使用壽命成本並促進了其普及。加州優質水果種植者支付高昂的價格,因為其每英畝利潤率高於商品作物。隨著時間的推移,像雷射雷達導引噴霧器這樣的專業設備中經過驗證的技術可能會逐漸融入主流實用車型,隨著產量的增加和零件價格的下降,其吸引力也將進一步擴大。
其他福利:
- Excel 格式的市場預測 (ME) 表
- 3個月的分析師支持
目錄
第1章 引言
- 研究假設和市場定義
- 調查範圍
第2章調查方法
第3章執行摘要
第4章 市場狀況
- 市場概況
- 市場促進因素
- 100匹馬力以下車型繼續電氣化
- 更智慧的設備正在推動更換需求的成長
- 先進的遠端資訊處理技術降低整體擁有成本
- 2023年美國農業法案中的精密農業獎勵措施
- 自主改裝套件達到零售價格分佈
- 低馬力曳引機的碳權收益
- 市場限制
- Tier-4 Final 引擎的初始成本和維護成本高
- 山區經銷商覆蓋範圍有限
- 缺乏配備感測器的車型的熟練技術人員
- 農村地區 5G 普及速度緩慢,限制了即時資訊服務
- 監管狀況
- 技術展望
- 波特五力分析
- 新進入者的威脅
- 買方的議價能力
- 供應商的議價能力
- 替代品的威脅
- 競爭對手之間的競爭強度
第5章市場規模及成長預測
- 按馬力
- 小於40馬力
- 40-100馬力
- 100馬力或以上
- 按曳引機類型
- 多功能曳引機
- 旱地農用曳引機
- 果園和葡萄園曳引機
- 其他曳引機
- 按驅動類型
- 兩輪驅動(2WD)
- 四輪驅動(4WD)
- 自動駕駛/無人駕駛
- 按用途
- 穀物和油籽
- 水果和蔬菜
- 家畜
- 其他
第6章 競爭態勢
- 市場集中度
- 策略舉措
- 市佔率分析
- 公司簡介
- Deere and Company
- CNH Industrial NV
- AGCO Corporation
- Kubota Corporation
- Mahindra&Mahindra Ltd.
- CLAAS KGaA mbH
- SDF SpA(Deutz-Fahr)
- LS Mtron Ltd.
- Daedong-USA, Inc.
- Yanmar Holdings Co., Ltd.
- TYM Corporation
- Asko Holding
- JC Bamford Excavators Ltd.
- Doosan Bobcat
- Monarch Tractor
第7章 市場機會與未來展望
The United States tractor market size is valued at USD 16.8 billion in 2025 and is projected to reach USD 21.9 billion by 2030, registering a 5.4% CAGR during the forecast period.
Strong replacement demand, rapid electrification below 40 HP, and embedded autonomy are shaping the United States tractor market as growers look to offset rising labor costs and compliance spending. Real-time telematics, Farm Bill incentives, and carbon-credit monetization together lift return on investment, even as Tier-4 final engine costs add headwinds. Competitive behavior remains intense because the top five vendors control 89.6% of the United States tractor market, reinforcing price discipline while accelerating feature roll-outs. The interplay of regulation, connectivity gaps, and dealership consolidation signals a pivot toward integrated technology packages that promise quantifiable savings across multiple crop cycles.
United States Tractor Market Trends and Insights
Continuous Electrification of Sub-100 HP Models
Battery-powered tractors below 40 HP now offer meaningful payback because operating cost reductions offset up-front premiums within three to six seasons. John Deere's E-Power prototypes and Solectrac's compact lineup underline how early volume is clustering in vineyards, dairies, and greenhouse operations where low noise and zero tailpipe emissions carry premium value. Battery density still limits larger units, concentrating R&D on the compact range, yet component prices have fallen 14% since 2023, narrowing diesel price advantages. Dealer education and charging-infrastructure incentives remain gating factors, but Farm Bill climate allocations are catalyzing pilot deployments. With Deere's commercial rollout slated for 2026, rivals face a shrinking window to lock in early adopters.
Smart-Implement Compatibility Boosts Replacement Demand
Implement purposely limit on backward compatibility, pressing farmers to trade in 6-8-year-old tractors rather than the historic 11-year cycle. The surge is most visible in the 40-100 HP class, where row-crop operations depend on sectional control. Consequently, the Original Equipment Manufacturers (OEMs) bundle guidance-ready wiring harnesses as standard to capture replacement share. This tailwind should peak by 2027 once the installed base reaches critical mass.
High Upfront and Maintenance Costs of Tier-4 Final Engines
Tier-4 final compliance lifts sticker prices by more than 15% and introduces exhaust fluid expenses that erode margins for family farms. While emissions of particulate matter plunge 95%, the payback period lengthens, motivating many growers to buy used pre-Tier-4 units or delay replacements. The strain is likely to moderate after 2026 once component suppliers scale production and secondary-market prices normalize.
Other drivers and restraints analyzed in the detailed report include:
- Advanced Telematics Lower Total Cost of Ownership
- Precision-Ag Incentives in the 2023 U.S. Farm Bill
- Fragmented Dealership Coverage in Mountain States
For complete list of drivers and restraints, kindly check the Table Of Contents.
Segment Analysis
The below 40 HP electric tractor is forecast to advance at 10.8% CAGR, outpacing the broader United States tractor market by nearly twofold, due to falling battery costs and municipal incentives. This segment benefits from greenhouse, dairy, and urban farming operations that prize zero-emission, low-noise performance. The 40-100 HP range retains 51% United States tractor market share in 2024 because of its versatility across row-crop and livestock tasks, anchoring long-term volume. Above 100 HP units serve large farms where diesel energy density still delivers the lowest dollar-per-acre cost.
Electric newcomers target cost-of-ownership metrics rather than environmental altruism, citing 60% fuel savings and 40% lower maintenance. Deere & Company's 130 HP E-Power prototype underscores the manufacturer's shift toward scalable electrification, though battery mass keeps large-frame adoption in pilot mode. Solectrac's revenue rose from USD 1.8 million in 2021 to USD 11 million in 2022, yet net losses show infrastructure hurdles remain. As lithium iron phosphate chemistry gains traction, pack costs could fall 20% by 2027, narrowing diesel's upfront advantage.
The utility tractors captured 41% of 2024 shipments, reflecting broad task compatibility across cattle, hay, and property maintenance. Still, orchard and vineyard tractors are set for an 11.4% CAGR through 2030, eclipsing the United States tractor market average. Their premium pricing stems from narrow chassis, autonomy-ready controls, and zero-emission powertrains that thrive in confined rows. Row-crop tractors hold stable demand linked to corn and soybean acreage, but margin pressure is steeper as OEMs balance high-horsepower features against price-sensitive growers.
Case IH's FieldOps platform and its Connectivity Included offer removes data-service fees for new orchard tractors, trimming lifetime costs and spurring adoption. Premium fruit growers in California pay up because the margin per acre dwarfs commodity crops. Over time, technologies proven in specialty units-such as LIDAR-guided sprayers-should cascade into mainstream utility models once volumes cut component pricing, widening their appeal.
The United States Tractor Market Report is Segmented by Horsepower (Below 40 HP, 40-100 HP, and More), by Type (Utility Tractors, Row Crop Tractors, Orchard and Vineyard Tractors, and More), by Drive Type (Two-Wheel Drive (2WD), Four-Wheel Drive (4WD), and More), and by Application (Cereals and Oilseeds, Fruits and Vegetables, and More). The Market Forecasts are Provided in Terms of Value (USD).
List of Companies Covered in this Report:
- Deere and Company
- CNH Industrial N.V.
- AGCO Corporation
- Kubota Corporation
- Mahindra&Mahindra Ltd.
- CLAAS KGaA mbH
- SDF S.p.A. (Deutz-Fahr)
- LS Mtron Ltd.
- Daedong-USA, Inc.
- Yanmar Holdings Co., Ltd.
- TYM Corporation
- Asko Holding
- JC Bamford Excavators Ltd.
- Doosan Bobcat
- Monarch Tractor
Additional Benefits:
- The market estimate (ME) sheet in Excel format
- 3 months of analyst support
TABLE OF CONTENTS
1 Introduction
- 1.1 Study Assumptions and Market Definition
- 1.2 Scope of the Study
2 Research Methodology
3 Executive Summary
4 Market Landscape
- 4.1 Market Overview
- 4.2 Market Drivers
- 4.2.1 Continuous electrification of sub-100 HP models
- 4.2.2 Smart-implement compatibility boosts replacement demand
- 4.2.3 Advanced telematics lower total cost of ownership
- 4.2.4 Precision-Ag incentives in the 2023 U.S. Farm Bill
- 4.2.5 Autonomous retrofit kits reach commercial price points
- 4.2.6 Carbon-credit monetization for low-HP tractors
- 4.3 Market Restraints
- 4.3.1 High upfront and maintenance costs of Tier-4 final engines
- 4.3.2 Fragmented dealership coverage in mountain states
- 4.3.3 Shortage of skilled technicians for sensor-laden models
- 4.3.4 Slow rural 5G rollout limits real-time data services
- 4.4 Regulatory Landscape
- 4.5 Technological Outlook
- 4.6 Porter's Five Forces Analysis
- 4.6.1 Threat of New Entrants
- 4.6.2 Bargaining Power of Buyers
- 4.6.3 Bargaining Power of Suppliers
- 4.6.4 Threat of Substitute Products
- 4.6.5 Intensity of Competitive Rivalry
5 Market Size and Growth Forecasts (Value)
- 5.1 By Horsepower
- 5.1.1 Below 40 HP
- 5.1.2 40-100 HP
- 5.1.3 Above 100 HP
- 5.2 By Tractor Type
- 5.2.1 Utility Tractors
- 5.2.2 Row-Crop Tractors
- 5.2.3 Orchard and Vineyard Tractors
- 5.2.4 Other Tractor Types
- 5.3 By Drive Type
- 5.3.1 Two-Wheel Drive (2WD)
- 5.3.2 Four-Wheel Drive (4WD)
- 5.3.3 Autonomous / Driverless
- 5.4 By Application
- 5.4.1 Cereals and Oilseeds
- 5.4.2 Fruits and Vegetables
- 5.4.3 Livestock Operations
- 5.4.4 Others
6 Competitive Landscape
- 6.1 Market Concentration
- 6.2 Strategic Moves
- 6.3 Market Share Analysis
- 6.4 Company Profiles (Includes Global Level Overview, Market Level Overview, Core Segments, Financials As Available, Strategic Information, Market Rank/Share for Key Companies, Products and Services, and Recent Developments)
- 6.4.1 Deere and Company
- 6.4.2 CNH Industrial N.V.
- 6.4.3 AGCO Corporation
- 6.4.4 Kubota Corporation
- 6.4.5 Mahindra&Mahindra Ltd.
- 6.4.6 CLAAS KGaA mbH
- 6.4.7 SDF S.p.A. (Deutz-Fahr)
- 6.4.8 LS Mtron Ltd.
- 6.4.9 Daedong-USA, Inc.
- 6.4.10 Yanmar Holdings Co., Ltd.
- 6.4.11 TYM Corporation
- 6.4.12 Asko Holding
- 6.4.13 JC Bamford Excavators Ltd.
- 6.4.14 Doosan Bobcat
- 6.4.15 Monarch Tractor
7 Market Opportunities and Future Outlook
 曳引機農具市場(按農具類型、應用、銷售管道和最終用戶分類)—2025-2032 年全球預測
 2025 年全球四輪驅動曳引機市場報告
 輸電絕緣子市場,按材料類型、按絕緣子類型、按電壓、按應用、按最終用戶、按國家/地區 - 2025 年至 2032 年全球行業分析、市場規模、市場佔有率和預測
 全球氫動力曳引機市場
 2032 年電動曳引機市場預測:按傳動系統、電池、動力、應用和地區分類的全球分析2032 年二手曳引機市場預測:按類型、驅動類型、馬力、引擎、銷售管道、應用和地區進行的全球分析
 曳引機的印度市場評估:馬力,驅動類別,各產業,各地區,機會,預測(2019年度~2033年度)全球電動曳引機市場
 高馬力曳引機市場-全球產業規模、佔有率、趨勢、機會和預測,按類型、應用、地區和競爭細分,2020-2030 年
 全球曳引機農用設備市場規模(按階段、功率、驅動裝置、區域範圍和預測)