


 |
市場調查報告書
商品編碼
1844594
印度可再生能源:市場佔有率分析、行業趨勢、統計數據和成長預測(2025-2030 年)India Renewable Energy - Market Share Analysis, Industry Trends & Statistics, Growth Forecasts (2025 - 2030) |
||||||
※ 本網頁內容可能與最新版本有所差異。詳細情況請與我們聯繫。
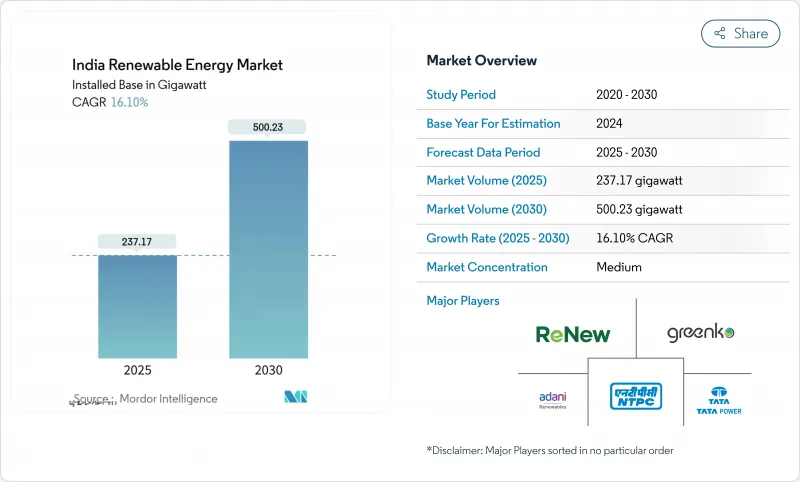
印度可再生能源市場規模預計將從 2025 年的 237.17 吉瓦成長到 2030 年的 500.23 吉瓦,預測期內(2025-2030 年)的複合年成長率為 16.10%。
技術成本下降、積極的競標以及PM-KUSUM和生產連結獎勵計畫(PLI)計劃等政策槓桿正在形成一個規模化和成本降低的自我強化循環。太陽能日益佔據主導地位、商業和工業(C&I)採購激增以及混合儲能項目競標管道不斷增加,正在重新定義競爭動態,並鼓勵創紀錄的資本流入。同時,電網瓶頸、配電公司(DISCOM)付款延遲以及關鍵礦產資源暴露等問題如果不解決,可能會抑制發展動能。儘管如此,印度可再生能源市場仍展現出強勁的投資者信心,最近一次高峰會上宣布的860億美元新承諾就證明了這一點。
印度可再生能源市場趨勢與洞察
降低太陽能和風能的平準化電力成本
在公共電力協會 (PLI) 支持的組件生產和技術改進的支持下,太陽能電價將達到創紀錄的 2.51 印度盧比/千瓦時,進口依賴度將從 2020 年的 90% 降至 2025 年的 60% 以下。風電的成本軌跡將與之類似,儘管增速較慢,但 2 兆瓦以下風力渦輪機的改造潛力為 25.4 吉瓦,可進一步最佳化成本。太陽能、風能和煤炭成本曲線的趨同已達到臨界點,可再生能源發電現已成為新增發電容量的預設選項。
中央和各州積極進行可再生能源競標
印度太陽能公司(SECI)及其政府機構已為2024年上半年競標7.6兆瓦的項目,較去年同期成長191%。預計到2026年將開發132.7兆瓦的計劃,開發商可以放心地擴大產能和計劃儲備。
配電公司的財務壓力和付款延遲
由於多個州的配電損失超過 20%,損害了配電公司的流動性並延遲了付款,因此,在定價和補貼合理化方面進行結構性改革仍然至關重要。
細分分析
2024 年,太陽能發電量將達到 114 吉瓦,佔印度可再生能源市場的 48%。到 2030 年,印度可再生能源市場規模預計以 17% 的複合年成長率成長,僅太陽能將達到 254 吉瓦。風力發電穩定在 47.36 兆瓦,但該國面臨對老化計劃進行改造的需求。水力發電為 51.99 兆瓦,生質能發電 11.32 兆瓦,支撐基本負載。自 2026 年 4 月起生效的強制性國內電池生產要求將需要將目前 7.6 兆瓦的電池容量擴大數倍。古吉拉突邦生產了 45% 的組件和 52% 的電池生產線,從而培育了供應鏈叢集,降低了物流成本和出口時間。
到2023會計年度,出口將激增至3吉瓦,主要來自美國,顯示國際競爭力不斷增強。風電開發商正在尋求更大的渦輪機,以取代25吉瓦的2兆瓦以下機組,而混合太陽能和風能儲能發電廠正在贏得需要24小時運作配置的競標。地熱和潮汐技術仍處於起步階段,但受惠於研發津貼。
印度可再生能源市場報告按能源來源(太陽能、風能、水力發電、生質能源、其他可再生)和終端用途領域(公共產業、商業和工業、住宅、研發和分析)進行細分。市場規模和預測以裝置容量(吉瓦)為單位。
其他福利:
- Excel 格式的市場預測 (ME) 表
- 3個月的分析師支持
目錄
第1章 引言
- 研究假設和市場定義
- 調查範圍
第2章調查方法
第3章執行摘要
第4章 市場狀況
- 市場概況
- 市場促進因素
- 降低太陽能和風能的平準化電力成本
- 積極的中央和州級可再生能源競標(SECI、GUVNL 等)
- 可再生能源購買義務和ESCerts實施
- 工商業承購商的綠色電力購電協議激增
- 透過生產連結獎勵(PLI)振興國內製造業
- 混合+儲能競標結構降低抑制風險
- 市場限制
- 配電公司的財務壓力和付款延遲
- 土地徵用和場地保障方面的瓶頸
- 對關鍵礦物(矽、釹鐵硼、鋰)供應鏈的影響
- 白天停電和電網堵塞熱點增多
- 供應鏈分析
- 監管狀況
- 技術展望
- 波特五力分析
- 供應商的議價能力
- 買方的議價能力
- 新進入者的威脅
- 替代品的威脅
- 競爭對手之間的競爭強度
- PESTLE分析
第5章市場規模及成長預測
- 按來源
- 太陽能電池
- 風力
- 水力發電(大型/小型)
- 生質能源(生質能、甘蔗渣、垃圾焚化發電)
- 其他可再生能源(混合能源、地熱能源、潮汐能源)
- 按最終用戶部門
- 公共產業
- 商業和工業
- 住宅
- 用於農業(PM-KUSUM,太陽能幫浦)
第6章 競爭態勢
- 市場集中度
- 策略性舉措(併購、夥伴關係、購電協議)
- 市場佔有率分析(主要企業的市場排名/佔有率)
- 公司簡介
- Adani Green Energy Ltd
- NTPC Ltd(RE Arm)
- ReNew Energy Global Plc
- Tata Power Renewables
- ACME Solar Holdings
- Azure Power Global Ltd
- Greenko Group
- JSW Energy(Neo)
- Suzlon Energy Ltd
- SJVN Green Energy Ltd
- Hero Future Energies
- Waaree Energies Ltd
- Vikram Solar Ltd
- Sterling & Wilson Renewable Energy
- Jakson Group(Solar)
- First Solar Inc
- Trina Solar Co Ltd
- JinkoSolar Holding Co Ltd
- Siemens Gamesa Renewable Energy SA
- Vestas Wind Systems AS
第7章 市場機會與未來展望
The India Renewable Energy Market size in terms of installed base is expected to grow from 237.17 gigawatt in 2025 to 500.23 gigawatt by 2030, at a CAGR of 16.10% during the forecast period (2025-2030).
Declining technology costs, aggressive auctions, and policy tools such as PM-KUSUM and the Production-Linked Incentive (PLI) scheme have created a self-reinforcing cycle of scale and cost reduction. Solar's expanding dominance, commercial and industrial (C&I) procurement surge, and a widening pipeline of hybrid-plus-storage tenders are redefining competitive dynamics and spurring record capital inflows. At the same time, grid bottlenecks, DISCOM payment delays, and critical-mineral exposure threaten to temper momentum if left unresolved. Nevertheless, the India renewable energy market continues to demonstrate strong investor confidence, underscored by USD 86 billion in fresh commitments announced at recent summits .
India Renewable Energy Market Trends and Insights
Falling LCOE of Solar PV & Wind
Record solar tariffs of INR 2.51/kWh have been achieved on the back of PLI-supported module production and technology gains, reducing import dependence from 90% in 2020 to below 60% in 2025. Wind's cost trajectory is similar, though slower, yet 25.4 GW of repowering potential for sub-2 MW turbines offers further cost optimization. The merging of solar, wind, and coal cost curves has reached a tipping point where renewable additions are now the default choice for new capacity.
Aggressive Central & State-Level RE Auctions
Solar Energy Corporation of India (SECI) and state agencies issued 7.6 GW of tenders in H1 2024, 191% higher year-on-year, while evolving bid structures now require storage and domestic content to enhance grid integration . Visibility of 132.7 GW of projects through 2026 gives developers confidence to expand manufacturing and project pipelines.
DISCOM Financial Stress & Payment Delays
Distribution losses above 20% in several states continue to erode DISCOM liquidity, delaying payments and discouraging new projects despite payment-security mechanisms . Structural reforms in tariff setting and subsidy rationalization remain essential.
Other drivers and restraints analyzed in the detailed report include:
- Renewable Purchase Obligations & ESCerts Enforcement
- Surge in Green-Power PPAs from C&I Off-takers
- Land-Acquisition & Right-of-Way Bottlenecks
For complete list of drivers and restraints, kindly check the Table Of Contents.
Segment Analysis
Solar capacity stood at 114 GW in 2024, representing 48% of the India renewable energy market. Solar's 17% CAGR to 2030 is expected to raise the India renewable energy market size for solar alone to 254 GW. Domestic module output climbed from 10 GW in 2021 to 77.2 GW in 2024 after the PLI outlay, while wind remains steady at 47.36 GW, yet faces a repowering requirement for aging projects. Hydro contributes 51.99 GW and biomass 11.32 GW, supplying baseload support. A mandatory domestic-cell rule from April 2026 will necessitate a many-fold expansion of the current 7.6 GW cell capacity. Gujarat hosts 45% of modules and 52% of cell lines, fostering a supply-chain cluster that cuts logistics costs and export times.
Solar's export surge to 3 GW in FY 2023, mainly to the United States, underlines rising global competitiveness. Wind developers pursue larger turbines to replace 25 GW of sub-2 MW units, while hybrid solar-wind-storage plants win tenders that demand round-the-clock profiles. Geothermal and tidal technologies remain nascent but benefit from supportive R&D grants.
The India Renewable Energy Market Report is Segmented by Source (Solar, Wind, Hydro, Bioenergy, and Other Renewables), End-Use Sector (Utilities, Commercial and Industrial, Residential, R and Agricultural). The Market Size and Forecasts are Provided in Terms of Installed Capacity (GW).
List of Companies Covered in this Report:
- Adani Green Energy Ltd
- NTPC Ltd (RE Arm)
- ReNew Energy Global Plc
- Tata Power Renewables
- ACME Solar Holdings
- Azure Power Global Ltd
- Greenko Group
- JSW Energy (Neo)
- Suzlon Energy Ltd
- SJVN Green Energy Ltd
- Hero Future Energies
- Waaree Energies Ltd
- Vikram Solar Ltd
- Sterling & Wilson Renewable Energy
- Jakson Group (Solar)
- First Solar Inc
- Trina Solar Co Ltd
- JinkoSolar Holding Co Ltd
- Siemens Gamesa Renewable Energy SA
- Vestas Wind Systems AS
Additional Benefits:
- The market estimate (ME) sheet in Excel format
- 3 months of analyst support
TABLE OF CONTENTS
1 Introduction
- 1.1 Study Assumptions & Market Definition
- 1.2 Scope of the Study
2 Research Methodology
3 Executive Summary
4 Market Landscape
- 4.1 Market Overview
- 4.2 Market Drivers
- 4.2.1 Falling LCOE of Solar PV & Wind
- 4.2.2 Aggressive Central & State-Level RE Auctions (SECI, GUVNL, etc.)
- 4.2.3 Renewable Purchase Obligations & ESCerts Enforcement
- 4.2.4 Surge in Green-Power PPAs from C&I Off-takers
- 4.2.5 Production-Linked Incentive (PLI) Boosting Domestic Manufacturing
- 4.2.6 Hybrid + Storage Tender Structure Reducing Curtailment Risk
- 4.3 Market Restraints
- 4.3.1 DISCOM Financial Stress & Payment Delays
- 4.3.2 Land-Acquisition & Right-of-Way Bottlenecks
- 4.3.3 Critical-Mineral Supply-Chain Exposure (Si, NdFeB, Li)
- 4.3.4 Rising Day-time Curtailment & Grid Congestion Hot-spots
- 4.4 Supply-Chain Analysis
- 4.5 Regulatory Landscape
- 4.6 Technological Outlook
- 4.7 Porter's Five Forces Analysis
- 4.7.1 Bargaining Power of Suppliers
- 4.7.2 Bargaining Power of Buyers
- 4.7.3 Threat of New Entrants
- 4.7.4 Threat of Substitutes
- 4.7.5 Intensity of Competitive Rivalry
- 4.8 PESTLE Analysis
5 Market Size & Growth Forecasts
- 5.1 By Source
- 5.1.1 Solar
- 5.1.2 Wind
- 5.1.3 Hydro (Large and Small)
- 5.1.4 Bioenergy (Biomass, Bagasse, Waste-to-Energy)
- 5.1.5 Other Renewables (Hybrid, Geothermal, Tidal)
- 5.2 By End-Use Sector
- 5.2.1 Utility
- 5.2.2 Commercial and Industrial
- 5.2.3 Residential
- 5.2.4 Agricultural (PM-KUSUM, Solar Pumps)
6 Competitive Landscape
- 6.1 Market Concentration
- 6.2 Strategic Moves (M&A, Partnerships, PPAs)
- 6.3 Market Share Analysis (Market Rank/Share for key companies)
- 6.4 Company Profiles (includes Global level Overview, Market level overview, Core Segments, Financials as available, Strategic Information, Products & Services, and Recent Developments)
- 6.4.1 Adani Green Energy Ltd
- 6.4.2 NTPC Ltd (RE Arm)
- 6.4.3 ReNew Energy Global Plc
- 6.4.4 Tata Power Renewables
- 6.4.5 ACME Solar Holdings
- 6.4.6 Azure Power Global Ltd
- 6.4.7 Greenko Group
- 6.4.8 JSW Energy (Neo)
- 6.4.9 Suzlon Energy Ltd
- 6.4.10 SJVN Green Energy Ltd
- 6.4.11 Hero Future Energies
- 6.4.12 Waaree Energies Ltd
- 6.4.13 Vikram Solar Ltd
- 6.4.14 Sterling & Wilson Renewable Energy
- 6.4.15 Jakson Group (Solar)
- 6.4.16 First Solar Inc
- 6.4.17 Trina Solar Co Ltd
- 6.4.18 JinkoSolar Holding Co Ltd
- 6.4.19 Siemens Gamesa Renewable Energy SA
- 6.4.20 Vestas Wind Systems AS
7 Market Opportunities & Future Outlook
- 7.1 White-space & Unmet-Need Assessment
 農業可再生能源:生質燃料、太陽能發電廠和永續農業實踐的全球市場—按應用、產品和地區分類的分析和預測(2025-2035 年)
 2026年全球可再生能源市場報告2026年全球多元能源系統市場報告2026年全球太陽能燃料市場報告
 可再生能源市場:全球產業分析、市場規模、市場佔有率及預測(依投資類型、可再生能源類型、企業類型、應用、國家及地區分類)-2026-2033年
 風電場變電站市場按組件類型、配置類型、連接類型、電壓等級、最終用戶和安裝類型分類,全球預測(2026-2032年)全球節能設備市場:機會與策略展望(至2034年)
 節能微控制器市場分析及預測(至2035年):依類型、產品類型、服務、技術、組件、應用、最終用戶、功能、安裝類型、解決方案分類
 中國可再生能源:市場佔有率分析、產業趨勢與統計、成長預測(2026-2031年)新加坡可再生能源:市場佔有率分析、產業趨勢與統計、成長預測(2026-2031)