


 |
市場調查報告書
商品編碼
1844575
單軸太陽能追蹤器:市場佔有率分析、行業趨勢、統計數據和成長預測(2025-2030 年)Single Axis Solar Tracker - Market Share Analysis, Industry Trends & Statistics, Growth Forecasts (2025 - 2030) |
||||||
※ 本網頁內容可能與最新版本有所差異。詳細情況請與我們聯繫。
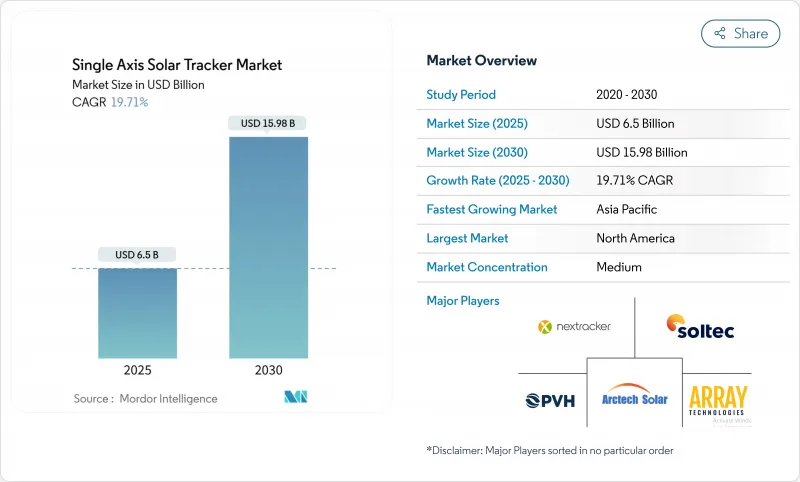
單軸太陽能追蹤器市場規模預計在 2025 年為 65 億美元,預計到 2030 年將達到 159.8 億美元,預測期內(2025-2030 年)的複合年成長率為 19.71%。
公用事業規模太陽能的優點包括比固定傾斜陣列高15-25%的發電量,以及高照度地區更低的平準化電力成本,這些優勢正在推動太陽能的擴張。垂直整合緩解了鋼鐵成本的波動,而美國《通膨降低法案》中10%的國內生產力獎勵等政策,正推動追蹤器製造向本地供應鏈轉移。產品差異化正從純粹的成本競爭轉向增值功能,例如抗冰雹儲存模式和人工智慧支援的預測性維護。這種轉變強化了開發商在成熟市場和新興市場新建太陽能裝置時對追蹤系統的強烈偏好。
全球單軸太陽能追蹤器市場趨勢與洞察
積極的公用事業規模採購要求推動了對追蹤器的偏好
美國舉行了公共規模的競標,力爭在2024年新增49吉瓦的太陽能裝置容量,大多數計劃都要求採用單軸追蹤系統以確保更高的發電量。西班牙擁有歐洲60%以上的追蹤器,該國也在其全國競標中指定了追蹤器,以穩定尖峰時段輸出。此類強制要求提高了基準性能標準,實際上放棄了高價值公用事業計劃採用固定傾斜式追蹤器的替代方案。隨著強製配置佔領市場,開發商可以要求溢價。隨著電網穩定性要求的提高,預計這種模式將在新的成長地區複製。
雙軌協同,革新沙漠經濟
在智利和澳大利亞,水平追蹤器和二面體組件的組合已實現高達每千瓦時每年2,555千瓦時的發電量,而平準化成本低於2.45美分/千瓦時。追蹤器最大限度地捕獲了直接和反射的太陽輻射,而高反照率的沙漠土壤進一步增強了背面效益。這些綜合效益使曾經被認為是邊緣地區的位置即使在長距離輸電的情況下也能獲得發展。計劃開發商可以獲得較高的內部收益率,從而進一步鼓勵在乾旱地區進行大規模投資。
空氣量認證延遲造成亞太地區瓶頸
颱風頻繁的市場要求對大型組件進行氣動風洞測試,這導致日本和菲律賓的追蹤器認證週期延長6至12個月。由於認證週期延長,開發商積壓庫存,面臨更高的資本成本。有些開發商為了滿足專案進度,不得不放棄發電產量優勢,轉而採用固定傾角陣列。擁有認證設計的成熟追蹤器品牌價格昂貴,這增加了新進入者的市場門檻。
細分分析
到2024年,水平安裝將佔據單軸太陽能追蹤器市場的70%。由於成熟的供應鏈和簡單的安裝程序,水平安裝將成為100MW以上計劃的預設選擇。由於高照度場地的能源收益證明了資本投資的合理性,該細分市場將佔據單軸太陽能追蹤器市場的大部分佔有率。由於土地受限的歐洲農場和農業太陽能裝置需要緊密的行距,垂直安裝追蹤器的複合年成長率將達到20.2%。在此類用例中,垂直安裝的雙面組件可提供相當的功率輸出,同時保留作物可用的土地。
朝向選擇正變得因地制宜,而非千篇一律。據歐洲農業太陽能開發商稱,垂直系統的平準化成本比高大雙排設計低20-25%,而傾斜和連動雙軸解決方案則適用於複雜地形和積雪地區。該領域技術的多樣性拓寬了單軸太陽能追蹤器的潛在市場,並緩解了供應商對單軸太陽能追蹤器產業區域需求波動的影響。
到2024年,主動驅動將佔據單軸太陽能追蹤器市場規模的85%,提供精確的太陽追蹤、回溯和風暴抑制功能。開發商重視這些功能,認為它們能夠提高計劃的融資能力,尤其是在保險公司要求預先設定冰雹緩解方案的情況下。然而,被動式熱感和重力系統透過消除馬達和控制電子設備,正以超過20%的複合年成長率擴張。現場數據顯示,與固定傾斜基準相比,其效率提高了62.3%,同時減輕了偏遠地區的維護負擔。
當現場維護人員有限時,被動驅動器的成本控制優勢極具吸引力。然而,由於無法執行複雜的存儲配置,被動驅動器在高冰雹風險市場的應用受到限制,從而維護了有源驅動器供應商的收益壁壘。這種互動確保了單軸太陽能追蹤器市場的強勁競爭和持續的技術創新。
單軸太陽能追蹤器市場報告按方向(水平單軸追蹤器、垂直單軸追蹤器、其他)、驅動類型(主動、被動)、技術(光伏、聚光型太陽光電、聚光型太陽光電)、應用(公用事業規模、商業和工業、住宅)和地區(北美、歐洲、亞太、南美、中東和非洲)細分。
區域分析
北美在單軸太陽能追蹤器市場佔據主導地位。美國計劃通常會指定追蹤系統以確保電網穩定,並由德克薩斯、俄亥俄州和亞利桑那州的國內工廠提供支援。加拿大和墨西哥透過共用跨境製造和電網互連增加了互補需求。開發商利用現有的購電協議結構,確保可預測的收入流量,並降低投資先進追蹤器功能的風險。
亞太地區是成長最快的地區。印度正準備迎接10億千瓦的新增太陽能裝置容量,其追蹤器應用正在加速發展。中國製造業巨頭也在擴大出口以滿足當地需求。東南亞擁有220吉瓦的大型太陽能發電工程認證,樹立全球工程標桿,並為全球追蹤器的可靠性做出貢獻。
歐洲和中東地區共用強勁而多元的成長前景。歐洲農業太陽能開發商採用垂直追蹤器佈局保護農田,將平準化成本降低了高達25%。西班牙在採購規則方面領先歐洲大陸,這些規則將追蹤器標準化。在中東和北非,豐富的太陽能資源和積極的脫碳目標正在推動發電擴張。沙烏地阿拉伯的單軸追蹤器裝置容量在過去一年中增加了四倍多,這得益於與高容量係數相符的大規模競標。
其他福利:
- Excel 格式的市場預測 (ME) 表
- 3個月的分析師支持
目錄
第1章 引言
- 研究假設和市場定義
- 調查範圍
第2章調查方法
第3章執行摘要
第4章 市場狀況
- 市場概況
- 市場促進因素
- 美國和西班牙積極的電力採購要求傾向於單軸追蹤
- 在智利和澳洲的沙漠地區,二面體模組與水平追蹤器組合的 LCOE 迅速下降
- 通膨降低法案 10% 本地化獎金刺激北美工業計劃
- 巴西東北部企業購電協議(PPA)蓬勃發展,需要低成本追蹤來確保容量
- 人工智慧預測性運維減少中東沙塵帶的追蹤器停機時間
- 土地受限的歐盟高緯度市場採用垂直單軸
- 市場限制
- 颱風頻繁的亞太地區風荷載認證延遲導致資本支出增加
- 鋼鐵價格波動導致卡車司機結構成本增加(歐盟和印度)
- 卡車司機「儲存模式」故障導致銀行可融資性標準收緊
- 在乾旱地區,土壤流失的運作和維護負擔比固定傾斜更高
- 供應鏈分析
- 監理展望
- 技術展望
- 五力分析
- 供應商的議價能力
- 消費者議價能力
- 新進入者的威脅
- 替代品的威脅
- 競爭對手之間的競爭強度
第5章市場規模及成長預測
- 按方向
- 水平單軸追蹤器(HSAT)
- 垂直單軸追蹤器(VSAT)
- 傾斜單軸追蹤器 (TSAT)
- 按驅動類型
- 主動(電動/液壓)
- 被動(熱/重力)
- 依技術
- 光伏(PV)
- 聚光型太陽光電(CSP)
- 聚光型太陽光電(CPV)
- 按用途
- 公用事業規模
- 商業和工業
- 住宅
- 按地區
- 北美洲
- 美國
- 加拿大
- 墨西哥
- 歐洲
- 德國
- 英國
- 義大利
- 西班牙
- 法國
- 其他歐洲國家
- 亞太地區
- 中國
- 印度
- 日本
- 韓國
- 東南亞國協
- 其他亞太地區
- 南美洲
- 巴西
- 阿根廷
- 智利
- 南美洲其他地區
- 中東和非洲
- 沙烏地阿拉伯
- 阿拉伯聯合大公國
- 南非
- 其他中東和非洲地區
- 北美洲
第6章 競爭態勢
- 市場集中度
- 策略性舉措(併購、夥伴關係、購電協議)
- 市場佔有率分析(主要企業的市場排名/佔有率)
- 公司簡介
- NEXTracker Inc.
- Array Technologies Inc.
- PV Hardware Solutions SLU(PVH)
- Arctech Solar Holding Co. Ltd.
- Soltec Power Holdings SA
- Valmont Industries Inc.(Valmont Solar)
- Nclave Renewable SL
- STi Norland SL
- GameChange Solar
- FTC Solar Inc.
- Solar FlexRack(Northern States Metals)
- Ideematec Deutschland GmbH
- Convert Italia SpA
- TrinaTracker(Trina Solar Co. Ltd.)
- SunPower Corporation
- AllEarth Renewables Inc.
- Sun Action Trackers
- Alion Energy Inc.
- Clenergy Co. Ltd.
- Exosun SAS
第7章 市場機會與未來展望
The Single Axis Solar Tracker Market size is estimated at USD 6.5 billion in 2025, and is expected to reach USD 15.98 billion by 2030, at a CAGR of 19.71% during the forecast period (2025-2030).
Utility-scale solar's dominance, the technology's 15-25% energy-yield premium over fixed-tilt arrays, and falling levelized cost of electricity in high-irradiance regions underpin this expansion. Vertical integration is mitigating steel cost volatility, while policies such as the United States Inflation Reduction Act's 10% domestic-content bonus are steering tracker manufacturing toward local supply chains. Product differentiation is shifting from pure cost competition to value-added features like hail-resistant stow modes and AI-enabled predictive maintenance. These shifts collectively reinforce strong developer preference for tracking systems in new solar capacity additions across mature and emerging markets.
Global Single Axis Solar Tracker Market Trends and Insights
Aggressive utility-scale procurement mandates drive tracker preference
Utility-scale tenders in the United States added 49 GW of solar capacity in 2024, and most projects required single-axis tracking to guarantee higher capacity factors. Spain, which hosts over 60% of European tracker installations, similarly specifies trackers in nationwide auctions to stabilize peak-period output. These mandates raise the baseline performance bar, effectively sidelining fixed-tilt alternatives in high-value utility projects. Developers gain premium pricing as mandated configurations create a captive market. Replication of this model in new growth regions is expected as grids tighten stability requirements.
Bifacial-tracking synergy revolutionizes desert economics
Horizontal trackers paired with bifacial modules in Chile and Australia now produce up to 2,555 kWh per kWp each year, driving levelized costs below 2.45 cents per kWh. Trackers maximise both direct and reflected irradiance capture, while high-albedo desert soils further boost rear-side gains. These combined benefits unlock sites once considered marginal, even where transmission distances are long. Project developers secure higher internal rates of return, which encourages additional large-scale investments in arid zones.
Wind-load certification delays create APAC bottlenecks
Typhoon-prone markets require aeroelastic tunnel testing for large-format modules, extending tracker approvals by 6-12 months in Japan and the Philippines. Developers face higher capital costs as they hold inventory during protracted certification cycles. Some shift to fixed-tilt arrays to protect schedules, despite losing energy yield benefits. Established tracker brands with pre-certified designs command premium prices, reinforcing market entry barriers for new entrants.
Other drivers and restraints analyzed in the detailed report include:
- Inflation Reduction Act domestic-content bonus reshapes North American supply chains
- Corporate PPA boom demands tracking precision
- Steel-price volatility pressures tracker economics
For complete list of drivers and restraints, kindly check the Table Of Contents.
Segment Analysis
Horizontal configurations held a 70% slice of the single axis solar tracker market in 2024. They thrive on mature supply chains and straightforward installation procedures, making them the default choice for projects over 100 MW. This segment secures a large portion of the single axis solar tracker market size because energy gains justify their capital expenditure in high-irradiance sites. Vertical trackers grow at a 20.2% CAGR because land-constrained European farms and agrivoltaic setups need narrower row spacing. In these use cases, vertical-mounted bifacial modules provide comparable output while preserving ground use for crops.
Orientation selection is increasingly site-specific rather than one-size-fits-all. European agrivoltaic developers report 20-25% lower levelized costs with vertical systems than with elevated dual-row designs. Meanwhile inclined and articulated dual-axis solutions serve complex terrain or snow-prone regions. Technology diversity within this segment broadens the addressable single axis solar tracker market and cushions suppliers against regional demand swings across the single axis solar tracker industry.
Active drives captured 85% of the single axis solar tracker market size in 2024, providing precise sun-tracking, backtracking, and storm stow functions. Developers value these features for project bankability, especially where insurers require predefined hail mitigation routines. Yet passive thermal and gravity systems are scaling at more than 20% CAGR by eliminating motors and control electronics. Field data shows 62.3% efficiency gains over fixed-tilt baselines while lowering maintenance burdens in remote sites.
The cost-control advantage of passive drives is attractive where on-site maintenance crews are scarce. However, their inability to execute complex stow profiles limits adoption in hail-risk markets, preserving a revenue moat for active-drive suppliers. This interplay ensures robust competition and ongoing innovation across the single axis solar tracker market.
The Single Axis Solar Tracker Market Report is Segmented by Orientation (Horizontal Single-Axis Trackers, Vertical Single-Axis Trackers, and Others), Drive Type (Active and Passive), Technology (Photovoltaic, Concentrated Solar Power, and Concentrator Photovoltaic), Application (Utility-Scale, Commercial and Industrial, and Residential), and Geography (North America, Europe, Asia-Pacific, South America, and Middle East and Africa).
Geography Analysis
North America retains a commanding portion of the single axis solar tracker market. United States projects routinely specify tracking systems for grid stability, and supply is now anchored by domestic factories in Texas, Ohio, and Arizona. Canada and Mexico add complementary demand through cross-border manufacturing and shared grid interconnections. Developers leverage well-established power-purchase agreement structures, ensuring predictable revenue flows that help de-risk investment in advanced tracker features.
Asia-Pacific is the fastest-growing region. India accelerated tracker adoption on its path toward 100 GW of new solar capacity, and China's manufacturing leaders are both scaling exports and meeting local demand. Southeast Asia shows a 220 GW pipeline of prospective utility-scale solar projects yet only 3% is under construction, hinting at vast untapped tracker demand once policy clarity improves. Japan tightens wind-resilience certification, setting global engineering benchmarks that benefit tracker reliability worldwide.
Europe and the Middle East share strong but varied growth narratives. European agrivoltaic developers cut levelized costs by as much as 25% through vertical tracker layouts that preserve farmland. Spain leads the continent with procurement rules that make tracking standard practice. In the Middle East and North Africa, expansion is driven by high solar resource and aggressive decarbonization targets. Saudi Arabia's single-axis tracker capacity grew more than fourfold over the past year, backed by large-scale tenders that reward high capacity factors.
- NEXTracker Inc.
- Array Technologies Inc.
- PV Hardware Solutions S.L.U. (PVH)
- Arctech Solar Holding Co. Ltd.
- Soltec Power Holdings S.A.
- Valmont Industries Inc. (Valmont Solar)
- Nclave Renewable S.L.
- STi Norland S.L.
- GameChange Solar
- FTC Solar Inc.
- Solar FlexRack (Northern States Metals)
- Ideematec Deutschland GmbH
- Convert Italia S.p.A.
- TrinaTracker (Trina Solar Co. Ltd.)
- SunPower Corporation
- AllEarth Renewables Inc.
- Sun Action Trackers
- Alion Energy Inc.
- Clenergy Co. Ltd.
- Exosun SAS
Additional Benefits:
- The market estimate (ME) sheet in Excel format
- 3 months of analyst support
TABLE OF CONTENTS
1 Introduction
- 1.1 Study Assumptions & Market Definition
- 1.2 Scope of the Study
2 Research Methodology
3 Executive Summary
4 Market Landscape
- 4.1 Market Overview
- 4.2 Market Drivers
- 4.2.1 Aggressive utility-scale procurement mandates in the U.S. & Spain favouring single-axis trackers
- 4.2.2 Rapid LCOE reduction for bifacial modules paired with horizontal trackers in Chile & Australia deserts
- 4.2.3 Inflation Reduction Act 10 % domestic-content bonus spurring North-American industrial projects
- 4.2.4 Corporate PPA boom in Brazil's Northeast requiring low-cost tracking for capacity-factor guarantees
- 4.2.5 AI-enabled predictive O&M lowering downtime of trackers in Middle-East dust zones
- 4.2.6 Vertical single-axis adoption in land-constrained high-latitude EU markets
- 4.3 Market Restraints
- 4.3.1 Wind-load certification delays in typhoon-prone APAC raising CAPEX
- 4.3.2 Steel-price volatility inflating tracker structure costs (EU & India)
- 4.3.3 Tracker "stow-mode" failure incidents tightening bankability criteria
- 4.3.4 High soiling-loss O&M burden in arid regions compared with fixed-tilt
- 4.4 Supply-Chain Analysis
- 4.5 Regulatory Outlook
- 4.6 Technological Outlook
- 4.7 Porter's Five Forces
- 4.7.1 Bargaining Power of Suppliers
- 4.7.2 Bargaining Power of Consumers
- 4.7.3 Threat of New Entrants
- 4.7.4 Threat of Substitutes
- 4.7.5 Intensity of Competitive Rivalry
5 Market Size & Growth Forecasts
- 5.1 By Orientation
- 5.1.1 Horizontal Single-Axis Trackers (HSAT)
- 5.1.2 Vertical Single-Axis Trackers (VSAT)
- 5.1.3 Tilted/Inclined Single-Axis Trackers (TSAT)
- 5.2 By Drive Type
- 5.2.1 Active (Electric/Hydraulic)
- 5.2.2 Passive (Thermal/Gravity)
- 5.3 By Technology
- 5.3.1 Photovoltaic (PV)
- 5.3.2 Concentrated Solar Power (CSP)
- 5.3.3 Concentrator Photovoltaic (CPV)
- 5.4 By Application
- 5.4.1 Utility-Scale
- 5.4.2 Commercial and Industrial
- 5.4.3 Residential
- 5.5 By Geography
- 5.5.1 North America
- 5.5.1.1 United States
- 5.5.1.2 Canada
- 5.5.1.3 Mexico
- 5.5.2 Europe
- 5.5.2.1 Germany
- 5.5.2.2 United Kingdom
- 5.5.2.3 Italy
- 5.5.2.4 Spain
- 5.5.2.5 France
- 5.5.2.6 Rest of Europe
- 5.5.3 Asia-Pacific
- 5.5.3.1 China
- 5.5.3.2 India
- 5.5.3.3 Japan
- 5.5.3.4 South Korea
- 5.5.3.5 ASEAN Countries
- 5.5.3.6 Rest of Asia-Pacific
- 5.5.4 South America
- 5.5.4.1 Brazil
- 5.5.4.2 Argentina
- 5.5.4.3 Chile
- 5.5.4.4 Rest of South America
- 5.5.5 Middle East and Africa
- 5.5.5.1 Saudi Arabia
- 5.5.5.2 United Arab Emirates
- 5.5.5.3 South Africa
- 5.5.5.4 Rest of Middle East and Africa
- 5.5.1 North America
6 Competitive Landscape
- 6.1 Market Concentration
- 6.2 Strategic Moves (M&A, Partnerships, PPAs)
- 6.3 Market Share Analysis (Market Rank/Share for key companies)
- 6.4 Company Profiles (includes Global level Overview, Market level overview, Core Segments, Financials as available, Strategic Information, Products & Services, and Recent Developments)
- 6.4.1 NEXTracker Inc.
- 6.4.2 Array Technologies Inc.
- 6.4.3 PV Hardware Solutions S.L.U. (PVH)
- 6.4.4 Arctech Solar Holding Co. Ltd.
- 6.4.5 Soltec Power Holdings S.A.
- 6.4.6 Valmont Industries Inc. (Valmont Solar)
- 6.4.7 Nclave Renewable S.L.
- 6.4.8 STi Norland S.L.
- 6.4.9 GameChange Solar
- 6.4.10 FTC Solar Inc.
- 6.4.11 Solar FlexRack (Northern States Metals)
- 6.4.12 Ideematec Deutschland GmbH
- 6.4.13 Convert Italia S.p.A.
- 6.4.14 TrinaTracker (Trina Solar Co. Ltd.)
- 6.4.15 SunPower Corporation
- 6.4.16 AllEarth Renewables Inc.
- 6.4.17 Sun Action Trackers
- 6.4.18 Alion Energy Inc.
- 6.4.19 Clenergy Co. Ltd.
- 6.4.20 Exosun SAS
7 Market Opportunities & Future Outlook
- 7.1 White-Space & Unmet-Need Assessment
 2025年全球智慧太陽能追蹤簾子市場報告
 雙軸太陽能追蹤器市場按應用、驅動機制、控制機制、馬達類型和銷售管道分類—2025-2032年全球預測2025年全球太陽能追蹤器市場報告2025年發電用太陽能追蹤器全球市場報告2025年雙軸太陽能追蹤器全球市場報告
 2025 年至 2033 年太陽能追蹤器市場規模、佔有率、趨勢及預測(按類型、追蹤類型、技術、應用和地區)
 2025年全球光電追蹤器市場佔有率報告
 全球太陽能追蹤器市場(按軸類型、類型、應用程式和地區)預測至 2029 年
 太陽追蹤器市場分析及預測(至2034年):類型、產品、服務、技術、組件、應用、材料類型、部署、最終用戶、安裝類型
 太陽能追蹤器-市場佔有率分析、產業趨勢與統計、成長預測(2025-2030)