


 |
市場調查報告書
商品編碼
1693829
非洲工程塑膠:市場佔有率分析、行業趨勢和統計數據、成長預測(2024-2029)Africa Engineering Plastics - Market Share Analysis, Industry Trends & Statistics, Growth Forecasts (2024 - 2029) |
||||||
※ 本網頁內容可能與最新版本有所差異。詳細情況請與我們聯繫。
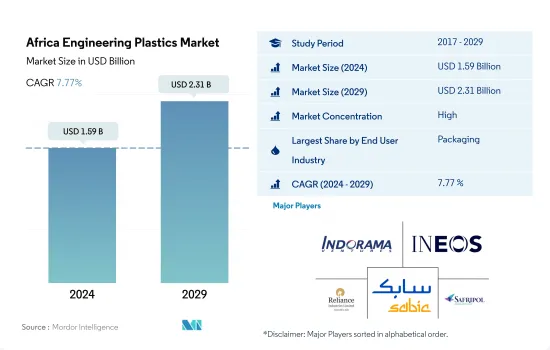
預計 2024 年非洲工程塑膠市場規模為 15.9 億美元,到 2029 年將達到 23.1 億美元,預測期內(2024-2029 年)的複合年成長率為 7.77%。
包裝產業將在未來幾年佔據市場主導地位
- 2022年,非洲在全球工程塑膠市場的佔有率以收入計算為1.32%。樹脂消費量增加的主要促進因素之一是其在包裝、電氣和電子行業的使用日益增加。 2022年工程塑膠市場總銷售額中,包裝產業約佔37.5%,電氣電子產業約佔12.18%。
- 2022年非洲塑膠包裝產量將達313萬噸,與前一年同期比較增加2.85%。該地區的塑膠包裝產業主要是為了回應農業和食品工業的成長而發展起來的。食品業對成品包裝的行銷方面越來越感興趣。預計在預測期內,對延長產品保存期限和提高便利生活方式的需求將推動市場發展,銷量複合年成長率為 4.95%。
- 電氣和電子產業是該地區第二大產業。由於非洲收益不斷增加,以及韓國領先的電氣和電子設備品牌投資建立製造設施,例如 LG 新投資在蘇丹建立洗衣機組裝廠,該地區電氣和電子設備組裝收入預計將在 2022 年達到 320 億美元。因此,該地區工程塑膠市場預計在 2023 年至 2029 年期間的收入複合年成長率將達到 7.41%。
- 預計汽車產業將成為市場上成長最快的產業,預測期內(2023-2029 年)的複合年成長率(以金額為準)為 8.93%。這是由於摩洛哥和南非汽車生產的擴張。
南非仍是該地區最大的市場
- 在奈及利亞、南非等非洲國家,工程塑膠被廣泛應用於汽車、航太、工業機械等各個產業。 2022年,南非和奈及利亞分別佔該地區雜項工程塑膠樹脂價值的30.15%和10.69%。
- 由於新興的航太、汽車和工業機械產業,南非是該地區最大的工程塑膠消費國。到 2022 年,該地區的飛機零件銷售額將佔約 68.7%,汽車產量將佔約 44.3%。這些行業正在推動對各種樹脂的需求不斷成長。由於氣候友善政策的不斷增加,汽車、工業和機械產量不斷成長,預計將推動南非對樹脂的需求。
- 在奈及利亞,由於汽車產量增加以及工業和機械工業的成長等因素,對各種樹脂的需求正在大幅增加。奈及利亞是非洲最大的汽車生產國。 2022年產量將達394,449輛,佔非洲汽車產量的33%。該國的汽車產量正在擴大,尤其是二輪車。預計到 2029 年汽車產量將達到 584,350 輛,複合年成長率為 6.77%。預計這些因素將推動該國對工程塑膠的需求。
- 預計南非將成為非洲工程塑膠消費成長最快的經濟體,受汽車產量成長以及航太和其他產業成長的推動,2023 年至 2029 年期間的複合年成長率為 6.45%(以收入計算)。例如,預計該國航太零件生產的以收益為準年成長率將達到 5.48%,從而推動南非工程塑膠市場的發展。
非洲工程塑膠市場趨勢
製造業正在崛起以滿足不斷成長的需求
- 南非是非洲領先的製造地。其製造能力、高效的物流網路和優惠的區域市場進入使南非成為尋求供應非洲的電子公司的理想之位置。南非電子產業多元化,涵蓋電子機械、家用電子電器產品、通訊設備、消費性電子產品等。 2022年,非洲地區進口滿足其本土電氣和電子設備需求的約70%。
- 家用電子電器產業仍高度依賴進口。據估計,2018年南非進口了非洲60%的消費性電子產品。 2020年,由於政府採取大規模封鎖措施以及封鎖導致的供應鏈中斷,該國電氣和電子設備產量銷售年增率下降與前一年同期比較3.2%。在功能手機領域,由於廠商持續從功能手機轉型為入門級智慧型手機,出貨量較去年與前一年同期比較下降 26.6% 至 2,190 萬台。所有這些因素導致該地區電氣和電子元件產量下降,2020-2022 年期間的複合年成長率為 -9.41%。
- 政府致力於促進和支持國內製造、研發以及製定電氣和電子製造的安全標準。預計預測期內(2023-2029 年),電氣和電子元件產量的複合年成長率將達到 6.28%,以滿足非洲新興中產階級的需求。
非洲工程塑膠行業概況
非洲工程塑膠市場相當集中,前五大公司佔據100%的市場。該市場的主要企業有 Indorama Ventures Public Company Limited、INEOS、Reliance Industries Limited、SABIC、KAP Diversified Industrial (Pty) Ltd 的 Safripol 部門等。
其他福利
- Excel 格式的市場預測 (ME) 表
- 3個月的分析師支持
目錄
第1章執行摘要和主要發現
第2章 報告要約
第3章 引言
- 研究假設和市場定義
- 研究範圍
- 調查方法
第4章 產業主要趨勢
- 最終用戶趨勢
- 航太
- 車
- 建築與施工
- 電氣和電子
- 包裝
- 進出口趨勢
- 氟樹脂交易
- 聚醯胺(PA)貿易
- 聚對苯二甲酸乙二酯(PET)貿易
- 聚甲基丙烯酸甲酯(PMMA)貿易
- 聚甲醛(POM)貿易
- 苯乙烯共聚物(ABS和SAN)貿易
- 價格趨勢
- 回收概述
- 聚醯胺(PA)回收趨勢
- 聚碳酸酯(PC)回收趨勢
- 聚對苯二甲酸乙二醇酯(PET)的回收趨勢
- 苯乙烯共聚物(ABS、SAN)的回收趨勢
- 法律規範
- 奈及利亞
- 南非
- 價值鍊和通路分析
第5章市場區隔
- 最終用戶產業
- 航太
- 車
- 建築與施工
- 電氣和電子
- 工業/機械
- 包裝
- 其他
- 樹脂類型
- 氟樹脂
- 依亞型
- 乙烯-四氟乙烯(ETFE)
- 氟化乙丙烯 (FEP)
- 聚四氟乙烯(PTFE)
- 聚氟乙烯(PVF)
- 聚二氟亞乙烯(PVDF)
- 其他子樹脂類型
- 液晶聚合物(LCP)
- 聚醯胺(PA)
- 依樹脂類型分
- 芳香聚醯胺
- 聚醯胺(PA)6
- 聚醯胺(PA)66
- 聚鄰苯二甲醯胺
- 聚丁烯對苯二甲酸酯(PBT)
- 聚碳酸酯(PC)
- 聚醚醚酮(PEEK)
- 聚對苯二甲酸乙二醇酯(PET)
- 聚醯亞胺(PI)
- 聚甲基丙烯酸甲酯(PMMA)
- 聚甲醛(POM)
- 苯乙烯共聚物(ABS和SAN)
- 氟樹脂
- 國家
- 奈及利亞
- 南非
- 其他非洲國家
第6章競爭格局
- 關鍵策略趨勢
- 市場佔有率分析
- 商業狀況
- 公司簡介
- Alfa SAB de CV
- Covestro AG
- Far Eastern New Century Corporation
- Indorama Ventures Public Company Limited
- INEOS
- JBF Industries Ltd
- Reliance Industries Limited
- Rohm GmbH
- SABIC
- Safripol division of KAP Diversified Industrial(Pty)Ltd
第7章 CEO 的關鍵策略問題
第 8 章 附錄
- 世界概況
- 概述
- 五力分析框架(產業吸引力分析)
- 全球價值鏈分析
- 市場動態(DRO)
- 資訊來源及延伸閱讀
- 圖片列表
- 關鍵見解
- 數據包
- 詞彙表
The Africa Engineering Plastics Market size is estimated at 1.59 billion USD in 2024, and is expected to reach 2.31 billion USD by 2029, growing at a CAGR of 7.77% during the forecast period (2024-2029).
Packaging industry to dominate the market in the coming years
- In 2022, the African engineering plastics market had a global share of 1.32% by revenue. One of the primary drivers of the increase in resin consumption is their increased use in the packaging, electrical, and electronics industries. The packaging and electrical and electronics industries accounted for around 37.5% of the revenue and 12.18% of the revenue of the overall engineering plastics market, respectively, in 2022.
- Africa's plastic packaging production had a volume of 3.13 million tons in 2022, a 2.85% growth compared to the previous year. This plastic packaging industry has developed in the region largely as a response to growth in the farming and food industries. The food industry is increasingly interested in the marketing aspect of packaging for their finished products. The need to improve the product's shelf-life and increase convenience lifestyle is expected to drive the market during the forecast period, registering a CAGR of 4.95% in terms of volume.
- The electrical and electronics industry is the second largest in the region. The region's revenue from electrical and electronics production was USD 32 billion in 2022, with increasing demand for electrical and electronics in Africa and major South Korean electrical and electronics brands investing in setting up their manufacturing facilities, like LG's new investment in setting up washing machine assembly plant in Sudan. As a result, the engineering plastics market in the region is expected to record a CAGR of 7.41%, by revenue, from 2023 to 2029.
- The automotive industry is projected to be the fastest-growing industry in the market, with a CAGR of 8.93%, by value, during the forecast period (2023-2029). This can be attributed to the growing automotive production in Morocco and South Africa.
South Africa to remain the largest market in the region
- Engineering plastics are used in African countries such as Nigeria and South Africa for various industries, including automotive, aerospace, and industrial machinery. In 2022, South Africa and Nigeria accounted for 30.15% and 10.69% of the values of various engineering plastic resins, respectively, in the region.
- South Africa is the largest consumer of engineering plastics in the region, owing to its rising aerospace, automotive, and industrial machinery industries. Aircraft components and vehicle production held a share of around 68.7% by revenue and 44.3% by volume compared at the regional level, respectively, in 2022. These industries are driving the increasing demand for various resins. The rising automotive, industrial, and machinery production due to increased climate-conscious policies is expected to drive the demand for resins in South Africa.
- The demand for various resins in Nigeria is increasing significantly due to rising vehicle production and growth in the industrial and machinery industry, among other factors. Nigeria is Africa's largest vehicle producer. In 2022, the country produced 394,449 units, translating to a 33% share of vehicle production in Africa. The production of vehicles in the country is expanding, especially of two-wheelers. The production of vehicles is expected to reach 584,350 units by 2029, recording a CAGR of 6.77%. These factors are expected to drive the demand for engineering plastics in the country.
- South Africa is expected to be the fastest-growing country in Africa for the consumption of engineering plastics, with a CAGR of 6.45%, by revenue, from 2023 to 2029, owing to increased vehicle production and growth in aerospace and other industries. For example, aerospace component production in the country is expected to record a CAGR of 5.48%, by revenue, during the forecast period, and it is expected to drive the South African engineering plastics market.
Africa Engineering Plastics Market Trends
Manufacturing on the rise to tackle the rapidly growing demand
- South Africa is the leading manufacturing hub in Africa. Its manufacturing capabilities, efficient logistics network, and preferential regional market access position the country as an ideal location for electronics companies seeking to supply their products to Africa. South Africa has a diverse electronics industry that ranges from electrical machinery, household appliances, and telecommunication equipment to consumer electronics. In 2022, the African region imported around 70% of its local electrical and electronics demand.
- The consumer electronics industry still relies heavily on imports. According to estimates, South Africa brought 60% of all consumer electronics into Africa in 2018. In 2020, the electrical and electronic production in the country decreased at a growth rate of around 3.2%, by revenue, compared to the previous year, owing to the widespread lockdown adopted by the government and the supply chain disruption faced due to the lockdown. In the feature phone space, shipments were down by 26.6% to 21.9 million units as vendors were transitioning away from these devices toward entry-level smartphones. All such factors led to a decrease in the production of electrical and electronic components in the region at a CAGR of -9.41% from 2020 to 2022.
- The government is focused on promoting and supporting domestic manufacturing, R&D, and developing safety standards for the electrical and electronics manufacturing industry. The output of electrical and electronic industrial components is anticipated to record a CAGR of 6.28% during the forecast period (2023-2029) to supply the emerging African middle-class population.
Africa Engineering Plastics Industry Overview
The Africa Engineering Plastics Market is fairly consolidated, with the top five companies occupying 100%. The major players in this market are Indorama Ventures Public Company Limited, INEOS, Reliance Industries Limited, SABIC and Safripol division of KAP Diversified Industrial (Pty) Ltd (sorted alphabetically).
Additional Benefits:
- The market estimate (ME) sheet in Excel format
- 3 months of analyst support
TABLE OF CONTENTS
1 EXECUTIVE SUMMARY & KEY FINDINGS
2 REPORT OFFERS
3 INTRODUCTION
- 3.1 Study Assumptions & Market Definition
- 3.2 Scope of the Study
- 3.3 Research Methodology
4 KEY INDUSTRY TRENDS
- 4.1 End User Trends
- 4.1.1 Aerospace
- 4.1.2 Automotive
- 4.1.3 Building and Construction
- 4.1.4 Electrical and Electronics
- 4.1.5 Packaging
- 4.2 Import And Export Trends
- 4.2.1 Fluoropolymer Trade
- 4.2.2 Polyamide (PA) Trade
- 4.2.3 Polyethylene Terephthalate (PET) Trade
- 4.2.4 Polymethyl Methacrylate (PMMA) Trade
- 4.2.5 Polyoxymethylene (POM) Trade
- 4.2.6 Styrene Copolymers (ABS and SAN) Trade
- 4.3 Price Trends
- 4.4 Recycling Overview
- 4.4.1 Polyamide (PA) Recycling Trends
- 4.4.2 Polycarbonate (PC) Recycling Trends
- 4.4.3 Polyethylene Terephthalate (PET) Recycling Trends
- 4.4.4 Styrene Copolymers (ABS and SAN) Recycling Trends
- 4.5 Regulatory Framework
- 4.5.1 Nigeria
- 4.5.2 South Africa
- 4.6 Value Chain & Distribution Channel Analysis
5 MARKET SEGMENTATION (includes market size in Value in USD and Volume, Forecasts up to 2029 and analysis of growth prospects)
- 5.1 End User Industry
- 5.1.1 Aerospace
- 5.1.2 Automotive
- 5.1.3 Building and Construction
- 5.1.4 Electrical and Electronics
- 5.1.5 Industrial and Machinery
- 5.1.6 Packaging
- 5.1.7 Other End-user Industries
- 5.2 Resin Type
- 5.2.1 Fluoropolymer
- 5.2.1.1 By Sub Resin Type
- 5.2.1.1.1 Ethylenetetrafluoroethylene (ETFE)
- 5.2.1.1.2 Fluorinated Ethylene-propylene (FEP)
- 5.2.1.1.3 Polytetrafluoroethylene (PTFE)
- 5.2.1.1.4 Polyvinylfluoride (PVF)
- 5.2.1.1.5 Polyvinylidene Fluoride (PVDF)
- 5.2.1.1.6 Other Sub Resin Types
- 5.2.2 Liquid Crystal Polymer (LCP)
- 5.2.3 Polyamide (PA)
- 5.2.3.1 By Sub Resin Type
- 5.2.3.1.1 Aramid
- 5.2.3.1.2 Polyamide (PA) 6
- 5.2.3.1.3 Polyamide (PA) 66
- 5.2.3.1.4 Polyphthalamide
- 5.2.4 Polybutylene Terephthalate (PBT)
- 5.2.5 Polycarbonate (PC)
- 5.2.6 Polyether Ether Ketone (PEEK)
- 5.2.7 Polyethylene Terephthalate (PET)
- 5.2.8 Polyimide (PI)
- 5.2.9 Polymethyl Methacrylate (PMMA)
- 5.2.10 Polyoxymethylene (POM)
- 5.2.11 Styrene Copolymers (ABS and SAN)
- 5.2.1 Fluoropolymer
- 5.3 Country
- 5.3.1 Nigeria
- 5.3.2 South Africa
- 5.3.3 Rest of Africa
6 COMPETITIVE LANDSCAPE
- 6.1 Key Strategic Moves
- 6.2 Market Share Analysis
- 6.3 Company Landscape
- 6.4 Company Profiles (includes Global Level Overview, Market Level Overview, Core Business Segments, Financials, Headcount, Key Information, Market Rank, Market Share, Products and Services, and Analysis of Recent Developments).
- 6.4.1 Alfa S.A.B. de C.V.
- 6.4.2 Covestro AG
- 6.4.3 Far Eastern New Century Corporation
- 6.4.4 Indorama Ventures Public Company Limited
- 6.4.5 INEOS
- 6.4.6 JBF Industries Ltd
- 6.4.7 Reliance Industries Limited
- 6.4.8 Rohm GmbH
- 6.4.9 SABIC
- 6.4.10 Safripol division of KAP Diversified Industrial (Pty) Ltd
7 KEY STRATEGIC QUESTIONS FOR ENGINEERING PLASTICS CEOS
8 APPENDIX
- 8.1 Global Overview
- 8.1.1 Overview
- 8.1.2 Porter's Five Forces Framework (Industry Attractiveness Analysis)
- 8.1.3 Global Value Chain Analysis
- 8.1.4 Market Dynamics (DROs)
- 8.2 Sources & References
- 8.3 List of Tables & Figures
- 8.4 Primary Insights
- 8.5 Data Pack
- 8.6 Glossary of Terms
 先進工程聚合物市場預測至2032年:按聚合物類型、形態、性能、技術、最終用戶和地區分類的全球分析
 日本工程塑膠市場報告(按樹脂類型、最終用途產業和地區分類,2026-2034年)
 工程塑膠市場規模、佔有率和成長分析(按樹脂類型、最終用途和地區分類)-2026-2033年產業預測
 工程塑膠市場規模、佔有率、成長及全球產業分析:依類型、應用和地區劃分的洞察與預測(2024-2032 年)
 PEEK特種工程塑膠:全球市場佔有率及排名、總收入及需求預測(2025-2031年)PA66工程塑膠:全球市場佔有率和排名、總收入和需求預測(2025-2031年)
 全球工程塑膠市場按類型、最終用途產業和地區分類-預測至2030年
 工程塑膠市場(按產品類型、加工技術、形式和應用)—全球預測,2025-2032聚甲醛市場按應用、等級、加工技術、通路和產品類型分類-2025-2032年全球預測
 2025年全球工程塑膠市場報告