


 |
市場調查報告書
商品編碼
1693772
亞太地區生物防治劑:市場佔有率分析、產業趨勢與統計、成長預測(2025-2030 年)Asia-Pacific Biocontrol Agents - Market Share Analysis, Industry Trends & Statistics, Growth Forecasts (2025 - 2030) |
||||||
※ 本網頁內容可能與最新版本有所差異。詳細情況請與我們聯繫。
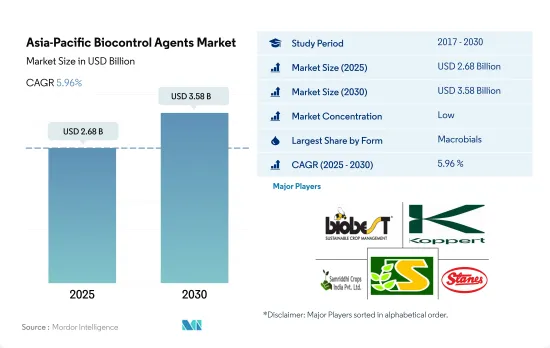
預計 2025 年亞太地區生物防治劑市場規模將達到 26.8 億美元,到 2030 年預計將達到 35.8 億美元,預測期內(2025-2030 年)的複合年成長率為 5.96%。
- 食肉動物在宏觀生物領域佔據主導地位,2022 年的市場佔有率為 90.6%。捕食者在整個生物防治劑市場中的主導地位主要是因為它們能夠攻擊不同生命階段的害蟲,甚至不同的害蟲種類,因為它們比其他生物防治劑更貪婪地進食。
- 許多捕食性節肢動物,包括甘藍夜蛾、臭蟲幼蟲和蟎蟲,都是敏捷而兇猛的獵人。它們積極地在地面或植被中尋找獵物。其他捕獵者,例如蜻蜓和蚊蚋,在飛行時捕捉獵物。相較之下,伏擊獵人會耐心地坐著,等待移動中的獵物。例如,螳螂通常偽裝得很好,並利用出其不意的方式捕獲毫無戒心的受害者。
- 微生物生物防治劑市場到2022年將佔0.1%。微生物生物防治劑比宏觀生物防治劑更容易在實驗室中培養和用於商業用途,也更容易應用。
- 2022 年,真菌生物防治劑佔亞太生物防治劑市場微生物部分的 31.0%。商業性最常用作生物防治劑的真菌種類是白殭菌和綠色木黴。白菌是一種用於防治多種害蟲的真菌,而綠色木黴則透過麻痺引起有害疾病的真菌來控制多種植物疾病。
- 2022 年,細菌生物防治劑佔亞太微生物市場的 28.9%。研究最深入的細菌屬於假單胞菌屬、芽孢桿菌屬和鏈黴菌屬,並且已註冊為商業產品。
- 亞太生物防治劑市場成長迅速,印度佔據主導地位,2022 年的市場佔有率為 51.0%。同年,微生物生物防治劑部分佔亞太市場的 60.1%。微生物生物防治劑之所以受歡迎,是因為它們比宏觀生物防治劑更容易在實驗室中生長以用於商業目的,並且更容易應用。預計 2023 年至 2029 年期間微生物領域的複合年成長率將達到 8.4%。
- 連續作物種植在該地區占主導地位,佔 2022 年亞太地區有機種植總面積的約 67.5%,同年消耗了 82.7% 的市場以金額為準。稻米、木薯、玉米、大豆、甘蔗、椰子和橡膠是該地區的主要作物。
- 中國將佔據亞太地區生物防治劑市場第二大佔有率,到2022年將佔42.3%。中國政府為減少化學農藥整體使用所做的努力以及各級地方政府制定的有機農業發展計畫正在推動中國生物防治劑市場的發展。此外,還推出了獎勵,鼓勵生產者轉向有機農業。這些因素可能會在 2023 年至 2029 年期間進一步推動該國的生物防治劑市場的發展。
- 亞太生物防治劑市場為公司和投資者帶來了巨大的成長機會。由於對有機產品的需求不斷成長以及政府和非政府推動有機農業的各種舉措,預計亞太生物防治劑市場在 2023-2029 年期間的複合年成長率將達到 8.4%。
亞太生物防治劑市場趨勢
中國、印度、印尼和澳洲等國政府的支持日益增強,有助於推動該地區的有機農業
- 根據FiBL統計,2021年亞太地區有機農地面積將超過370萬公頃,佔全球有機農地面積的26.4%。 2017年至2022年間,有機種植面積增加了19.3%。截至 2020 年,該地區共有 183 萬家有機生產者,其中印度以 130 萬家位居榜首。中國、印度、印尼和澳洲是該地區有機種植面積最大的國家。中國和印度等國家的政府部門正在不斷推廣有機農業,以減少作物種植對化學物質的依賴。例如,印度實施了「Paramparagat Krishi Vikas Yojana」和「全印度有機農業網路計畫」(AI-NPOF)等計畫。
- 2021年,中國以250萬公頃的面積佔最大佔有率,為66.1%,其次是印度,為19.3%,印度尼西亞,為1.5%,澳大利亞,為1.4%。所有有機農地分為三種作物類型:連續作物、園藝作物和經濟作物。連作作物佔該地區有機土地的最大佔有率,2021 年為 67.5%,即 250 萬公頃。該地區種植的主要連作作物包括水稻、小麥、豆類、大豆和小米。
- 經濟作物將佔第二大佔有率,到2021年將達到70萬公頃,佔有機農地的18.5%。全球對糖和有機茶等有機經濟作物的需求正在增加。中國和印度分別是有機綠茶和有機紅茶的最大生產國。由於國際需求不斷成長,該地區有機種植面積預計會增加。
澳洲人均有機產品支出最高,而中國有機食品市場成長迅速
- 2021 年該地區人均有機產品支出為 85.1 美元。同年,澳洲人均有機產品支出較高,為 58.3 美元,主要是由於消費者認為有機食品更健康,導致需求增加。根據全球有機貿易的數據,2021 年澳洲有機包裝食品和飲料市場價值 8.852 億美元。
- 預計2021年中國有機食品市場將成長13.3%,並將持續維持正成長模式,2023年至2029年的複合年成長率為7.1%。預計到2025年,有機市場規模將達到64億美元,這得益於年輕一代越來越重視有機產品,以及由於職業母親數量的增加和健康保健趨勢的普及,對有機嬰兒食品的需求不斷成長。
- 印度的有機產品遠遠落後於全球需求的 1.0%,2021 年的人均支出僅 0.08 美元。然而,印度市場在未來幾年可能會繼續成長,到 2025 年將達到 1.533 億美元。目前,該地區的有機市場高度分散,只有少數超級市場和專賣店銷售有機產品。增加消費者知識和改變購買模式可能會讓人們更了解該地區有機食品的永續性。人均收入的增加和消費者對有機食品重要性的認知的提高可能會推動亞太地區人均有機食品支出的增加。
亞太地區生物防治劑產業概況
亞太生物防治劑市場細分化,前五大公司佔2.52%。市場的主要企業有 Biobest Group NV、Koppert Biological Systems Inc.、Samriddhi Crops India Pvt Ltd、Sonkul Agro Industries、T.Stanes, Company Limited 等。
其他福利
- Excel 格式的市場預測 (ME) 表
- 3個月的分析師支持
目錄
第1章執行摘要和主要發現
第2章 報告要約
第3章 引言
- 研究假設和市場定義
- 研究範圍
- 調查方法
第4章 產業主要趨勢
- 有機種植區
- 有機產品人均支出
- 法律規範
- 澳洲
- 中國
- 印度
- 印尼
- 日本
- 菲律賓
- 泰國
- 越南
- 價值鍊和通路分析
第5章市場區隔
- 形式
- 宏觀營養學
- 按生物體
- 昆蟲病原線蟲
- 寄生蟲
- 鐵血戰士
- 微生物
- 按生物體
- 細菌生物防治劑
- 真菌生物防治劑
- 其他微生物
- 宏觀營養學
- 作物類型
- 經濟作物
- 園藝作物
- 耕地作物
- 原產地
- 澳洲
- 中國
- 印度
- 印尼
- 日本
- 菲律賓
- 泰國
- 越南
- 其他亞太地區
第6章競爭格局
- 關鍵策略趨勢
- 市場佔有率分析
- 商業狀況
- 公司簡介
- Andermatt Group AG
- Biobest Group NV
- Henan Jiyuan Baiyun Industry Co. Ltd
- KN Bio Sciences India Pvt. Ltd
- Koppert Biological Systems Inc.
- Samriddhi Crops India Pvt Ltd
- Sonkul Agro Industries
- T.Stanes and Company Limited
第7章:CEO面臨的關鍵策略問題
第 8 章 附錄
- 世界概況
- 概述
- 五力分析框架
- 全球價值鏈分析
- 市場動態(DRO)
- 資訊來源及延伸閱讀
- 圖片列表
- 關鍵見解
- 數據包
- 詞彙表
The Asia-Pacific Biocontrol Agents Market size is estimated at 2.68 billion USD in 2025, and is expected to reach 3.58 billion USD by 2030, growing at a CAGR of 5.96% during the forecast period (2025-2030).
- Predators dominated the macrobials segment with a market share of 90.6% in 2022. The dominance of the predators segment in the overall biocontrol agents market is mainly due to their ability to attack different life stages of pests and even different pest species, as they are more voracious feeders than other biocontrol agents.
- Many predatory arthropods, including lady beetles, lacewing larvae, and mites, are agile and ferocious hunters. They actively stalk their prey on the ground or in vegetation. Other hunters, such as dragonflies and robber flies, catch their prey in flight. In contrast, ambushers patiently sit and wait for mobile prey. Praying mantids, for example, are usually well camouflaged and use the element of surprise to nab their unsuspecting victims.
- The microbial biocontrol agents market accounted for 0.1% in the year 2022. The microbial biocontrol agents can easily be multiplied for commercial purposes in laboratories and have higher ease of application compared to macrobial biocontrol agents.
- Fungal biocontrol agents accounted for 31.0% of the microbial segment of the Asia-Pacific biocontrol agents market in 2022. The most commercially exploited fungal species as biocontrol agents are Beauvaria bassiania and Trichoderma viride. Beauvaria bassiania is a fungus that is used against a wide range of pests, and Trichoderma viride is used to control a wide range of plant diseases by paralyzing the harmful disease-causing fungi.
- Bacterial biocontrol agents accounted for 28.9% of the Asia-Pacific microbials market in 2022. Some of the most intensively studied are bacteria belonging to the genus Pseudomonas spp., Bacillus spp., and Streptomyces spp., which have already been registered as commercial products.
- The Asia-Pacific biocontrol agents market is growing rapidly, dominated by India, which held a market share of 51.0% in 2022. The microbial biocontrol agents segment accounted for 60.1% of the Asia-Pacific market in the same year. They are popular since they can be easily multiplied for commercial purposes in laboratories and have higher ease of application than macrobial biocontrol agents. The microbial segment is projected to witness a CAGR of 8.4% between 2023 and 2029.
- The dominance of row crop cultivation in the region, accounting for about 67.5% of the total organic cultivation area in the Asia-Pacific region in 2022, led to them recording consumption of 82.7% of the market by value in the same year. Rice, cassava, corn, soybean, sugarcane, coconut, and rubber are major crops cultivated in the region.
- China holds the second-largest share in the Asia-Pacific biocontrol agents market, accounting for a share of 42.3% in 2022. The Chinese government's initiatives to decrease the overall use of chemical pesticides and development plans for local organic agriculture by municipal governments at all levels are helping boost the Chinese biological controls market. In addition, incentives have been introduced to encourage producers to switch to organic farming. These factors may further drive the biocontrol agents market in the country between 2023 and 2029.
- The Asia-Pacific biocontrol agents market represents significant growth opportunities for businesses and investors. With the increasing demand for organic products and various government and non-government initiatives to promote organic farming, the Asia-Pacific biocontrol agents market is projected to witness a CAGR of 8.4% between 2023 and 2029.
Asia-Pacific Biocontrol Agents Market Trends
Growing government support in countries like China, India, Indonesia, and Australia, boosts organic farming in the region
- The area of organic agricultural land in Asia-Pacific was over 3.7 million ha in 2021, representing 26.4% of the global organic area, as per FiBL statistics. The organic area under cultivation grew by 19.3% between 2017-2022. As of 2020, the region had 1.83 million organic producers, with India topping the list with 1.3 million organic producers. China, India, Indonesia, and Australia are the major countries with large organic cultivation areas in the region. Government authorities in countries like China and India are constantly promoting organic agriculture to reduce reliance on chemical inputs for crop cultivation. For instance, India has implemented schemes like Paramparagat Krishi Vikas Yojana and the All India Network Programme on Organic Farming (AI-NPOF).
- In 2021, China accounted for a maximum share of 66.1%, with 2.5 million ha, followed by India, Indonesia, and Australia, with 19.3%, 1.5%, and 1.4%, respectively. The total organic land is divided into three crop types, namely row crops, horticultural crops, and cash crops. Row crops occupy a major share of organic agricultural land in the region, accounting for 67.5% share, i.e., 2.5 million ha in 2021. The major row crops grown in the region include paddy, wheat, pulses, soybeans, and millets.
- Cash crops held the second largest share, with 0.7 million ha in 2021, accounting for an 18.5% share of organic cropland. The demand for organic cash crops like sugar and organic tea is increasing worldwide. China and India are the largest organic green and black tea producers, respectively. The growing international demand is expected to increase the organic acreages in the region.
Per capita spending on organic product predominant in Australia and China's organic food market growing significantly
- The per capita spending on organic products in the region was recorded at USD 85.1 in 2021. Australia witnessed a higher per capita spending on organic products, with USD 58.3 in the same year, attributed to the higher demand due to consumers' perception of organic food as healthy. As per the Global Organic Trade data, the organic packaged food and beverage market in Australia was valued at USD 885.2 million in 2021.
- China's organic food market grew by 13.3% in 2021, and the positive growth pattern is expected to continue, with a CAGR of 7.1% between 2023 and 2029. With an increasing emphasis on the importance of organic products among the younger generation and the rising demand for organic baby food due to the growing number of mothers in the workforce and the increasing adoption of the health and wellness trend, organic products are expected to reach a value of USD 6.4 billion by 2025.
- Organic products in India represent far less than 1.0% of global demand, with a per capita expenditure of just USD 0.08 in 2021. However, the Indian market may grow over the coming years, reaching a value of USD 153.3 million by 2025. Currently, the region's organic goods market is highly fragmented, with just a few supermarkets and specialty stores selling them, as people from higher-income families are the only potential customers. Growing consumer knowledge and changing buying patterns may lead to a better understanding of organic food sustainability in the region. Increasing per capita income and increased consumer awareness of the importance of organic food can raise per capita expenditure on organic food items in the Asia-Pacific region.
Asia-Pacific Biocontrol Agents Industry Overview
The Asia-Pacific Biocontrol Agents Market is fragmented, with the top five companies occupying 2.52%. The major players in this market are Biobest Group NV, Koppert Biological Systems Inc., Samriddhi Crops India Pvt Ltd, Sonkul Agro Industries and T.Stanes and Company Limited (sorted alphabetically).
Additional Benefits:
- The market estimate (ME) sheet in Excel format
- 3 months of analyst support
TABLE OF CONTENTS
1 EXECUTIVE SUMMARY & KEY FINDINGS
2 REPORT OFFERS
3 INTRODUCTION
- 3.1 Study Assumptions & Market Definition
- 3.2 Scope of the Study
- 3.3 Research Methodology
4 KEY INDUSTRY TRENDS
- 4.1 Area Under Organic Cultivation
- 4.2 Per Capita Spending On Organic Products
- 4.3 Regulatory Framework
- 4.3.1 Australia
- 4.3.2 China
- 4.3.3 India
- 4.3.4 Indonesia
- 4.3.5 Japan
- 4.3.6 Philippines
- 4.3.7 Thailand
- 4.3.8 Vietnam
- 4.4 Value Chain & Distribution Channel Analysis
5 MARKET SEGMENTATION (includes market size in Value in USD and Volume, Forecasts up to 2030 and analysis of growth prospects)
- 5.1 Form
- 5.1.1 Macrobials
- 5.1.1.1 By Organism
- 5.1.1.1.1 Entamopathogenic Nematodes
- 5.1.1.1.2 Parasitoids
- 5.1.1.1.3 Predators
- 5.1.2 Microbials
- 5.1.2.1 By Organism
- 5.1.2.1.1 Bacterial Biocontrol Agents
- 5.1.2.1.2 Fungal Biocontrol Agents
- 5.1.2.1.3 Other Microbials
- 5.1.1 Macrobials
- 5.2 Crop Type
- 5.2.1 Cash Crops
- 5.2.2 Horticultural Crops
- 5.2.3 Row Crops
- 5.3 Country
- 5.3.1 Australia
- 5.3.2 China
- 5.3.3 India
- 5.3.4 Indonesia
- 5.3.5 Japan
- 5.3.6 Philippines
- 5.3.7 Thailand
- 5.3.8 Vietnam
- 5.3.9 Rest of Asia-Pacific
6 COMPETITIVE LANDSCAPE
- 6.1 Key Strategic Moves
- 6.2 Market Share Analysis
- 6.3 Company Landscape
- 6.4 Company Profiles (includes Global Level Overview, Market Level Overview, Core Business Segments, Financials, Headcount, Key Information, Market Rank, Market Share, Products and Services, and Analysis of Recent Developments).
- 6.4.1 Andermatt Group AG
- 6.4.2 Biobest Group NV
- 6.4.3 Henan Jiyuan Baiyun Industry Co. Ltd
- 6.4.4 KN Bio Sciences India Pvt. Ltd
- 6.4.5 Koppert Biological Systems Inc.
- 6.4.6 Samriddhi Crops India Pvt Ltd
- 6.4.7 Sonkul Agro Industries
- 6.4.8 T.Stanes and Company Limited
7 KEY STRATEGIC QUESTIONS FOR AGRICULTURAL BIOLOGICALS CEOS
8 APPENDIX
- 8.1 Global Overview
- 8.1.1 Overview
- 8.1.2 Porter's Five Forces Framework
- 8.1.3 Global Value Chain Analysis
- 8.1.4 Market Dynamics (DROs)
- 8.2 Sources & References
- 8.3 List of Tables & Figures
- 8.4 Primary Insights
- 8.5 Data Pack
- 8.6 Glossary of Terms
 生物防治劑市場-2026-2031年預測
 全球生物防治劑市場
 生物防治劑市場機會、成長動力、產業趨勢分析及 2025 - 2034 年預測
 生物防治劑市場按類型、施用方法、劑型、作物類型、施用方式及地區分類
 中國生物防治劑市場:佔有率分析、產業趨勢與統計、成長預測(2025-2030)北美生物防治劑:市場佔有率分析、產業趨勢、統計數據、成長預測(2025-2030 年)印度生物防治劑:市場佔有率分析、產業趨勢與統計、成長預測(2025-2030)歐洲生物防治劑:市場佔有率分析、產業趨勢與統計、成長預測(2025-2030)美國生物防治劑:市場佔有率分析、產業趨勢、統計數據、成長預測(2025-2030 年)
 生物防治劑市場:2033年市場分析與預測 - 依類型、產品、應用、技術、最終用戶、形式、組件、模式、階段和服務