


 |
市場調查報告書
商品編碼
1693768
亞太地區生物防治劑:市場佔有率分析、產業趨勢與統計、成長預測(2025-2030 年)Asia-Pacific Biopesticides - Market Share Analysis, Industry Trends & Statistics, Growth Forecasts (2025 - 2030) |
||||||
※ 本網頁內容可能與最新版本有所差異。詳細情況請與我們聯繫。
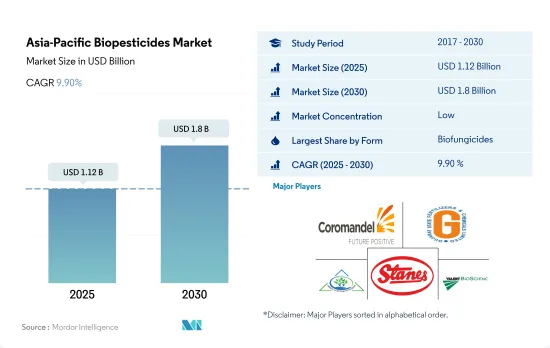
亞太生物農藥市場規模預計在 2025 年為 11.2 億美元,預計到 2030 年將達到 18 億美元,預測期內(2025-2030 年)的複合年成長率為 9.90%。
- 生物農藥是源自動物、植物、昆蟲或微生物(包括細菌和真菌)的天然物質或藥劑。這些用於控制農業害蟲和感染疾病。 2022 年亞太地區生物農藥市場價值為 8.542 億美元。
- 生物殺菌劑是該地區最常用的生物防治劑。 2022年的市場佔有率為36.8%。芽孢桿菌、木黴、鏈黴菌和假單胞菌是農業中商業性使用的微生物種類。這些生物殺菌劑可有效對抗腐霉菌、立枯絲核菌、鐮刀菌、核盤菌、串珠黴菌、灰黴病和白粉病等病原體。
- 在生物農藥中,細菌殺蟲劑蘇力菌在農業的應用最為廣泛,因為它可以在孢子形成階段產生蛋白質來控制害蟲。蘇力菌可有效控制影響多種作物的鱗翅目害蟲。
- 螢光假單胞菌和野油菜黃單胞菌分別是一種真菌和一種細菌,它們作為生物除草劑在該地區的商業性價值日益凸顯。這些真菌釋放的細胞外肽和脂多醣抑制雜草生長。已知野油菜黃單胞菌能有效控制馬唐。
- 對農業生物脅迫管理的永續方法的需求是該地區使用生物農藥的潛在驅動力。
- 在亞太地區,中國和印度等國家引領市場,向永續農業的轉型特別顯著。中國目前是該地區最大的生物農藥消費國,2022 年的市佔率將達到 29.1%。
- 為了回應人們對土壤污染、食品污染和化學殘留日益成長的擔憂,中國政府採取了積極措施,推廣使用有機投入品。這些努力包括承擔有機認證採集費用、資助農場基礎設施和有機肥料、培訓、行銷援助和土地徵用援助。中高所得群體推動了有機食品需求的不斷成長。
- 然而,印度擁有世界上最多的有機農民和第五大有機農地面積。 2021-2022年,印度生產了超過340萬噸的有機認證產品,其中包括各種食品。有機農業實踐的廣泛採用預計將推動該地區生物農藥市場的發展。
- 生物農藥市場的主要驅動力之一是抗除草劑雜草(如 L. rigidum、R. raphanustrum、Bromus spp. 和 Hordeum spp.)的發展。這些雜草已經對傳統的化學除草劑產生了抗藥性,這些除草劑透過抑制ACCase或ALS來殺死雜草,因此很難控制。這為農民採用生物除草劑等其他替代方案創造了機會,從而推動了亞太地區生物農藥市場的發展。預計 2023 年至 2029 年期間市場複合年成長率將達到 9.8%。
亞太生物農藥市場趨勢
中國、印度、印尼和澳洲等國政府的支持日益增強,有助於推動該地區的有機農業
- 根據FiBL統計,2021年亞太地區有機農地面積將超過370萬公頃,佔全球有機農地面積的26.4%。 2017年至2022年,有機種植面積將增加19.3%。截至 2020 年,該地區共有約 180 萬名有機生產者,其中印度以 130 萬位居榜首。中國、印度、印尼和澳洲是該地區有機種植面積最大的國家。中國和印度等國家的政府部門正在不斷推廣有機農業,以減少作物種植對化學物質的依賴。例如,印度實施了「Paramparagat Krishi Vikas Yojana」和「全印度有機農業網路計畫」(AI-NPOF)等計畫。
- 2021年,中國以250萬公頃的面積佔最大佔有率,為66.1%,其次是印度,為19.3%,印度尼西亞,為1.5%,澳大利亞,為1.4%。所有有機農地分為三種作物類型:連續作物、園藝作物和經濟作物。連作作物佔該地區有機土地的最大佔有率,2021 年為 67.5%,即 250 萬公頃。該地區種植的主要連作作物包括水稻、小麥、豆類、大豆和小米。
- 經濟作物將佔第二大佔有率,到2021年將達到70萬公頃,佔有機農地的18.5%。全球對糖和有機茶等有機經濟作物的需求正在增加。中國和印度分別是有機綠茶和有機紅茶的最大生產國。由於國際需求不斷成長,該地區有機種植面積預計會增加。
澳洲人均有機產品支出最高,而中國有機食品市場成長迅速
- 2021 年該地區人均有機產品支出為 85.1 美元。同年,澳洲人均有機產品支出較高,為 58.3 美元,主要是由於消費者認為有機食品更健康,導致需求增加。根據全球有機貿易的數據,2021 年澳洲有機包裝食品和飲料市場價值 8.852 億美元。
- 2021年,中國有機食品市場成長了13.3%,預計這種正面的成長模式將持續下去,2023年至2029年的複合年成長率估計為7.1%。隨著年輕一代越來越重視有機產品,以及由於職業母親數量的增加和健康保健趨勢的日益普及導致對有機嬰兒食品的需求不斷成長,預計到2025年有機市場的價值將達到64億美元。
- 印度的有機產品遠遠落後於全球需求的 1.0%,2021 年的人均支出僅 0.08 美元。然而,印度預計在未來幾年成為一個充滿希望的市場,到 2025 年將達到 1.533 億美元。目前,該地區的有機市場高度分散,有機產品僅在少數超級市場和專賣店有售。消費者知識和購買意願的提高將有助於更好地了解該地區有機食品的永續性屬性。人均收入的增加,加上消費者對消費有機食品重要性的認知不斷提高,有可能增加亞太地區人均有機食品支出。
亞太生物農藥產業概況
亞太生物農藥市場細分化,前五大公司佔3.31%。該市場的主要企業有 Coromandel International Ltd、Gujarat State Fertilizers & Chemicals Ltd、IPL Biologicals Limited、T.Stanes, Company Limited、Valent Biosciences LLC 等。
其他福利
- Excel 格式的市場預測 (ME) 表
- 3個月的分析師支持
目錄
第1章執行摘要和主要發現
第2章 報告要約
第3章 引言
- 研究假設和市場定義
- 研究範圍
- 調查方法
第4章 產業主要趨勢
- 有機種植區
- 有機產品人均支出
- 法律規範
- 澳洲
- 中國
- 印度
- 印尼
- 日本
- 菲律賓
- 泰國
- 越南
- 價值鍊和通路分析
第5章市場區隔
- 形式
- 生物真菌劑
- 生物除草劑
- 生物殺蟲劑
- 其他生物防治劑
- 作物類型
- 經濟作物
- 園藝作物
- 耕地作物
- 原產地
- 澳洲
- 中國
- 印度
- 印尼
- 日本
- 菲律賓
- 泰國
- 越南
- 其他亞太地區
第6章競爭格局
- 關鍵策略趨勢
- 市場佔有率分析
- 商業狀況
- 公司簡介
- Andermatt Group AG
- Biobest Group NV
- Biolchim SPA
- Coromandel International Ltd
- Gujarat State Fertilizers & Chemicals Ltd
- Henan Jiyuan Baiyun Industry Co. Ltd
- IPL Biologicals Limited
- Koppert Biological Systems Inc.
- T.Stanes and Company Limited
- Valent Biosciences LLC
第7章 CEO 的關鍵策略問題
第 8 章 附錄
- 世界概況
- 概述
- 五力分析框架
- 全球價值鏈分析
- 市場動態(DRO)
- 資訊來源及延伸閱讀
- 圖片列表
- 關鍵見解
- 數據包
- 詞彙表
The Asia-Pacific Biopesticides Market size is estimated at 1.12 billion USD in 2025, and is expected to reach 1.8 billion USD by 2030, growing at a CAGR of 9.90% during the forecast period (2025-2030).
- Biopesticides are naturally occurring substances or agents derived from animals, plants, insects, and microorganisms, including bacteria and fungi. They are used to manage agricultural pests and infections. The market for biopesticides in the Asia-Pacific region was valued at USD 854.2 million in 2022.
- Biofungicides are the most popular biopesticides used in the region. They held a market share of 36.8% in 2022. Bacillus, Trichoderma, Streptomyces, and Pseudomonas are the most commercially used species of microorganisms in agriculture. These biofungicides effectively act against pathogens, such as Pythium, Rhizoctonia, Fusarium, Sclerotinia, Thielaviopsis, Botrytis, and powdery mildew.
- Among bioinsecticides, the bacterial insecticide Bacillus thuringiensis is most predominantly used in agriculture due to its immense potential to control pests by producing proteins during the sporulation phase. Bacillus thuringiensis is effective in managing lepidopteran species that affect a wide range of crop types.
- Pseudomonas fluorescens and Xanthomonas campestris are fungi and bacteria, respectively, gaining commercial importance as bioherbicides in the region. The extracellular peptides and a lipopolysaccharide released from these organisms inhibit the growth of weeds. Xanthomonas campestris is known to control horseweed effectively.
- The need for sustainable approaches in managing biotic stresses in agriculture is the potential driver for biopesticide usage in the region.
- The Asia-Pacific region is witnessing a significant shift toward sustainable agriculture practices, with countries like China and India leading the market. China is currently the largest consumer of biopesticides in the region, and it accounted for a 29.1% share in 2022.
- In response to rising concerns over soil contamination, pollution, and chemical residues in food, the Chinese government is taking proactive measures to promote the usage of organic inputs. These initiatives include bearing the cost of organic certification, providing funding for on-farm infrastructure and organic fertilizers, training, marketing assistance, and assisting with land acquisition. Middle and higher-income families are driving this growing demand for organically-grown food.
- However, India has the world's highest number of organic growers, and it is the fifth-largest country in terms of organic agricultural land area. During 2021-2022, India produced over 3.4 million metric tons of certified organic products, including a wide range of food products. This high adoption of organic farming practices is expected to drive the biopesticides market in the region.
- One key driver of the biopesticides market is the development of herbicide-resistant weeds such as L. rigidum, R. raphanustrum, Bromus spp., and Hordeum spp. These weeds have developed resistance against traditional chemical herbicides that kill the weeds by ACCase- and ALS-inhibition, making control difficult. This presents an opportunity for farmers to adopt other alternatives like bioherbicides, thus driving the Asia-Pacific biopesticides market. The market is estimated to record a CAGR of 9.8% between 2023 and 2029.
Asia-Pacific Biopesticides Market Trends
Growing Government support in countries like China, India, Indonesia, and Australia, boosts organic farming in the region
- The organic agricultural area in the Asia-Pacific region was over 3.7 million hectares in 2021, representing 26.4% of the global organic area, as per FiBL statistics. The organic area under cultivation grew by 19.3% between 2017 and 2022. As of 2020, the region recorded around 1.8 million organic producers, with India topping the list with 1.3 million organic producers. China, India, Indonesia, and Australia are the major countries with large organic cultivation areas in the region. Government authorities in countries like China and India are constantly promoting organic agriculture to reduce reliance on chemical inputs for crop cultivation. For instance, India has implemented schemes like Paramparagat Krishi Vikas Yojana and the All India Network Programme on Organic Farming (AI-NPOF).
- In 2021, China accounted for a maximum share of 66.1%, with 2.5 million ha, followed by India, Indonesia, and Australia, with 19.3%, 1.5%, and 1.4%, respectively. The total organic land is divided into three crop types, namely row crops, horticultural crops, and cash crops. Row crops occupy a major share of organic agricultural land in the region, accounting for 67.5% share, i.e., 2.5 million ha in 2021. The major row crops grown in the region include paddy, wheat, pulses, soybeans, and millets.
- Cash crops held the second largest share, with 0.7 million ha in 2021, accounting for an 18.5% share of organic cropland. The demand for organic cash crops like sugar and organic tea is increasing worldwide. China and India are the largest organic green and black tea producers, respectively. The growing international demand is expected to increase the organic acreages in the region.
Per capita spending on organic product predominant in Australia and China's organic food market growing significantly
- The per capita spending on organic products in the region was recorded at USD 85.1 in 2021. Australia witnessed a higher per capita spending on organic products, with USD 58.3 in the same year, attributed to the higher demand due to consumers' perception of organic food as healthy. As per the Global Organic Trade data, Australia's organic packaged food and beverage market was valued at USD 885.2 million in 2021.
- China's organic food market grew by 13.3% in 2021, and the positive growth pattern is expected to continue, with an estimated CAGR of 7.1% between 2023 and 2029. With an increasing emphasis on the importance of organic products among the younger generation and a rise in demand for organic baby food due to the growing number of mothers in the workforce and the increasing adoption of the health and wellness trend, organic products are expected to reach a value of USD 6.4 billion by 2025.
- Organic products in India represent far less than 1.0% of global demand, with a per capita expenditure of just USD 0.08 in 2021. However, India represents a promising market over the coming years, reaching a value of USD 153.3 million by 2025. Currently, the market for organic goods in the region is very fragmented, with just a few supermarkets and specialty stores selling them, as only people from higher-income families are potential customers. Growing consumer knowledge and buying motivations will lead to a better understanding of the sustainability qualities of organic food in the region. Increasing per capita income, along with increased consumer awareness of the importance of organic food intake, has the potential to raise per capita expenditure on organic food items in the Asia-Pacific region.
Asia-Pacific Biopesticides Industry Overview
The Asia-Pacific Biopesticides Market is fragmented, with the top five companies occupying 3.31%. The major players in this market are Coromandel International Ltd, Gujarat State Fertilizers & Chemicals Ltd, IPL Biologicals Limited, T.Stanes and Company Limited and Valent Biosciences LLC (sorted alphabetically).
Additional Benefits:
- The market estimate (ME) sheet in Excel format
- 3 months of analyst support
TABLE OF CONTENTS
1 EXECUTIVE SUMMARY & KEY FINDINGS
2 REPORT OFFERS
3 INTRODUCTION
- 3.1 Study Assumptions & Market Definition
- 3.2 Scope of the Study
- 3.3 Research Methodology
4 KEY INDUSTRY TRENDS
- 4.1 Area Under Organic Cultivation
- 4.2 Per Capita Spending On Organic Products
- 4.3 Regulatory Framework
- 4.3.1 Australia
- 4.3.2 China
- 4.3.3 India
- 4.3.4 Indonesia
- 4.3.5 Japan
- 4.3.6 Philippines
- 4.3.7 Thailand
- 4.3.8 Vietnam
- 4.4 Value Chain & Distribution Channel Analysis
5 MARKET SEGMENTATION (includes market size in Value in USD and Volume, Forecasts up to 2030 and analysis of growth prospects)
- 5.1 Form
- 5.1.1 Biofungicides
- 5.1.2 Bioherbicides
- 5.1.3 Bioinsecticides
- 5.1.4 Other Biopesticides
- 5.2 Crop Type
- 5.2.1 Cash Crops
- 5.2.2 Horticultural Crops
- 5.2.3 Row Crops
- 5.3 Country
- 5.3.1 Australia
- 5.3.2 China
- 5.3.3 India
- 5.3.4 Indonesia
- 5.3.5 Japan
- 5.3.6 Philippines
- 5.3.7 Thailand
- 5.3.8 Vietnam
- 5.3.9 Rest of Asia-Pacific
6 COMPETITIVE LANDSCAPE
- 6.1 Key Strategic Moves
- 6.2 Market Share Analysis
- 6.3 Company Landscape
- 6.4 Company Profiles (includes Global Level Overview, Market Level Overview, Core Business Segments, Financials, Headcount, Key Information, Market Rank, Market Share, Products and Services, and Analysis of Recent Developments).
- 6.4.1 Andermatt Group AG
- 6.4.2 Biobest Group NV
- 6.4.3 Biolchim SPA
- 6.4.4 Coromandel International Ltd
- 6.4.5 Gujarat State Fertilizers & Chemicals Ltd
- 6.4.6 Henan Jiyuan Baiyun Industry Co. Ltd
- 6.4.7 IPL Biologicals Limited
- 6.4.8 Koppert Biological Systems Inc.
- 6.4.9 T.Stanes and Company Limited
- 6.4.10 Valent Biosciences LLC
7 KEY STRATEGIC QUESTIONS FOR AGRICULTURAL BIOLOGICALS CEOS
8 APPENDIX
- 8.1 Global Overview
- 8.1.1 Overview
- 8.1.2 Porter's Five Forces Framework
- 8.1.3 Global Value Chain Analysis
- 8.1.4 Market Dynamics (DROs)
- 8.2 Sources & References
- 8.3 List of Tables & Figures
- 8.4 Primary Insights
- 8.5 Data Pack
- 8.6 Glossary of Terms
 生物殺線蟲劑市場規模、佔有率和成長分析(按類型、劑型、應用方式、作物類型、蟲害類型和地區分類)-產業預測,2025-2032年
 全球生物肥料和生物農藥市場:預測至2032年-按產品類型、形態、應用方法、作物類型和地區分類的分析
 生物農藥市場(按類型、作物、劑型、應用和銷售管道)——2025-2030 年全球預測
 2025-2033年生物農藥市場報告(依產品、劑型、來源、應用方式、作物種類及地區)
 2025年全球生物農藥市場報告
 生物農藥市場:2025 年至 2030 年預測
 細菌生物防治劑:市場佔有率分析、產業趨勢、統計數據、成長預測(2025-2030 年)2032年生物農藥市場預測:按產品類型、作物類型、劑型、應用、最終用戶和地區進行的全球分析日本生物農藥市場報告(依產品類型(生物除草劑、生物殺蟲劑、生物殺菌劑等)、應用領域(作物型、非作物型)及地區分類)2025-2033
 生物農藥市場規模、佔有率及成長分析(按類型、來源、劑型、應用類型、作物類型和地區)-2025-2032 年產業預測