


 |
市場調查報告書
商品編碼
1693755
北美生物防治劑:市場佔有率分析、產業趨勢與統計、成長預測(2025-2030 年)North America Biopesticides - Market Share Analysis, Industry Trends & Statistics, Growth Forecasts (2025 - 2030) |
||||||
價格
※ 本網頁內容可能與最新版本有所差異。詳細情況請與我們聯繫。
簡介目錄
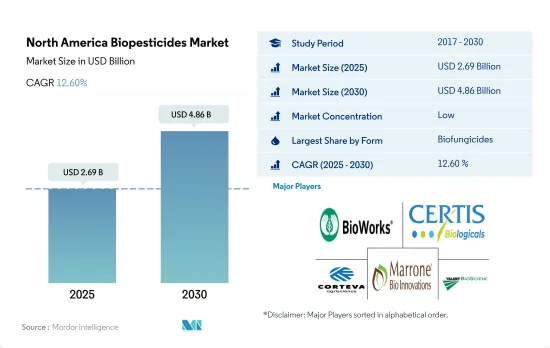
北美生物農藥市場規模預計在 2025 年為 26.9 億美元,預計到 2030 年將達到 48.6 億美元,預測期內(2025-2030 年)的複合年成長率為 12.60%。
- 生物農藥是施用於植物以預防由致病真菌引起的疾病的物質。生物農藥要么來自微生物,要么植物來源。在北美,生物農藥市場規模預計在2022年達到8.912億美元,同年市場佔有率為46.7%,是最受歡迎的生物農藥類型。芽孢桿菌、木黴菌和假單胞菌等微生物種是市面上使用最廣泛的生物農藥。
- 預計2022年北美生物農藥市值將達5.65億美元,佔29.6%,成為第二大消費量生物農藥。此外,佔有機農業面積最大的大田田間作物在2022年佔生物農藥使用量的73.5%。其次是園藝作物,佔21.4%,經濟作物佔5%。
- 其他生物農藥包括殺線蟲劑、殺鼠劑、殺蟎劑、殺軟體動物劑等生物來源產品。這些生物農藥在2022年的佔有率為16.08%,位居生物殺菌劑和生物殺蟲劑之後的第三位。
- 預計2022年生物除草劑市場規模將達1.444億美元,同年消費量將達9,900噸。生物除草劑是用於控制與作物生長競爭的雜草的微生物、植物抽取物或其他植物毒素,透過抑制雜草生長或阻止雜草種子發芽來控制。
- 由於農民對農藥過度使用的認知不斷提高,以及政府支持永續和有機農業實踐的舉措,對生物農藥的需求正在上升。因此,預計生物農藥市場將在 2023-2029 年期間擴大。
- 北美生物農藥市場主要由美國主導,2022 年佔市場佔有率的 68.9%。這一成長歸功於該國廣闊的有機種植面積,佔該地區作物作物總面積的 39.5%。連續作物也發揮重要作用,到 2022 年將佔市場價值的 50.5%。
- 加拿大是該地區第二大生物農藥市場,2022 年的市場佔有率為 23.7%。該國有機作物種植面積正在擴大,將從2017年的40萬公頃增加到2022年的45萬公頃。預計這一趨勢將持續下去,推動農業植物生物防治化學品市場的成長。
- 墨西哥是北美有機農業面積第二大的國家,2022年有機作物種植總面積為54萬公頃,預計2029年將增加至61萬公頃。有機作物種植面積的增加是生物農藥需求的主要動力。
- 2022 年,北美其他地區的生物農藥消費量量佔不到 1.15%。然而,2017 年至 2022 年期間,該市場成長了 2.9%。預計 2023 年至 2029 年的複合年成長率為 9.2%。
- 由於農民對永續性的認知不斷提高以及政府推動有機農業的舉措,預計北美生物農藥市場在美國的成長速度將快於其他北美國家。對有機產品和永續農業的需求不斷成長也可能推動未來幾年生物農藥市場的成長。
北美生物農藥市場趨勢
美國等主要國家對有機農產品的需求正在成長,政府的支持也有助於增加有機農產品的種植面積
- 根據FibL統計的數據,2021年北美作物有機種植面積達150萬公頃。 2017年至2021年間,該地區有機種植面積增加了13.5%。在北美國家中,美國佔據主導地位,有62.3萬公頃農地用於有機農業,其中加州、緬因州和紐約州是實施有機農業的主要州。
- 緊隨美國之後的是墨西哥,2021年有機農業用地面積達531,100公頃。墨西哥是全球前20大有機食品生產國之一。根據世界咖啡大師的數據,墨西哥是世界上最大的有機咖啡出口國。從有機咖啡種植者的數量來看,它是全國有機咖啡生產面積最大的國家。該國主要的有機食品生產州是恰帕斯州、瓦哈卡州、米卻肯州、奇瓦瓦州和格雷羅州,佔全國有機種植面積的80.0%。全國有機農業協會等組織正在該國推廣有機農業,預計將激勵更多農民從事有機農業。除了資金支持外,墨西哥政府也支持有機農業的研發活動。
- 加拿大作物作物面積從2017年的40萬公頃增加到2021年的45萬公頃。 2021年,行作物將佔最大面積,達42萬公頃。加拿大政府宣布,將於2021年向有機發展基金提供297,330美元,用於支持有機農民。這些努力有望增加該地區有機種植的面積。
國內外市場對有機農產品的需求不斷成長,人均有機食品支出不斷增加
- 2021年北美人均有機食品支出為109.7美元,其中美國人均支出最高,2021年平均支出為186.7美元。根據有機食品協會統計,2021年美國有機產品銷售額超過630億美元,與前一年同期比較成長2.0%,其中有機食品銷售額達575億美元。有機水果和蔬菜佔有機產品總銷售額的15.0%,2021年價值210億美元。
- 根據加拿大有機聯盟報告的數據,2020 年加拿大有機食品銷售額達到 81 億美元。加拿大是世界第六大有機產品市場,據報道,該國有機產品的供應量無法滿足需求。 2021年有機食品人均支出為142.6美元。政府加大對零售商的支持力度,預計將提高該國有機產品的供應量、可近性和可負擔性。有機塔爾德協會預測,2021 年至 2026 年間,加拿大有機產品市場將達到 6.3% 的複合年成長率。
- 2021年,墨西哥有機產品市場規模為6,300萬美元,全球排名第35。根據有機貿易協會估計,2021年至2026年期間的複合年成長率為7.2%。然而,與該地區的其他國家相比,該國的人均有機產品支出較低,2021年為0.49美元。隨著越來越多的參與企業進入墨西哥市場,預計該國對有機產品的需求將會增加。
北美生物農藥產業概況
北美生物農藥市場細分化,前五大公司佔6.36%的市佔率。該市場的主要企業包括 Bioworks Inc.、Certis USA LLC、Corteva Agriscience、Marrone Bio Innovations Inc.、Valent Biosciences LLC 等。
其他福利
- Excel 格式的市場預測 (ME) 表
- 3個月的分析師支持
目錄
第1章執行摘要和主要發現
第2章 報告要約
第3章 引言
- 研究假設和市場定義
- 研究範圍
- 調查方法
第4章 產業主要趨勢
- 有機種植區
- 有機產品人均支出
- 法律規範
- 加拿大
- 墨西哥
- 美國
- 價值鍊和通路分析
第5章市場區隔
- 形式
- 生物防治劑
- 生物除草劑
- 生物防治劑
- 其他生物防治劑
- 作物類型
- 經濟作物
- 園藝作物
- 耕地作物
- 原產地
- 加拿大
- 墨西哥
- 美國
- 北美其他地區
第6章競爭格局
- 關鍵策略趨勢
- 市場佔有率分析
- 商業狀況
- 公司簡介
- AEF Global Biopesticides
- Andermatt Group AG
- BIOQUALITUM SA de CV
- Bioworks Inc.
- Certis USA LLC
- Corteva Agriscience
- Lallemand Inc.
- Marrone Bio Innovations Inc.
- Terramera Inc.
- Valent Biosciences LLC
第7章:CEO面臨的關鍵策略問題
第 8 章 附錄
- 世界概況
- 概述
- 五力分析框架
- 全球價值鏈分析
- 市場動態(DRO)
- 資訊來源及延伸閱讀
- 圖片列表
- 關鍵見解
- 數據包
- 詞彙表
簡介目錄
Product Code: 500015
The North America Biopesticides Market size is estimated at 2.69 billion USD in 2025, and is expected to reach 4.86 billion USD by 2030, growing at a CAGR of 12.60% during the forecast period (2025-2030).
- Biofungicides are substances applied to plants to prevent diseases caused by pathogenic fungi. Biofungicides may be of microbial or botanical origin. In North America, the market for biofungicides was valued at USD 891.2 million in 2022, making them the most popular biopesticide type, with a 46.7% market share in the same year. Microbial species like Bacillus, Trichoderma, and Pseudomonas are the most available biofungicides in the market.
- The market for bioinsecticides in North America was valued at USD 565.0 million in 2022, with a share of 29.6%, making it the second most consumed biopesticide. Furthermore, the field crops with the largest area under organic agriculture accounted for 73.5% of bioinsecticide usage in 2022. Horticulture and cash crops followed with 21.4% and 5%, respectively, in the same year.
- Other biopesticides include products like nematicides, rodenticides, acaricides, and molluscicides of biological origin. These biological pesticides accounted for a share of 16.08% in 2022, occupying the third place after biofungicides and bioinsecticides.
- The market for biological herbicides was valued at USD 144.4 million in 2022, with a volume consumption of 9.9 thousand metric tons in the same year. Bioherbicides are microbes, plant extracts, or other phytotoxins used to manage weeds that compete with crops for growth by reducing weed growth or germinating weed seeds.
- The increasing awareness about the overuse of pesticides among farmers and the government initiatives to support sustainable agricultural practices and organic farming resulted in an increasing demand for biopesticides. Therefore, the market for biopesticides is anticipated to increase between 2023 and 2029.
- The North American biopesticides market is largely dominated by the United States, which accounted for 68.9% of the market value in 2022. This growth can be attributed to the country's vast organic cultivation area, which makes up 39.5% of the total organic crop area in the region. Row crops also play a significant role, which made up 50.5% of the market value in 2022.
- Canada was the second-largest biopesticides market in the region, with a market share of 23.7% in 2022. The country's organic crop farming area has been expanding, which grew from 400.0 thousand ha in 2017 to 450.0 thousand ha in 2022. This trend is expected to continue, driving growth in the agricultural plant biopesticides market.
- Mexico has the second-largest organic agricultural area in North America, with an overall organic crop area of 0.54 million ha in 2022, which is expected to increase to 0.61 million ha by 2029. This growth in organic crop areas is a key demand driver for biopesticides.
- The Rest of North America accounted for less than 1.15% of biopesticide consumption in 2022. However, the market grew by 2.9% between 2017 and 2022. It is projected to register a CAGR of 9.2% between 2023 and 2029.
- The North American biopesticides market is expected to grow faster in the United States than in other North American countries due to increased knowledge of sustainability among farmers and government measures promoting organic farming. The rising demand for organic products and sustainable agriculture practices may also drive growth in the biopesticides market in the coming years.
North America Biopesticides Market Trends
Organic produce demand grows in major countries like the United States, increasing cultivation area with government support
- The area under organic cultivation of crops in North America was recorded at 1.5 million ha in 2021, according to the data provided by FibL statistics. The area under organic cultivation in the region increased by 13.5% between 2017 and 2021. Among the North American countries, the United States is dominant, with 623.0 thousand ha of agricultural land under organic farming, with California, Maine, and New York being the major states practicing agriculture.
- The United States was followed by Mexico, with 531.1 thousand hectares of area under organic farming in 2021. Mexico is among the top 20 organic food producers in the world. Mexico is the largest exporter of organic coffee in the world, according to the Global Coffee Masters data. The country has the largest area under organic coffee production in terms of the number of organic coffee producers in the country. The major organic food-producing states in the country include Chiapas, Oaxaca, Michoacan, Chihuahua, and Guerrero, which account for 80.0% of the total organic area in the country. Organizations such as the National Association for Organic Agriculture are promoting organic agriculture in the country, which is expected to motivate more farmers to take up organic agriculture. In addition to financial assistance, the Mexican government supports research and development activities to help organic agriculture.
- Canada's area under organic crop cultivation increased from 0.4 million ha in 2017 to 0.45 million ha in 2021. Row crops occupied the maximum area with 0.42 million in 2021. The Canadian government announced a sum of USD 297,330 in 2021 as Organic Development Fund to support organic farmers. These initiatives are expected to increase the organic area in the region.
Growing demand for organic produce in domestic and international markets, rise in per capita spending on organic food
- The average per capita spending on organic food products in North America was USD 109.7 in 2021. The per capita spending in the United States is the highest among the North American countries, with average spending of USD 186.7 in 2021. The sales of organic products in the United States crossed USD 63.00 billion in 2021, according to the Organic Tarde Association, with a 2.0% increase over the previous year, with organic food sales standing at USD 57.5 billion in 2021. Organic fruits and vegetables accounted for 15.0% of the total organic product sales, with a value of USD 21.0 billion in 2021.
- Organic food sales in Canada reached a value of USD 8.10 billion in 2020, as per the data reported by the Organic Federation of Canada. It is reported that Canada is the sixth-largest market in the world for organic products, with the supply of organic products failing to keep up with the demand in the country. The average spending on organic food per person was USD 142.6 in 2021. Increasing government support to retailers is expected to increase the availability, accessibility, and affordability of organic products in the country. The Organic Tarde Association estimates that the organic products market in Canada is expected to register a CAGR of 6.3% between 2021 and 2026.
- In 2021, Mexico registered a market size of USD 63.0 million for organic products with a global rank of 35. According to the Organic Trade Association, it is estimated to register a CAGR of 7.2% between 2021 and 2026. However, the per capita spending on organic products in the country is less compared to other countries in the region, accounting for a value of USD 0.49 in 2021. More players entering the market in Mexico are expected to increase the demand for organic products in the country.
North America Biopesticides Industry Overview
The North America Biopesticides Market is fragmented, with the top five companies occupying 6.36%. The major players in this market are Bioworks Inc., Certis U.S.A. LLC, Corteva Agriscience, Marrone Bio Innovations Inc. and Valent Biosciences LLC (sorted alphabetically).
Additional Benefits:
- The market estimate (ME) sheet in Excel format
- 3 months of analyst support
TABLE OF CONTENTS
1 EXECUTIVE SUMMARY & KEY FINDINGS
2 REPORT OFFERS
3 INTRODUCTION
- 3.1 Study Assumptions & Market Definition
- 3.2 Scope of the Study
- 3.3 Research Methodology
4 KEY INDUSTRY TRENDS
- 4.1 Area Under Organic Cultivation
- 4.2 Per Capita Spending On Organic Products
- 4.3 Regulatory Framework
- 4.3.1 Canada
- 4.3.2 Mexico
- 4.3.3 United States
- 4.4 Value Chain & Distribution Channel Analysis
5 MARKET SEGMENTATION (includes market size in Value in USD and Volume, Forecasts up to 2030 and analysis of growth prospects)
- 5.1 Form
- 5.1.1 Biofungicides
- 5.1.2 Bioherbicides
- 5.1.3 Bioinsecticides
- 5.1.4 Other Biopesticides
- 5.2 Crop Type
- 5.2.1 Cash Crops
- 5.2.2 Horticultural Crops
- 5.2.3 Row Crops
- 5.3 Country
- 5.3.1 Canada
- 5.3.2 Mexico
- 5.3.3 United States
- 5.3.4 Rest of North America
6 COMPETITIVE LANDSCAPE
- 6.1 Key Strategic Moves
- 6.2 Market Share Analysis
- 6.3 Company Landscape
- 6.4 Company Profiles (includes Global Level Overview, Market Level Overview, Core Business Segments, Financials, Headcount, Key Information, Market Rank, Market Share, Products and Services, and Analysis of Recent Developments).
- 6.4.1 AEF Global Biopesticides
- 6.4.2 Andermatt Group AG
- 6.4.3 BIOQUALITUM SA de CV
- 6.4.4 Bioworks Inc.
- 6.4.5 Certis U.S.A. LLC
- 6.4.6 Corteva Agriscience
- 6.4.7 Lallemand Inc.
- 6.4.8 Marrone Bio Innovations Inc.
- 6.4.9 Terramera Inc.
- 6.4.10 Valent Biosciences LLC
7 KEY STRATEGIC QUESTIONS FOR AGRICULTURAL BIOLOGICALS CEOS
8 APPENDIX
- 8.1 Global Overview
- 8.1.1 Overview
- 8.1.2 Porter's Five Forces Framework
- 8.1.3 Global Value Chain Analysis
- 8.1.4 Market Dynamics (DROs)
- 8.2 Sources & References
- 8.3 List of Tables & Figures
- 8.4 Primary Insights
- 8.5 Data Pack
- 8.6 Glossary of Terms
02-2729-4219
+886-2-2729-4219
 生物殺線蟲劑市場規模、佔有率和成長分析(按類型、劑型、應用方式、作物類型、蟲害類型和地區分類)-產業預測,2025-2032年
 全球生物肥料和生物農藥市場:預測至2032年-按產品類型、形態、應用方法、作物類型和地區分類的分析
 生物農藥市場(按類型、作物、劑型、應用和銷售管道)——2025-2030 年全球預測
 2025-2033年生物農藥市場報告(依產品、劑型、來源、應用方式、作物種類及地區)
 2025年全球生物農藥市場報告
 生物農藥市場:2025 年至 2030 年預測
 細菌生物防治劑:市場佔有率分析、產業趨勢、統計數據、成長預測(2025-2030 年)2032年生物農藥市場預測:按產品類型、作物類型、劑型、應用、最終用戶和地區進行的全球分析日本生物農藥市場報告(依產品類型(生物除草劑、生物殺蟲劑、生物殺菌劑等)、應用領域(作物型、非作物型)及地區分類)2025-2033
 生物農藥市場規模、佔有率及成長分析(按類型、來源、劑型、應用類型、作物類型和地區)-2025-2032 年產業預測
▼