


 |
市場調查報告書
商品編碼
1693753
美國生物防治劑:市場佔有率分析、產業趨勢、統計數據、成長預測(2025-2030 年)United States Biocontrol Agents - Market Share Analysis, Industry Trends & Statistics, Growth Forecasts (2025 - 2030) |
||||||
※ 本網頁內容可能與最新版本有所差異。詳細情況請與我們聯繫。
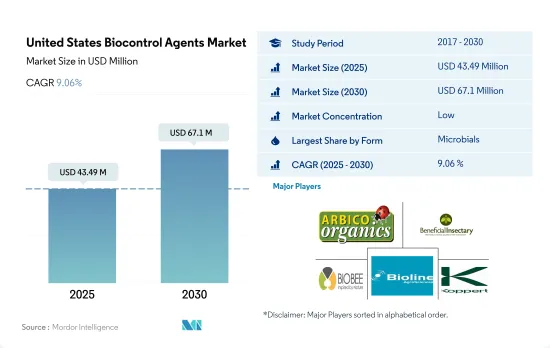
美國生物防治劑市場規模預計在 2025 年為 4,349 萬美元,預計到 2030 年將達到 6,710 萬美元,預測期內(2025-2030 年)的複合年成長率為 9.06%。
- 在美國,生物防治劑是農業生技藥品市場中第二大消費品。 2022 年在作物保護領域的佔有率為 2.6%。
- 以微生物為基礎的生物防治劑是美國生物防治劑市場中最大的消費者,2022 年佔 89.1% 的佔有率。細菌、真菌、病毒和原生動物就是其中一些微生物。微生物以三種不同的方式充當生物防治劑:將疾病注入害蟲體內、與害蟲競爭或殺死害蟲。
- 2022 年,真菌生物防治劑市場約佔微生物生物防治劑市場以金額為準的 62.7%。預計從 2017 年到 2022 年,真菌生物防治劑市場規模將成長約 44.4%,可歸因於農民對綜合蟲害管理和永續農業的認知不斷提高。
- 2022年美國宏觀生物防治劑的市佔率為10.9%。大型生物是害蟲的天敵,被稱為無脊椎動物生物防治劑。這些包括蟎蟲、昆蟲捕食者、寄生蟲和昆蟲病原線蟲 (EPN)。
- 掠食者在生物防治劑市場佔據主導地位,約佔 2022 年市場價值的 83.8%。捕食者部分在整個生物防治劑市場中佔據主導地位,主要是因為它能夠攻擊害蟲的不同生命階段,甚至不同害蟲種類。與其他生物防治劑相比,掠食者是貪婪的。
- 使用以大腸桿菌和微生物為基礎的生物防治劑可以減少對化學農藥的需求,直接降低種植的整體成本。
美國生物防治劑市場趨勢
由於國家法規的實施,有機種植面積增加,尤其是連作作物。
- 2021年,美國有機農業面積為62.3萬公頃。過去二十年來,美國的有機農業取得了顯著成長,這主要歸功於具體法律法規的實施。 2021年加州有機農場和牧場數量為3061個,是美國獲得認證的有機農場最多的州。賓州有超過 1,125 個經過認證的有機農場。 2019 年,有近 15,548,000 個經過認證的有機農場運作作物,有 7,139,000 個農場經營牧場和草場。包括苗圃和溫室在內的作物銷售額達到近 58 億美元。
- 該國的有機農業以種植作物為主。 2021年,其占有機農地總面積的約71.8%。穀類生產是該國農業的主要支柱。主要穀物有玉米、小麥、稻米、小米等。有機產品的消費在美國消費者中越來越流行,他們擴大選擇有機食品,因為它們具有多種健康益處。
- 有機園藝作物的總種植面積正在增加,從 2017 年的 112,900 公頃增加到 2021 年的 156,100 公頃。就 2021 年國內產量而言,前五的水果和蔬菜是蘋果(31.1%)、草莓(9.5%)、橘子(6.9%)、羅馬生菜(6.7%)和馬鈴薯(6.2%)。在貿易方面,進口量最大的產品是香蕉(53.1%)、酪梨(7.7%)、芒果(5.8%)、藍莓(5.0%)和南瓜(4.3%),出口量最大的產品是蘋果(80.0%)、梨子(14.4%)、櫻桃(4.0%)、洋蔥乾(1.5%)。
對有機農產品的需求不斷增加,尤其是在水果和蔬菜領域,人均有機食品支出也在增加
- 美國是世界最大的有機產品消費國。根據《營養商業日誌》(NBJ,2021)報道,截至 2020 年,該國有機食品總銷售額達 516 億美元。美國是北美地區人均有機產品支出最高的國家,2021年為186.7美元。
- 自有機食品零售業誕生以來,有機新鮮水果和蔬菜一直是主導的有機食品類別。 2020年,這些有機產品的零售額達到200億美元,顯示對有機農產品的需求不斷成長。過去二十年來,對有機新鮮水果和蔬菜的需求穩定成長。有機食品銷售的成長是由於消費者意識的增強,尤其是高所得族群。需求量最大的有機食品類別包括雞蛋、乳製品、水果和蔬菜等主食。
- 不同人群和地區的人們對有機食品的偏好各不相同。 18-29 歲的年輕人比 65 歲以上的老年人更有可能想要有機產品(超過 50%)。收入和地區也起著一定的作用,42% 的收入低於 30,000 美元的人想要有機產品,而 49% 的收入超過 75,000 美元的人想要有機產品。
- 該國有機產品的人均支出正在增加,2017-2021 年期間的複合年成長率為 5.2%。有機產品需求的不斷成長為美國有機生產商創造了進入國內和國際高價值市場的機會。有機產品的價格溢價是低收入消費者消費有機食品的主要限制因素之一。
美國生物防治劑產業概況
美國生物防治劑市場細分,前五大公司佔28.07%。市場的主要企業包括 Arizona Biological Control Inc.、Beneficial Insectary Inc.、Biobee Ltd、Bioline AgroSciences Ltd、Koppert Biological Systems Inc. 等。
其他福利
- Excel 格式的市場預測 (ME) 表
- 3個月的分析師支持
目錄
第1章執行摘要和主要發現
第2章 報告要約
第3章 引言
- 研究假設和市場定義
- 研究範圍
- 調查方法
第4章 產業主要趨勢
- 有機種植區
- 有機產品人均支出
- 法律規範
- 美國
- 價值鍊和通路分析
第5章市場區隔
- 形式
- 大型微生物
- 按生物體
- 昆蟲病原線蟲
- 寄生蟲
- 鐵血戰士
- 微生物
- 按生物體
- 細菌生物防治劑
- 真菌生物防治劑
- 其他微生物
- 大型微生物
- 作物類型
- 經濟作物
- 園藝作物
- 耕地作物
第6章競爭格局
- 重大策略舉措
- 市場佔有率分析
- 商業狀況
- 公司簡介
- Andermatt Group AG
- Arizona Biological Control Inc.
- Beneficial Insectary Inc.
- Biobee Ltd
- Bioline AgroSciences Ltd
- Bioworks Inc.
- Koppert Biological Systems Inc.
第7章:CEO面臨的關鍵策略問題
第 8 章 附錄
- 世界概況
- 概述
- 五力分析框架
- 全球價值鏈分析
- 市場動態(DRO)
- 資訊來源及延伸閱讀
- 圖片列表
- 關鍵見解
- 數據包
- 詞彙表
The United States Biocontrol Agents Market size is estimated at 43.49 million USD in 2025, and is expected to reach 67.1 million USD by 2030, growing at a CAGR of 9.06% during the forecast period (2025-2030).
- Biocontrol agents are the second most consumed in the agricultural biologicals market in the United States. They accounted for a share of 2.6% in the crop protection segment in 2022.
- Microbials-based biocontrol agents are most consumed in the biocontrol agents market in the United States, and they accounted for a share of 89.1% in 2022. Bacteria, fungi, viruses, and protozoans are some of these microbes. In three different ways, microbes function as biocontrol agents: either they inject pests with diseases, outcompete them, or even kill them.
- The fungi biocontrol agents segment of the market accounted for about 62.7% of the total microbial biocontrol agents market by value in 2022. The market value for fungal biocontrol agents increased by about 44.4% from 2017 to 2022, which can be attributed to farmers' increased awareness of integrated pest management and sustainable agriculture.
- Macrobials-based biocontrol agents accounted for a share of 10.9% in the United States in 2022. Macrobials are natural enemies of pests and are known as invertebrate biocontrol agents. They include mites, insect predators, parasitoids, and entomopathogenic nematodes (EPNs).
- Predators dominated the biocontrol agents market, and they accounted for about 83.8% of the market value in 2022. The dominance of the predators' segment in the overall biocontrol agents market is mainly due to their ability to attack different life stages of pests and even different pest species. They are voracious feeders compared to other biocontrol agents.
- Using macrobials-based and microbials-based biocontrol agents can reduce the need for chemical pesticides, directly reducing the overall cost of cultivation.
United States Biocontrol Agents Market Trends
Increase in organic area, particularly in row crops, due to country's laws and regulations
- In 2021, the area under organic agricultural farming in the United States was 623 thousand hectares. Organic agriculture in the United States has increased significantly in the previous 20 years, mostly due to the introduction of particular laws and regulations. The number of organic farms and ranches in California was 3,061 in 2021, the largest number of certified organic farms in the United States. There were over 1,125 certified organic farms in Pennsylvania. Nearly 15,548 thousand certified organic farms in operation used cropland in 2019, while 7,139 thousand farms operated pastureland and rangeland. The sales value of crops, including those from nurseries and greenhouses, amounted to nearly USD 5.8 billion.
- Row crops dominated organic farming in the nation. In 2021, they accounted for about 71.8% of all organic cropland. The production of cereal crops predominates the country's agricultural sector. The main cereals include maize, wheat, rice, and millet. The consumption of organic products has become popular among US consumers who increasingly choose to eat organic foods because of their various health benefits.
- There is an increasing trend in the overall organic horticultural crop cultivation area, from 112.9 thousand hectares in 2017 to 156.1 thousand hectares in 2021. Regarding domestic production in 2021, the top five fruits and vegetables were apples (31.1%), strawberries (9.5%), oranges (6.9%), romaine lettuce (6.7%), and potatoes (6.2%). In the case of trade, the most imported produce was bananas (53.1%), avocados (7.7%), mangoes (5.8%), blueberries (5.0%), and squashes (4.3%), while the most exported were apples (80.0%), pears (14.4%), cherries (4.0%), dried onions (1.5%), and potatoes (0.2%).
Growing demand for organic produce especially in the fruits and vegetables sector, rise in per capita spending on organic food
- The United States is one of the largest organic product consumers in the world. As of 2020, the total sales of organic food products in the country accounted for USD 51.6 billion, according to the Nutrition Business Journal (NBJ, 2021). The United States had the largest per capita spending on organic products in the North American region, worth USD 186.7 in 2021.
- Organic fresh fruits and vegetables have been the leading category of organic food since the establishment of the organic food retail industry. In 2020, retail sales for these organic products were valued at USD 20.0 billion, showing a growing demand for organic produce. The demand for organic fresh fruits and vegetables has steadily risen over the past two decades. Organic food sales are rising due to growing consumer awareness, especially among high-income consumers. The most in-demand organic categories include basic foods like eggs, dairy, fruits, and vegetables.
- Organic food preferences vary by demographic and region. Younger people aged between 18 and 29 are more likely to seek organic products (over 50%) compared to older people aged 65 and above. Income and region also play a role, with 42% of those with under USD 30,000 income and 49% of those with over USD 75.0 thousand seeking organic products.
- The per capita spending on organic products is increasing in the country, recording a CAGR of 5.2% between 2017 and 2021. The growing demand for organic products is creating opportunities for US organic producers to tap into high-value markets both domestically and abroad. The price premium associated with organic products is one of the major limiting factors for organic food consumption for low-income consumers.
United States Biocontrol Agents Industry Overview
The United States Biocontrol Agents Market is fragmented, with the top five companies occupying 28.07%. The major players in this market are Arizona Biological Control Inc., Beneficial Insectary Inc., Biobee Ltd, Bioline AgroSciences Ltd and Koppert Biological Systems Inc. (sorted alphabetically).
Additional Benefits:
- The market estimate (ME) sheet in Excel format
- 3 months of analyst support
TABLE OF CONTENTS
1 EXECUTIVE SUMMARY & KEY FINDINGS
2 REPORT OFFERS
3 INTRODUCTION
- 3.1 Study Assumptions & Market Definition
- 3.2 Scope of the Study
- 3.3 Research Methodology
4 KEY INDUSTRY TRENDS
- 4.1 Area Under Organic Cultivation
- 4.2 Per Capita Spending On Organic Products
- 4.3 Regulatory Framework
- 4.3.1 United States
- 4.4 Value Chain & Distribution Channel Analysis
5 MARKET SEGMENTATION (includes market size in Value in USD and Volume, Forecasts up to 2030 and analysis of growth prospects)
- 5.1 Form
- 5.1.1 Macrobials
- 5.1.1.1 By Organism
- 5.1.1.1.1 Entamopathogenic Nematodes
- 5.1.1.1.2 Parasitoids
- 5.1.1.1.3 Predators
- 5.1.2 Microbials
- 5.1.2.1 By Organism
- 5.1.2.1.1 Bacterial Biocontrol Agents
- 5.1.2.1.2 Fungal Biocontrol Agents
- 5.1.2.1.3 Other Microbials
- 5.1.1 Macrobials
- 5.2 Crop Type
- 5.2.1 Cash Crops
- 5.2.2 Horticultural Crops
- 5.2.3 Row Crops
6 COMPETITIVE LANDSCAPE
- 6.1 Key Strategic Moves
- 6.2 Market Share Analysis
- 6.3 Company Landscape
- 6.4 Company Profiles (includes Global Level Overview, Market Level Overview, Core Business Segments, Financials, Headcount, Key Information, Market Rank, Market Share, Products and Services, and Analysis of Recent Developments).
- 6.4.1 Andermatt Group AG
- 6.4.2 Arizona Biological Control Inc.
- 6.4.3 Beneficial Insectary Inc.
- 6.4.4 Biobee Ltd
- 6.4.5 Bioline AgroSciences Ltd
- 6.4.6 Bioworks Inc.
- 6.4.7 Koppert Biological Systems Inc.
7 KEY STRATEGIC QUESTIONS FOR AGRICULTURAL BIOLOGICALS CEOS
8 APPENDIX
- 8.1 Global Overview
- 8.1.1 Overview
- 8.1.2 Porter's Five Forces Framework
- 8.1.3 Global Value Chain Analysis
- 8.1.4 Market Dynamics (DROs)
- 8.2 Sources & References
- 8.3 List of Tables & Figures
- 8.4 Primary Insights
- 8.5 Data Pack
- 8.6 Glossary of Terms
 生物防治劑市場-2026-2031年預測
 全球生物防治劑市場
 生物防治劑市場機會、成長動力、產業趨勢分析及 2025 - 2034 年預測
 生物防治劑市場按類型、施用方法、劑型、作物類型、施用方式及地區分類
 中國生物防治劑市場:佔有率分析、產業趨勢與統計、成長預測(2025-2030)亞太地區生物防治劑:市場佔有率分析、產業趨勢與統計、成長預測(2025-2030 年)北美生物防治劑:市場佔有率分析、產業趨勢、統計數據、成長預測(2025-2030 年)印度生物防治劑:市場佔有率分析、產業趨勢與統計、成長預測(2025-2030)歐洲生物防治劑:市場佔有率分析、產業趨勢與統計、成長預測(2025-2030)
 生物防治劑市場:2033年市場分析與預測 - 依類型、產品、應用、技術、最終用戶、形式、組件、模式、階段和服務