


 |
市場調查報告書
商品編碼
1693522
尿素-市場佔有率分析、產業趨勢與統計、成長預測(2025-2030)Urea - Market Share Analysis, Industry Trends & Statistics, Growth Forecasts (2025 - 2030) |
||||||
價格
※ 本網頁內容可能與最新版本有所差異。詳細情況請與我們聯繫。
簡介目錄
預計 2025 年尿素市場規模為 769.5 億美元,到 2030 年將達到 1,078 億美元,預測期內(2025-2030 年)的複合年成長率為 6.98%。
北美擁有大面積的草坪和觀賞植物,佔據市場主導地位
- 平均而言,田間作物比其他作物需要更多的氮。田間作物種植是世界農業的主導,佔世界農業用地總面積的95.0%以上。水稻、小麥和玉米是世界上最重要的田間作物,約佔農業用地總面積的38.0%。田間作物在全球尿素市場中佔據主導地位,約佔市場價值的 79.3%,到 2022 年將達到約 601 億美元。在加拿大等國家,32% 的田間作物種植者在種植田間作物時使用尿素肥料。
- 園藝作物約佔尿素肥料市場總量的 19.6%,到 2022 年將達到約 148 億美元。全球對水果和蔬菜的需求增加,尤其是在疫情之後。亞太地區在園藝作物尿素肥料市場佔據主導地位,這主要是因為該地區廣泛種植園藝作物。
- 北美佔據草坪和觀賞作物尿素肥料市場的主導地位。草坪和觀賞作物將佔整個市場的約 54.5%,到 2022 年將達到約 4.551 億美元。眾多高爾夫球場、運動俱樂部和私人草坪區的存在有助於該領域在佔有率方面的壟斷。例如,草地覆蓋了美國約 1500 萬公頃的土地,其中包括所有的體育場、草坪和公園。
- 對於田間作物和園藝作物,由於農田面積充足,預計亞太地區將出現強勁成長。北美和歐洲的草坪和觀賞植物市場正在成長。
耕地面積的擴大和土壤中氮使用量的減少正在推動市場成長
- 2022年全球尿素肥料市場價值為757.7億美元,消費量為1.403億噸。預計2023年至2030年的複合年成長率為6.6%。隨著人口增加,各地農產品市場不斷發展,消費量增加,市場拉動。
- 依國家分類,印度和中國到2022年將分別佔亞太地區尿素肥料市場的32.8%和28.3%。消費量的成長主要受尿素作為直接施用肥料的需求所驅動,佔這些國家尿素總消費量的90%以上。因此,預計這些地區的尿素市場將在 2023-2030 年期間顯著成長。
- 北美佔全球尿素市場總量的11.6%。 2022 年尿素消費量將達 2,090 萬噸,高於 2017 年的 1,770 萬噸。耕地面積的增加導致尿素消費量增加,耕地面積將從 2017 年的 2.28 億公頃增加到 2022 年的 2.321 億公頃。這一趨勢是由於增加化肥使用量以提高可用土地面積上的作物產量和生產率。
- 基於上述因素以及提高生產力以滿足不斷成長的人口的需求,預計尿素需求將會增加,從而在 2023-2030 年期間顯著推動市場發展,預計複合年成長率為 3.3%。
全球尿素市場趨勢
為滿足日益成長的糧食需求,農業面臨的壓力日益增大,預計將導致田間作物種植面積增加
- 全球農業部門面臨許多挑戰。根據聯合國預測,到 2050 年,世界人口可能超過 90 億。人口成長可能對農業造成過度壓力,而由於勞動力短缺和都市化進程加劇導致農地面積減少,農業產量已經下降。根據聯合國糧食及農業組織預測,2050年,全球70%的人口預計將居住在城市。隨著全球可耕地面積減少,農民需要使用更多的肥料來提高作物產量。
- 亞太地區是世界上最大的農產品生產地區。農業對該地區的經濟至關重要,約佔總勞動力的 20%。該地區以田間作物種植為主,約佔全部區域作物總面積的95%以上。水稻、小麥和玉米是該地區的主要田間作物,約佔2022年總耕地面積的24.3%。
- 北美洲是世界上第二大可耕地。該農場種植多種作物,主要為田間作物。尤其是玉米、棉花、稻米、大豆和小麥,都是美國農業部強調的主要田間作物。 2022年,美國佔北美作物種植面積的46.2%。然而,2017年至2019年期間,該國作物種植面積大幅下降,主要原因是惡劣天氣導致德克薩斯和休士頓等地區發生嚴重洪災。
氮是田間作物使用最廣泛的主要養分,佔總消費量%。
- 玉米、油菜籽、棉花、高粱、稻米、小麥和大豆是全球主要的營養消耗作物。這些田間作物的主要養分施用量分別為 230.57 公斤/公頃、255.75 公斤/公頃、172.70 公斤/公頃、158.46 公斤/公頃、154.49 公斤/公頃、135.35 公斤/公頃和 120.97 公斤/公頃。主要營養素對作物非常重要,因為它們在植物的代謝過程中發揮著至關重要的作用,並有助於細胞、細胞膜和葉綠素等組織的形成。磷對於種植優質作物至關重要,而鉀可以激活植物生長發育所必需的酵素。
- 全球田間作物氮、鉀、磷的平均施用量為164.31公斤/公頃。氮肥是田間作物使用最廣泛的大量營養肥料,2022 年施用量為 224.6 公斤/公頃,其次是鉀肥,為 150.3 公斤/公頃,磷肥為 117.9 公斤/公頃。
- 2022年,氮肥施用量最高的是油菜籽,為347.4公斤/公頃。同樣,磷施用量最高的是玉米,為156.3公斤/公頃,鉀施用量最高的是油菜,為248.6公斤/公頃。
- 全球田間作物種植面積正在增加,尤其是在南美洲和亞太地區。這些都是肥料的潛在成長市場。由於其高效性,專用肥料在歐洲和北美等已開發地區以及營養缺乏現象普遍的地區已廣泛應用。預計這些因素將在 2023 年至 2030 年期間推動主要營養肥料市場的發展。
尿素產業概況
尿素市場分散,前五大企業佔20.78%的市佔率。該市場的主要企業包括 CF Industries Holdings, Inc.、Nutrien Ltd.、OCI NV、SABIC Agri-Nutrients Co.、Yara International ASA 等。
其他福利
- Excel 格式的市場預測 (ME) 表
- 3個月的分析師支持
目錄
第1章執行摘要和主要發現
第2章 報告要約
第3章 引言
- 研究假設和市場定義
- 研究範圍
- 調查方法
第4章 產業主要趨勢
- 主要作物種植面積
- 田間作物
- 園藝作物
- 平均養分施用量
- 主要營養素
- 田間作物
- 園藝作物
- 主要營養素
- 灌溉農田
- 法律規範
- 價值鍊和通路分析
第5章市場區隔
- 特殊類型
- CRF
- 聚合物塗層
- 聚合硫塗層
- 其他
- 液體肥料
- SRF
- 水溶性
- CRF
- 作物類型
- 田間作物
- 園藝作物
- 草坪和觀賞植物
- 形式
- 實踐
- 特色作物
- 地區
- 亞太地區
- 澳洲
- 孟加拉
- 中國
- 印度
- 印尼
- 日本
- 巴基斯坦
- 菲律賓
- 泰國
- 越南
- 其他亞太地區
- 歐洲
- 法國
- 德國
- 義大利
- 荷蘭
- 俄羅斯
- 西班牙
- 烏克蘭
- 英國
- 其他歐洲國家
- 中東和非洲
- 奈及利亞
- 沙烏地阿拉伯
- 南非
- 土耳其
- 其他中東和非洲地區
- 北美洲
- 加拿大
- 墨西哥
- 美國
- 北美其他地區
- 南美洲
- 阿根廷
- 巴西
- 南美洲其他地區
- 亞太地區
第6章 競爭格局
- 關鍵策略趨勢
- 市場佔有率分析
- 商業狀況
- 公司簡介
- CF Industries Holdings, Inc.
- Coromandel International Ltd.
- EuroChem Group
- Indian Farmers Fertiliser Cooperative Limited
- Koch Industries Inc.
- Nutrien Ltd.
- OCI NV
- SABIC Agri-Nutrients Co.
- Yara International ASA
第7章 CEO 的關鍵策略問題
第 8 章 附錄
- 世界概況
- 概述
- 五力分析框架
- 全球價值鏈分析
- 市場動態(DRO)
- 資訊來源及延伸閱讀
- 圖片列表
- 關鍵見解
- 數據包
- 詞彙表
簡介目錄
Product Code: 92586
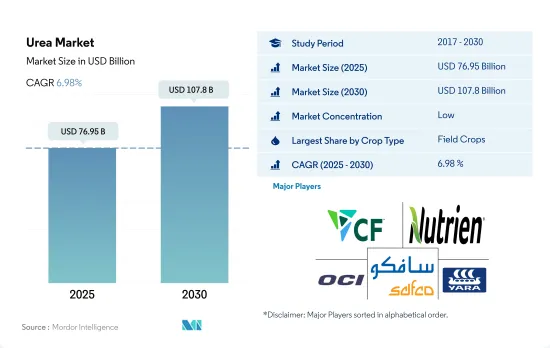
The Urea Market size is estimated at 76.95 billion USD in 2025, and is expected to reach 107.8 billion USD by 2030, growing at a CAGR of 6.98% during the forecast period (2025-2030).
Due to higher areas under turf and ornamentals, North America dominating the market
- Field crops, on average, require more nitrogen than other crop types. Field crop cultivation dominates the global agricultural landscape, accounting for more than 95.0% of all agricultural land. Rice, wheat, and corn are the world's most important field crops, accounting for about 38.0% of total agricultural land. Field crops dominate the global urea market, accounting for about 79.3% of the market value, amounting to around USD 60.1 billion in 2022. In countries like Canada, 32% of the field crop growers use urea fertilizers in their field crop cultivation.
- Horticultural crops accounted for about 19.6% of the total market value of urea fertilizers, amounting to around USD 14.8 billion in 2022. There is an increasing demand for fruits and vegetables around the world, particularly after the pandemic. Asia-Pacific dominates the urea fertilizer market for horticultural crops, primarily due to the extensive cultivation of horticultural crops in the region.
- North America dominates the urea fertilizer market in turf and ornamental crops. Turf and ornamental crops accounted for about 54.5% of the total market value, amounting to around USD 455.1 million in 2022. The presence of a large number of golf courses, sports clubs, and private lawn areas contributes to the region's dominance by share. Turf grass, for example, covers about 15.0 million hectares of land in the United States, which includes all stadiums, lawns, and parks.
- In terms of field and horticultural crops, Asia-Pacific is anticipated to grow at a faster rate due to the large availability of agricultural land. The turf and the ornamental segment is growing in the North American and European regions.
Growing area under cultivation and reducing nitrogen use levels in the soils drives the market growth
- The global urea fertilizers market was valued at USD 75.77 billion in the year 2022, recording a volume consumption of 140.3 million metric tons. It is estimated to register a CAGR of 6.6% during 2023-2030. With the increase in population, developments in the agriculture industries are taking place regionally, increasing consumption and thereby driving the market.
- By country, India and China accounted for 32.8% and 28.3% of the Asia-Pacific Urea fertilizer market in 2022. Consumption growth is mainly driven by the demand for urea as a direct application fertilizer, accounting for more than 90% of the total urea consumption in these countries. Hence, the urea market in these regions is anticipated to grow significantly during 2023-2030.
- North America accounted for 11.6% of the total global urea market. The consumption of urea in 2022 was 20.9 million metric tons, which increased from 17.7 million metric tons in 2017. The increase in the area under cultivation resulted in an increase in the consumption of urea, and the cultivation increased from 228.0 million hectares in 2017 to 232.1 million hectares in 2022. This trend was observed due to the higher usage of fertilizers to increase the yield and productivity of the crop in the available land area.
- Based on the aforementioned factors and the need for enhanced productivity to feed the increasing population, the demand for urea is expected to increase, thereby boosting the market significantly during 2023-2030 with an anticipated volume CAGR of 3.3%.
Global Urea Market Trends
The rising pressure on the agriculture industry to meet the growing demand for food is expected to increase the area under field crop cultivation
- The global agricultural sector is facing many challenges. According to the UN, the world population may exceed 9 billion by 2050. This population growth may overburden the agricultural industry, which is already experiencing an output loss due to a lack of laborers and the shrinkage of agricultural fields caused by rising urbanization. According to the Food and Agriculture Organization, 70% of the global population is expected to live in cities by 2050. Due to the global loss of arable land, farmers now need to utilize more fertilizers to increase crop yields.
- Asia-Pacific is the world's largest producer of agricultural products. Agriculture is critical to the region's economy, as it employs about 20% of the total available workforce. Field crop cultivation dominates the region, accounting for about more than 95% of the total crop area in the region. Rice, wheat, and corn are the major field crops produced in the region, together accounting for about 24.3% of the total crop area in 2022.
- North America ranks as the second-largest arable region globally. Its farms cultivate a diverse range of crops, with a focus on field crops. Notably, corn, cotton, rice, soybean, and wheat are the prominent field crops, as highlighted by the USDA. In 2022, the United States commanded 46.2% of North America's crop cultivation area. However, the country witnessed a significant drop in crop acreage between 2017 and 2019, primarily due to adverse environmental conditions, leading to severe flooding in regions like Texas and Houston.
Nitrogen is the most widely used primary nutrient fertilizer in field crops, accounting for 45.5% of the total consumption
- Corn/maize, rapeseed/canola, cotton, sorghum, rice, wheat, and soybean are some of the major primary nutrient-consuming crops worldwide. The primary nutrient application rates of these field crops were 230.57 kg/ha, 255.75 kg/ha, 172.70 kg/ha, 158.46 kg/ha, 154.49 kg/ha, 135.35 kg/ha, and 120.97 kg/ha, respectively. Primary nutrient fertilizers are highly crucial for crops because they play an essential role in plant metabolic processes and assist in forming tissues such as cells, cell membranes, and chlorophyll. Phosphorus is essential for growing high-quality crops; potassium activates the enzymes needed for plant growth and development.
- The global average application rate of nitrogen, potassium, and phosphorus in field crops is 164.31 kg/ha. Nitrogen is the most widely used primary nutrient fertilizer in field crops, accounting for an application rate of 224.6 kg/hectare, followed by potassic fertilizers with 150.3 kg/hectare and phosphorus with 117.9 kg/hectare in 2022.
- In 2022, the nitrogen application rate was highest in rapeseed, which was 347.4 kg/hectare. Similarly, the phosphorus application rate was highest in corn, which was 156.3 kg/hectare, and the potassium application rate was highest in canola, which was 248.6 kg/hectare.
- Global field crop cultivation area is increasing, particularly in South America and Asia-Pacific. These are the potential growing markets for fertilizers. Due to their efficiency, specialty fertilizers are widely used in developed regions such as Europe, North America, and other regions with widespread nutrient deficiencies. These factors are anticipated to drive the primary nutrient fertilizers market during 2023-2030.
Urea Industry Overview
The Urea Market is fragmented, with the top five companies occupying 20.78%. The major players in this market are CF Industries Holdings, Inc., Nutrien Ltd., OCI NV, SABIC Agri-Nutrients Co. and Yara International ASA (sorted alphabetically).
Additional Benefits:
- The market estimate (ME) sheet in Excel format
- 3 months of analyst support
TABLE OF CONTENTS
1 EXECUTIVE SUMMARY & KEY FINDINGS
2 REPORT OFFERS
3 INTRODUCTION
- 3.1 Study Assumptions & Market Definition
- 3.2 Scope of the Study
- 3.3 Research Methodology
4 KEY INDUSTRY TRENDS
- 4.1 Acreage Of Major Crop Types
- 4.1.1 Field Crops
- 4.1.2 Horticultural Crops
- 4.2 Average Nutrient Application Rates
- 4.2.1 Primary Nutrients
- 4.2.1.1 Field Crops
- 4.2.1.2 Horticultural Crops
- 4.2.1 Primary Nutrients
- 4.3 Agricultural Land Equipped For Irrigation
- 4.4 Regulatory Framework
- 4.5 Value Chain & Distribution Channel Analysis
5 MARKET SEGMENTATION (includes market size in Value in USD and Volume, Forecasts up to 2030 and analysis of growth prospects)
- 5.1 Speciality Type
- 5.1.1 CRF
- 5.1.1.1 Polymer Coated
- 5.1.1.2 Polymer-Sulfur Coated
- 5.1.1.3 Others
- 5.1.2 Liquid Fertilizer
- 5.1.3 SRF
- 5.1.4 Water Soluble
- 5.1.1 CRF
- 5.2 Crop Type
- 5.2.1 Field Crops
- 5.2.2 Horticultural Crops
- 5.2.3 Turf & Ornamental
- 5.3 Form
- 5.3.1 Conventional
- 5.3.2 Speciality
- 5.4 Region
- 5.4.1 Asia-Pacific
- 5.4.1.1 Australia
- 5.4.1.2 Bangladesh
- 5.4.1.3 China
- 5.4.1.4 India
- 5.4.1.5 Indonesia
- 5.4.1.6 Japan
- 5.4.1.7 Pakistan
- 5.4.1.8 Philippines
- 5.4.1.9 Thailand
- 5.4.1.10 Vietnam
- 5.4.1.11 Rest of Asia-Pacific
- 5.4.2 Europe
- 5.4.2.1 France
- 5.4.2.2 Germany
- 5.4.2.3 Italy
- 5.4.2.4 Netherlands
- 5.4.2.5 Russia
- 5.4.2.6 Spain
- 5.4.2.7 Ukraine
- 5.4.2.8 United Kingdom
- 5.4.2.9 Rest of Europe
- 5.4.3 Middle East & Africa
- 5.4.3.1 Nigeria
- 5.4.3.2 Saudi Arabia
- 5.4.3.3 South Africa
- 5.4.3.4 Turkey
- 5.4.3.5 Rest of Middle East & Africa
- 5.4.4 North America
- 5.4.4.1 Canada
- 5.4.4.2 Mexico
- 5.4.4.3 United States
- 5.4.4.4 Rest of North America
- 5.4.5 South America
- 5.4.5.1 Argentina
- 5.4.5.2 Brazil
- 5.4.5.3 Rest of South America
- 5.4.1 Asia-Pacific
6 COMPETITIVE LANDSCAPE
- 6.1 Key Strategic Moves
- 6.2 Market Share Analysis
- 6.3 Company Landscape
- 6.4 Company Profiles
- 6.4.1 CF Industries Holdings, Inc.
- 6.4.2 Coromandel International Ltd.
- 6.4.3 EuroChem Group
- 6.4.4 Indian Farmers Fertiliser Cooperative Limited
- 6.4.5 Koch Industries Inc.
- 6.4.6 Nutrien Ltd.
- 6.4.7 OCI NV
- 6.4.8 SABIC Agri-Nutrients Co.
- 6.4.9 Yara International ASA
7 KEY STRATEGIC QUESTIONS FOR FERTILIZER CEOS
8 APPENDIX
- 8.1 Global Overview
- 8.1.1 Overview
- 8.1.2 Porter's Five Forces Framework
- 8.1.3 Global Value Chain Analysis
- 8.1.4 Market Dynamics (DROs)
- 8.2 Sources & References
- 8.3 List of Tables & Figures
- 8.4 Primary Insights
- 8.5 Data Pack
- 8.6 Glossary of Terms
02-2729-4219
+886-2-2729-4219
 尿素市場按形態、等級、純度、分銷管道(間接和直接)和地區分類
 尿素市場依最終用途、形態、應用、等級、通路、生產流程和純度分類-2025-2032年全球預測
 全球奈米脲市場
 2025 年至 2033 年尿素市場規模、佔有率、趨勢及預測(依等級、應用、最終用途產業及地區)
 2025年尿素全球市場報告
 奈米尿素的印度市場:作物類別,各地區,機會,預測,2019年~2033年全球顆粒尿素市場2025-2033年日本尿素市場報告(依等級、應用、最終用途產業及地區)顆粒尿素市場:按應用、產品類型和地區分類2032 年尿素市場預測:按產品類型、等級、作物類型、特種類型、技術、應用、最終用戶和地區進行的全球分析
▼