


 |
市場調查報告書
商品編碼
1693501
美國特種肥料:市場佔有率分析、產業趨勢和成長預測(2025-2030 年)United States Specialty Fertilizer - Market Share Analysis, Industry Trends & Statistics, Growth Forecasts (2025 - 2030) |
||||||
※ 本網頁內容可能與最新版本有所差異。詳細情況請與我們聯繫。
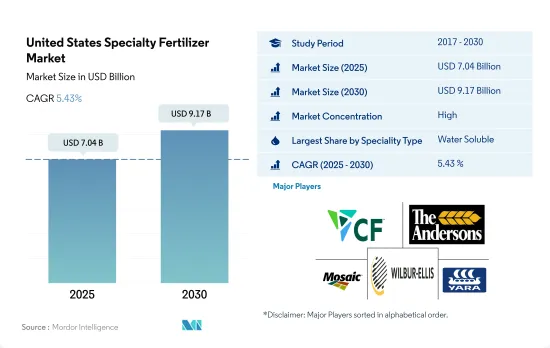
預計 2025 年美國特種肥料市場規模將達到 70.4 億美元,到 2030 年將達到 91.7 億美元,預測期內(2025-2030 年)的複合年成長率為 5.43%。
永續灌溉方式的採用率不斷提高,特色產品數量激增
- 2018年至2022年,美國特種肥料市場將實現2.5%的銷售成長,這得益於不同作物類型的潛力和市場機會的不斷擴大。
- 到 2022 年,水溶性肥料將佔據最大的市場佔有率,為 48.0%,其次是液體肥料,為 46.3%,控制釋放肥料 (CRF) 為 5.1%。相較之下,緩釋肥料的佔有率僅為0.6%,主要原因是其在小麥、玉米和其他穀物等主要作物中的應用有限。
- 水溶性肥料的需求源自於其多樣化的營養等級和多種施用方法,包括葉面噴布、施肥和土壤施用。尤其是水溶性肥料,在報告期間內銷售成長了1.9%。
- 研究期間,美國液體肥料市場顯著成長了 2.0%。這種成長歸因於精密農業的日益普及、施肥的便利性以及貨車的可用性等因素。此外,微灌溉系統在該國正在擴大,預計這將進一步推動該領域的成長。
- 2017年,全國灌溉農地面積5,800萬英畝。透過發達的微灌系統均勻分佈可溶性肥料,增加了養分的利用率,從而提高了養分供應效率。
- 美國特種肥料市場預計將以 5.2% 的複合年成長率成長,並預計在 2023 年至 2030 年間獲得發展動力。推動這一成長的因素包括政府對遏制傳統肥料對環境影響的興趣日益濃厚,以及技術和科學的快速進步。
美國特種肥料市場趨勢
大豆和玉米是美國種植面積最大的兩種作物。
- 美國人口將緩慢成長,從2020年的3.359億增加到2022年的3.382億。過去20年,美國耕地面積減少了近5,000萬英畝,到2022年將穩定在8.934億英畝。由於耕地面積的減少,迫切需要提高農業生產力。人們長期以來一直使用肥料來提高作物產量。 2022年,玉米、棉花、大豆和小麥四大主要作物將占美國主要作物面積的65.7%。
- 大豆和玉米將成為美國的主要作物,其中大豆將佔據首位,到2022年將占美國耕地面積的25.8%,緊隨其後的是玉米,佔25.7%,小麥佔11.1%。這些作物主要生長在“玉米帶”,包括印第安納州、伊利諾伊州、愛荷華州、密蘇裡州、內布拉斯加州和堪薩斯州的部分地區。該地區主要產玉米和大豆。此外,根據美國農業部的數據,美國已成為重要的稻米出口國,其種植集中在南部的三個地區和加州的一個地區。
- 農業用品製造商正積極創新,幫助農民精準施肥。這不僅降低了種植成本,而且提高了效率。美國大田作物市場潛力巨大,預計未來幾年將因政府資金和支持的激增而強勁成長。
氮缺乏是美國作物最普遍的營養問題之一。
- 全國田間作物主要養分(氮、鉀、磷)平均施用量約為每公頃166.61公斤。氮為45.93%,鉀為28.11%,磷為25.96%。
- 田間作物中,油菜籽/油菜籽的平均一次養分施用量為284.92公斤/公頃,為田間作物中最高。在主要養分中,氮肥施用量最高,平均施用量為 229.60 公斤/公頃。這是因為植物的新陳代謝需要大量的氮,而氮是葉綠素和胺基酸的主要成分。
- 玉米產量排名第二,其次是油菜籽,平均每公頃產量為 245.40 公斤。玉米約占美國田間作物總產量的31.44%。玉米平均需氮量為50.06%,磷量為23.77%,鉀量為26.17%。
- 基本營養素是植物生長所必需的,可增強植物酵素的功能,改善植物細胞的生長和生化過程。主要營養素的缺乏會影響植物的健康、生長和作物產量。預計田間作物主要養分的施用量將會增加,以滿足提高生產力的需求。
美國特種肥料產業概況
美國特種肥料市場相當集中,前五大公司佔了73.24%的市場。該市場的主要企業包括 CF Industries Holdings, Inc.、The Andersons Inc.、The Mosaic Company、Wilbur-Ellis Company LLC、Yara International ASA 等。
其他福利
- Excel 格式的市場預測 (ME) 表
- 3個月的分析師支持
目錄
第1章執行摘要和主要發現
第2章 報告要約
第3章 引言
- 研究假設和市場定義
- 研究範圍
- 調查方法
第4章 產業主要趨勢
- 主要作物種植面積
- 田間作物
- 園藝作物
- 平均養分施用量
- 微量營養素
- 田間作物
- 園藝作物
- 主要營養素
- 田間作物
- 園藝作物
- 次要宏量營養素
- 田間作物
- 園藝作物
- 微量營養素
- 灌溉農田
- 法律規範
- 價值鍊和通路分析
第5章市場區隔
- 專業類型
- CRF
- 聚合物塗層
- 聚合硫塗層
- 其他
- 液體肥料
- SRF
- 水溶性
- CRF
- 施肥方式
- 受精
- 葉面噴布
- 土壤
- 作物類型
- 田間作物
- 園藝作物
- 草坪和觀賞植物
第6章 競爭格局
- 關鍵策略趨勢
- 市場佔有率分析
- 商業狀況
- 公司簡介
- CF Industries Holdings, Inc.
- Haifa Group
- ICL Group Ltd
- Koch Industries Inc.
- Nutrien Ltd.
- Sociedad Quimica y Minera de Chile SA
- The Andersons Inc.
- The Mosaic Company
- Wilbur-Ellis Company LLC
- Yara International ASA
第7章:CEO面臨的關鍵策略問題
第 8 章 附錄
- 世界概況
- 概述
- 五力分析框架
- 全球價值鏈分析
- 市場動態(DRO)
- 資訊來源及延伸閱讀
- 圖片列表
- 關鍵見解
- 數據包
- 詞彙表
The United States Specialty Fertilizer Market size is estimated at 7.04 billion USD in 2025, and is expected to reach 9.17 billion USD by 2030, growing at a CAGR of 5.43% during the forecast period (2025-2030).
The adoption of sustainable and irrigation agricultural practices is on the rise, leading to a surge in specialty adoption
- From 2018 to 2022, the specialty fertilizer market in the United States witnessed a 2.5% volume growth, propelled by its potential and expanding market opportunities across diverse crop types.
- By 2022, water-soluble fertilizers commanded a significant market share of 48.0%, followed by liquid fertilizers at 46.3% and controlled-release fertilizers (CRF) at 5.1%. In contrast, slow-release fertilizers held a modest 0.6% share, primarily due to their limited adoption in major crops like wheat, maize, and other cereals.
- The demand for water-soluble fertilizers is buoyed by their diverse nutrient grades and versatile application methods, including foliar, fertigation, and soil application. Notably, water-soluble fertilizers witnessed a 1.9% volume growth during the study period.
- The liquid fertilizers segment in the United States witnessed a notable 2.0% growth during the study period. This growth can be attributed to factors such as the rising adoption of precision farming, the ease of application, and the availability of wagons. Furthermore, the country's expanding micro-irrigation system is poised to further bolster this segment's growth.
- In 2017, the country had 58 million acres of irrigated cropland. The even distribution of water-soluble fertilizers through the developing micro-irrigation system led to heightened nutrient availability, resulting in improved nutrient supplementation efficiency.
- With a projected CAGR of 5.2%, the US specialty fertilizer market is set to gain momentum from 2023 to 2030. This growth is underpinned by a heightened governmental focus on curbing the environmental impact of conventional fertilizers and the concurrent surge in technological and scientific advancements.
United States Specialty Fertilizer Market Trends
Soybean and corn are the two largest crops grown in the United States
- The United States witnessed a modest population growth, rising from 335.9 million in 2020 to 338.2 million in the year 2022. Over the past two decades, the nation's farmland area has shrunk by nearly 50 million acres, settling at 893.4 million acres by 2022. This diminishing farmland underscores the urgency to enhance agricultural productivity through Agri inputs. Fertilizers have long been employed to bolster crop yields. In 2022, four key crops, such as corn, cotton, soybean, and wheat, collectively commanded over 65.7% of the principal crop acreage in the United States.
- Soybean and corn reign as the top crops in the United States, with soybean leading the pack in the year 2022, occupying 25.8% of the nation's arable land, followed closely by corn at 25.7%, and wheat at 11.1%. These crops predominantly thrive in the "Corn Belt," encompassing parts of Indiana, Illinois, Iowa, Missouri, Nebraska, and Kansas. Corn and soybean production dominates this region. Furthermore, the United States emerges as a significant rice exporter, with cultivation concentrated in three Southern regions and one in California, as per the United States Department of Agriculture.
- Manufacturers of farm inputs are actively innovating to aid farmers in precise fertilizer application. This not only curbs cultivation costs but also bolsters efficiency. The US field crop sector holds substantial market potential, and with a surge in government funding and support, it is poised for positive growth in the coming years.
Nitrogen deficiency is one of the most prevalent crop nutrient problems across the cropping areas in the United States
- In the field crop's average primary nutrients (Nitrogen, Potassium, and Phosphorus) application rate in the country is about 166.61 kilogram/Hectare. Nitrogen accounts for 45.93 %, Potassium accounts for 28.11 percentage, and phosphorus accounts for 25.96 percentage of total field crops' average primary nutrient application.
- In field crops, Rapeseed/Canola was applied with an average primary nutrient application rate of 284.92 kilogram/Hectare, which is the highest in field crops. In primary nutrients, Nitrogen occupies first place with an average application rate of 229.60 kilogram/Hectare. This is because Nitrogen is required in large amounts for plant metabolism and it is a major component of chlorophyll and amino acids.
- Corn/ Maize is the second largest followed by Rapeseed/ Canola with an average primary nutrient application rate of 245.40 kilogram/ Hectare. Corn accounts for about 31.44 percentage of total field crop production in the United States. The Nitrogen requirement of corn is about 50.06 percentage, phosphorus is 23.77 percentage, and Potash is 26.17 percentage of the total average primary nutrient application.
- The primary nutrients are crucial for plant growth and boost the plant enzyme function, improving plant cell growth and biochemical processes. The deficiency of primary nutrients can affect plant health, growth, and crop production output. The application of primary nutrients in field crops is anticipated to increase to meet the demand by increasing productivity.
United States Specialty Fertilizer Industry Overview
The United States Specialty Fertilizer Market is fairly consolidated, with the top five companies occupying 73.24%. The major players in this market are CF Industries Holdings, Inc., The Andersons Inc., The Mosaic Company, Wilbur-Ellis Company LLC and Yara International ASA (sorted alphabetically).
Additional Benefits:
- The market estimate (ME) sheet in Excel format
- 3 months of analyst support
TABLE OF CONTENTS
1 EXECUTIVE SUMMARY & KEY FINDINGS
2 REPORT OFFERS
3 INTRODUCTION
- 3.1 Study Assumptions & Market Definition
- 3.2 Scope of the Study
- 3.3 Research Methodology
4 KEY INDUSTRY TRENDS
- 4.1 Acreage Of Major Crop Types
- 4.1.1 Field Crops
- 4.1.2 Horticultural Crops
- 4.2 Average Nutrient Application Rates
- 4.2.1 Micronutrients
- 4.2.1.1 Field Crops
- 4.2.1.2 Horticultural Crops
- 4.2.2 Primary Nutrients
- 4.2.2.1 Field Crops
- 4.2.2.2 Horticultural Crops
- 4.2.3 Secondary Macronutrients
- 4.2.3.1 Field Crops
- 4.2.3.2 Horticultural Crops
- 4.2.1 Micronutrients
- 4.3 Agricultural Land Equipped For Irrigation
- 4.4 Regulatory Framework
- 4.5 Value Chain & Distribution Channel Analysis
5 MARKET SEGMENTATION (includes market size in Value in USD and Volume, Forecasts up to 2030 and analysis of growth prospects)
- 5.1 Speciality Type
- 5.1.1 CRF
- 5.1.1.1 Polymer Coated
- 5.1.1.2 Polymer-Sulfur Coated
- 5.1.1.3 Others
- 5.1.2 Liquid Fertilizer
- 5.1.3 SRF
- 5.1.4 Water Soluble
- 5.1.1 CRF
- 5.2 Application Mode
- 5.2.1 Fertigation
- 5.2.2 Foliar
- 5.2.3 Soil
- 5.3 Crop Type
- 5.3.1 Field Crops
- 5.3.2 Horticultural Crops
- 5.3.3 Turf & Ornamental
6 COMPETITIVE LANDSCAPE
- 6.1 Key Strategic Moves
- 6.2 Market Share Analysis
- 6.3 Company Landscape
- 6.4 Company Profiles
- 6.4.1 CF Industries Holdings, Inc.
- 6.4.2 Haifa Group
- 6.4.3 ICL Group Ltd
- 6.4.4 Koch Industries Inc.
- 6.4.5 Nutrien Ltd.
- 6.4.6 Sociedad Quimica y Minera de Chile SA
- 6.4.7 The Andersons Inc.
- 6.4.8 The Mosaic Company
- 6.4.9 Wilbur-Ellis Company LLC
- 6.4.10 Yara International ASA
7 KEY STRATEGIC QUESTIONS FOR FERTILIZER CEOS
8 APPENDIX
- 8.1 Global Overview
- 8.1.1 Overview
- 8.1.2 Porter's Five Forces Framework
- 8.1.3 Global Value Chain Analysis
- 8.1.4 Market Dynamics (DROs)
- 8.2 Sources & References
- 8.3 List of Tables & Figures
- 8.4 Primary Insights
- 8.5 Data Pack
- 8.6 Glossary of Terms
 晶體肥料市場:2026-2032年全球市場預測(依養分類型、應用、形態、作物類型、作用機制與銷售管道)特種肥料市場:2026-2032年全球市場預測(依產品形式、作物類型、養分類型、施用方法、通路和最終用途分類)
 特種肥料市場規模、佔有率和趨勢分析報告:按技術、作物、類型、應用、地區和細分市場預測(2026-2033 年)
 特種肥料:市場佔有率分析、產業趨勢與統計、成長預測(2026-2031)
 全球特種肥料市場規模、佔有率、趨勢和成長分析報告(2026-2034)
 2026年全球特種肥料市場報告
 特種肥料市場規模、佔有率和成長分析(按類型、技術、形態、作物類型、應用方法和地區分類)-2026-2033年產業預測全球特種肥料市場規模(依特種肥料類型、作物類型、施用方法、區域範圍及預測)
 特種肥料市場 - 全球產業規模、佔有率、趨勢、機會和預測,按作物類型、形式、應用方式、技術、地區和競爭細分,2020-2030 年中國特種肥料市場佔有率分析、產業趨勢與統計、成長預測(2025-2030年)