


 |
市場調查報告書
商品編碼
1692462
北美電動車電池組:市場佔有率分析、行業趨勢和統計數據、成長預測(2025-2030 年)North America EV Battery Pack - Market Share Analysis, Industry Trends & Statistics, Growth Forecasts (2025 - 2030) |
||||||
※ 本網頁內容可能與最新版本有所差異。詳細情況請與我們聯繫。
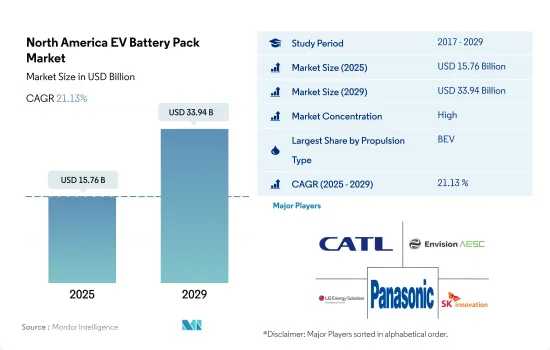
北美電動車電池組市場規模預計在 2025 年達到 157.6 億美元,預計到 2029 年將達到 339.4 億美元,預測期內(2025-2029 年)的複合年成長率為 21.13%。
電池製造廠有望推動北美電動車產業的成長
- 2017年至2023年,北美電動車產量和普及率將大幅成長。 2017年,北美生產的電動車總數約為20萬輛,到2022年將成長到40萬多輛。這種成長可以歸因於多種因素,包括政府獎勵、電池價格下降以及意識提升。最近的趨勢也顯示電動車產業的研發力度有所加大。
- 北美電動車電池組市場正在經歷強勁成長,主要受到政府補貼和獎勵計畫的推動。近年來,這些旨在推廣使用環保交通途徑的計畫已導致電動車的普及率顯著增加。例如,美國政府對購買電動車實施最高7,500美元的稅額扣抵,讓電動車更便宜,讓更多人負擔得起。
- 此外,電池製造廠的發展對於北美電動車市場的成長至關重要。目前,大多數電動車電池都在亞洲製造,主要是中國和韓國。不過,電池製造廠也計劃在北美建造,以減少對進口電池的依賴,並支持北美電動車產業的發展。根據彭博新能源財經報道,北美預計將在 2040 年前投資 3,600 億美元用於電動車基礎設施建設,以減少碳排放並向更清潔的交通方式轉型。整體而言,北美電動車和電池組的前景看好。
政府支持和投資推動美國和加拿大電動車的普及
- 近年來,北美電動車電池組市場經歷了強勁成長,美國和加拿大的電動車普及率激增。這種成長背後有幾個因素,包括政府獎勵、更嚴格的排放法規、消費者日益增強的環保意識以及充電基礎設施的進步。
- 北美各國政府正在實施政策和獎勵,鼓勵各級政府推廣電動車。這些措施包括稅額扣抵、補貼、回扣和充電基礎設施投資。這種支持增加了消費者對電動車的興趣並刺激了對電池組的需求。值得注意的是,主要汽車製造商和電池製造商正在提高該地區市場的電動車電池組的生產能力。例如,特斯拉在美國內華達州經營超級工廠,專門生產電池。通用汽車、福特和大眾等其他行業巨頭也宣布了在國內建立自己的電池生產設施的計劃。
- 電池技術的持續研發工作重點是提高能量密度、降低成本和延長電動車的續航里程。固態電池、快速充電功能和延長電池壽命等技術創新將進一步推動市場發展。此外,關鍵電池材料的可用性也是一個關鍵因素。北美擁有鋰、鎳和鈷等關鍵材料的蘊藏量,這將為未來幾年增加當地的生產和供應鏈活動創造條件。
北美電動車電池組市場趨勢
北美電動車市場的主要企業包括特斯拉、豐田、福特、現代和本田。
- 北美電動車市場主要由五大公司推動,到2023年,這五大公司將佔據70%以上的市場。這些主要企業包括特斯拉、豐田集團、福特集團、現代汽車公司和本田。特斯拉是北美最大的電動車銷售商,佔約33%的市場。該公司專注於強大的創新技術,並與各種電動車零件(例如電池)製造商建立了強大的策略夥伴關係。作為一家美國公司,我們提供優質的產品和服務,並在北美的美國和加拿大等主要國家擁有強大的基本客群。
- 豐田集團是第二大電動車銷售商,在北美的市場佔有率約為30.8%。該公司擁有強大的供應鏈和分銷網路。豐田在客戶中擁有值得信賴的品牌形象。其電動車銷量在北美國家中排名第三。福特集團收購了它,當時的市場佔有率約為9.9%。憑藉強大的品牌形象和多樣化的產品,它在北美國家擁有龐大的基本客群。
- 現代汽車位居第四,在北美電動車銷售中佔有約 5.48% 的市場佔有率。憑藉強大的生產和供應鏈網路,該公司為不同類型的客戶提供從價格實惠到高階的各種創新和多樣化產品。本田在電動車市場排名第五,市場佔有率約 5.22%。在北美銷售 EVS 的其他公司包括吉普、雪佛蘭、寶馬和沃爾沃。
美國是電動車需求最大的市場,到 2023 年將佔全部區域電池組市場的 60% 以上。
- 隨著北美幾個國家的電動車數量穩定成長,2023 年電池需求將飆升。雖然該地區銷售的還有許多其他品牌和車型,但 2023 年排名前五的車型——特斯拉 Model Y、特斯拉 Model 3、豐田 Rav 4、豐田 Sienta 和本田 CRV——佔據了相當大的市場佔有率。 2023年,特斯拉Model Y在美國銷售247,344輛,繼續維持冠軍寶座。 Model Y憑藉其長續航里程、大座位數、充足的載貨負載容量等優勢,極受歡迎。
- 特斯拉Model 3位居第二,2023年在美國銷售215,500輛。有後輪驅動和性能版本可供選擇。由於其強大的性能特性,Model 3 正在吸引客戶。在電動車銷量方面,ToyotaRav4在美國及北美地區銷量為149,938輛,排名第三。該車配備插電式混合動力技術和包括 Toyota Safety Sense 在內的多項 ADAS 功能。
- Toyota Sienta 是美國第四暢銷的電動車,銷量為 69,720 輛。該車可選配 2.5 升引擎和混合動力傳動系統。擁有大家庭並希望擁有七人座座椅的消費者對豐田 Sienna 反應良好。排名第五的是本田 CRV,2023 年美國銷量為 69,720 輛。其他暢銷車型包括豐田Highlander、吉普牧馬人、豐田凱Camry、本田雅閣和福特野馬 Mach-E。
北美電動車電池組產業概況
北美電動車電池組市場相當集中,前五大公司佔85.66%的市場。市場的主要企業有:寧德時代新能源科技(CATL)、遠景AESC日本、LG能源解決方案有限公司、松下控股公司和SK創新(按字母順序排列)。
其他福利
- Excel 格式的市場預測 (ME) 表
- 3個月的分析師支持
目錄
第1章執行摘要和主要發現
第2章 報告要約
第3章 引言
- 研究假設和市場定義
- 研究範圍
- 調查方法
第4章 產業主要趨勢
- 電動汽車銷售
- 電動車銷量(按OEM)
- 最暢銷的電動車車型
- 具有優選電池化學成分的OEM
- 電池組價格
- 電池材料成本
- 每種電池化學成分的價格表
- 誰供給誰?
- 電動車電池容量和效率
- 發布的電動車車型數量
- 法律規範
- 加拿大
- 墨西哥
- 美國
- 價值鍊和通路分析
第5章市場區隔
- 體型
- 公車
- LCV
- M&HDT
- 搭乘用車
- 推進類型
- BEV
- PHEV
- 電池化學
- LFP
- NCA
- NCM
- NMC
- 其他
- 容量
- 15 kWh~40 kWh
- 40 kWh~80 kWh
- 超過80度
- 少於15千瓦時
- 電池形狀
- 圓柱形
- 包包
- 方塊
- 方法
- 雷射
- 金屬絲
- 成分
- 陽極
- 陰極
- 電解
- 分隔符
- 材料類型
- 鈷
- 鋰
- 錳
- 天然石墨
- 鎳
- 其他材料
- 國家
- 加拿大
- 美國
第6章 競爭格局
- 關鍵策略趨勢
- 市場佔有率分析
- 商業狀況
- 公司簡介
- A123 Systems LLC
- ACDELCO(Subsidiary Of General Motors)
- American Battery Solutions Inc.
- Clarios International Inc.
- Contemporary Amperex Technology Co. Ltd.(CATL)
- Electrovaya Inc.
- Envision AESC Japan Co. Ltd.
- LG Energy Solution Ltd.
- Nikola Corporation
- Panasonic Holdings Corporation
- QuantumScape Corp.
- SK Innovation Co. Ltd.
第7章:CEO面臨的關鍵策略問題
第 8 章 附錄
- 世界概況
- 概述
- 五力分析框架
- 全球價值鏈分析
- 市場動態(DRO)
- 資訊來源及延伸閱讀
- 圖片列表
- 關鍵見解
- 資料包
- 詞彙表
The North America EV Battery Pack Market size is estimated at 15.76 billion USD in 2025, and is expected to reach 33.94 billion USD by 2029, growing at a CAGR of 21.13% during the forecast period (2025-2029).
Battery manufacturing plants are expected to fuel the growth of the North American electric vehicle industry
- From 2017 to 2023, there has been a significant increase in the production and adoption of electric vehicles in North America. In 2017, the total number of electric vehicles produced in North America was approximately 200,000, which increased to over 400,000 in 2022. This growth can be attributed to various factors, including government incentives, lower battery prices, and increased consumer awareness. Research and development efforts in the electric vehicle industry have also been increasing in recent years.
- The electric vehicle battery pack market in North America is experiencing significant growth, largely driven by government subsidies and incentive programs. In recent years, there has been a marked increase in the adoption of electric vehicles due to these programs, which aim to promote the use of environmentally friendly transportation. For instance, the US government has introduced tax credits of up to USD 7,500 for the purchase of electric vehicles, making them more affordable and accessible to a wider audience.
- Further, the development of battery manufacturing plants is critical to the growth of the EV market in North America. Currently, most EV batteries are manufactured in Asia, primarily in China and South Korea. However, there are plans to build more battery manufacturing plants in North America, which will help to reduce the region's reliance on imported batteries and support the growth of the local EV industry. According to a report by Bloomberg New Energy Finance, North America is expected to invest USD 360 billion in EV infrastructure by 2040 as the region seeks to reduce its carbon emissions and transition to cleaner transportation. Overall, the future of electric vehicles and battery packs in North America is promising.
Government support and investments driving electric vehicle adoption in the United States and Canada
- The North American electric vehicle (EV) battery pack market has witnessed robust growth in recent years, with both the United States and Canada seeing a surge in EV adoption. This uptick can be attributed to several factors, including government incentives, tightening emission regulations, growing environmental consciousness among consumers, and advancements in charging infrastructure.
- At various levels, governments across North America have been rolling out policies and incentives to spur EV adoption. These initiatives encompass tax credits, grants, rebates, and investments in charging infrastructure. Such support has bolstered consumer interest in EVs, thereby driving the demand for battery packs. Notably, major automakers and battery manufacturers are ramping up their production capacities for EV battery packs in the regional market. Tesla, for instance, operates its gigafactory in Nevada, United States, which is solely dedicated to battery production. Other industry giants like General Motors, Ford, and Volkswagen have also unveiled plans to establish their own domestic battery production facilities.
- Continued R&D endeavors in battery technology are focused on enhancing energy density, cost reduction, and extending the range of EVs. Innovations like solid-state batteries, rapid-charging capabilities, and prolonged battery life are poised to propel the market further. Additionally, the availability of key battery materials is a crucial factor. North America boasts substantial reserves of vital materials like lithium, nickel, and cobalt, which can bolster localized production and supply chain activities over the coming years.
North America EV Battery Pack Market Trends
The major players in the North American electric vehicle market include Tesla, Toyota, Ford, Hyundai, and Honda
- The North American electric vehicle market is majorly driven by the five major players, accounting for more than 70% of the market in 2023. These prominent players include Tesla, Toyota Group, Ford Group, Hyundai, and Honda. Tesla is the highest seller of electric vehicles in the various North American countries, accounting for around 33% of the market. The company focuses on strong innovation technologies and has strong strategic partnerships with various EV components (such as a battery) manufacturers. Being a US-based company, it has a strong customer base with great product and service offerings in major countries like the United States and Canada across North America.
- Toyota Group is the second largest seller of electric vehicles, accounting for around 30.8% market share across North America. The company has a strong supply chain and distribution network. Toyota has a reliable brand image among its customers. It ranks third in EV sales across various countries in North America. Ford Group acquired it with around 9.9% of the market share. The company has a large customer base in North American countries due to its strong brand image and diverse offerings.
- Hyundai is the fourth largest player, acquiring around 5.48% of the market share in EV sales across North America. The company has a strong production and supply chain network, with wide innovative and diverse products offered for various types of customers looking from reasonable to premium pricing. The fifth-largest player operating in the EV market is Honda, maintaining its market share at around 5.22%. Some of the other players selling EVS in North America include Jeep, Chevrolet, BMW, and Volvo.
The United States was the largest market with huge EV demand and captured more than 60% of the battery pack market across the region in 2023
- In 2023, the demand for batteries surged as the number of electric vehicles steadily climbed across several North American countries. Many other brands and models are sold in the region, but the top five models in 2023, the Tesla Model Y, Tesla Model 3, Toyota Rav 4, Toyota Sienna, and Honda CRV, acquired a significant portion of the market. With 247,344 units sold in the United States in 2023, the Tesla Model Y maintained its top spot. The Model Y is very well-liked because of its long range, strong seating capacity, and huge luggage capacity.
- The Tesla Model 3 took second place with 215,500 sales in the United States in 2023. The rear-wheel drive and performance versions of the vehicle are available. Due to its strong performance characteristics, Model 3 is drawing customers. The Toyota Rav4 took third position in electric car sales, with sales of 149,938 in the United States and throughout North America. The vehicle has plug-in hybrid technology and several ADAS features, including Toyota Safety Sense.
- The Toyota Sienna has acquired fourth place in the electric vehicle models' sales, with 69,720 in the United States. The car comes with the option of a 2.5 l engine with a hybrid powertrain. Consumers with big families looking for seven-seater cars have positively responded to the Toyota Sienna. The fifth place was acquired by the Honda CRV, selling 69,720 units in 2023 in the United States. Other top-selling models include Toyota Highlander, Jeep Wrangler, Toyota Camry, Honda Accord, and Ford Mustang Mach-E.
North America EV Battery Pack Industry Overview
The North America EV Battery Pack Market is fairly consolidated, with the top five companies occupying 85.66%. The major players in this market are Contemporary Amperex Technology Co. Ltd. (CATL), Envision AESC Japan Co. Ltd., LG Energy Solution Ltd., Panasonic Holdings Corporation and SK Innovation Co. Ltd. (sorted alphabetically).
Additional Benefits:
- The market estimate (ME) sheet in Excel format
- 3 months of analyst support
TABLE OF CONTENTS
1 EXECUTIVE SUMMARY & KEY FINDINGS
2 REPORT OFFERS
3 INTRODUCTION
- 3.1 Study Assumptions & Market Definition
- 3.2 Scope of the Study
- 3.3 Research Methodology
4 KEY INDUSTRY TRENDS
- 4.1 Electric Vehicle Sales
- 4.2 Electric Vehicle Sales By OEMs
- 4.3 Best-selling EV Models
- 4.4 OEMs With Preferable Battery Chemistry
- 4.5 Battery Pack Price
- 4.6 Battery Material Cost
- 4.7 Price Chart Of Different Battery Chemistry
- 4.8 Who Supply Whom
- 4.9 EV Battery Capacity And Efficiency
- 4.10 Number Of EV Models Launched
- 4.11 Regulatory Framework
- 4.11.1 Canada
- 4.11.2 Mexico
- 4.11.3 US
- 4.12 Value Chain & Distribution Channel Analysis
5 MARKET SEGMENTATION (includes market size in Value in USD and Volume, Forecasts up to 2029 and analysis of growth prospects)
- 5.1 Body Type
- 5.1.1 Bus
- 5.1.2 LCV
- 5.1.3 M&HDT
- 5.1.4 Passenger Car
- 5.2 Propulsion Type
- 5.2.1 BEV
- 5.2.2 PHEV
- 5.3 Battery Chemistry
- 5.3.1 LFP
- 5.3.2 NCA
- 5.3.3 NCM
- 5.3.4 NMC
- 5.3.5 Others
- 5.4 Capacity
- 5.4.1 15 kWh to 40 kWh
- 5.4.2 40 kWh to 80 kWh
- 5.4.3 Above 80 kWh
- 5.4.4 Less than 15 kWh
- 5.5 Battery Form
- 5.5.1 Cylindrical
- 5.5.2 Pouch
- 5.5.3 Prismatic
- 5.6 Method
- 5.6.1 Laser
- 5.6.2 Wire
- 5.7 Component
- 5.7.1 Anode
- 5.7.2 Cathode
- 5.7.3 Electrolyte
- 5.7.4 Separator
- 5.8 Material Type
- 5.8.1 Cobalt
- 5.8.2 Lithium
- 5.8.3 Manganese
- 5.8.4 Natural Graphite
- 5.8.5 Nickel
- 5.8.6 Other Materials
- 5.9 Country
- 5.9.1 Canada
- 5.9.2 US
6 COMPETITIVE LANDSCAPE
- 6.1 Key Strategic Moves
- 6.2 Market Share Analysis
- 6.3 Company Landscape
- 6.4 Company Profiles
- 6.4.1 A123 Systems LLC
- 6.4.2 ACDELCO (Subsidiary Of General Motors)
- 6.4.3 American Battery Solutions Inc.
- 6.4.4 Clarios International Inc.
- 6.4.5 Contemporary Amperex Technology Co. Ltd. (CATL)
- 6.4.6 Electrovaya Inc.
- 6.4.7 Envision AESC Japan Co. Ltd.
- 6.4.8 LG Energy Solution Ltd.
- 6.4.9 Nikola Corporation
- 6.4.10 Panasonic Holdings Corporation
- 6.4.11 QuantumScape Corp.
- 6.4.12 SK Innovation Co. Ltd.
7 KEY STRATEGIC QUESTIONS FOR EV BATTERY PACK CEOS
8 APPENDIX
- 8.1 Global Overview
- 8.1.1 Overview
- 8.1.2 Porter's Five Forces Framework
- 8.1.3 Global Value Chain Analysis
- 8.1.4 Market Dynamics (DROs)
- 8.2 Sources & References
- 8.3 List of Tables & Figures
- 8.4 Primary Insights
- 8.5 Data Pack
- 8.6 Glossary of Terms
 高密度電動車電池組設計市場-策略洞察與預測(2026-2031年)
 電動汽車電池組市場機會、成長動力、產業趨勢分析及 2025 - 2034 年預測
 中國電動車電池組:市場佔有率分析、產業趨勢與統計、成長預測(2025-2029 年)亞太地區電動汽車電池組:市場佔有率分析、產業趨勢與統計、成長預測(2025-2029 年)印度電動車電池組:市場佔有率分析、行業趨勢和統計、成長預測(2025-2029 年)德國電動車電池組:市場佔有率分析、產業趨勢與統計、成長預測(2025-2029 年)日本電動車電池組:市場佔有率分析、產業趨勢與統計、成長預測(2025-2029 年)東協電動車電池組:市場佔有率分析、產業趨勢與成長預測(2025-2030 年)歐洲電動車電池組:市場佔有率分析、產業趨勢與統計、成長預測(2025-2029 年)法國電動車電池組:市場佔有率分析、行業趨勢和統計、成長預測(2025-2029 年)