


 |
市場調查報告書
商品編碼
1690840
貨櫃運輸-市場佔有率分析、產業趨勢與統計、成長預測(2025-2030)Container Shipping - Market Share Analysis, Industry Trends & Statistics, Growth Forecasts (2025 - 2030) |
||||||
※ 本網頁內容可能與最新版本有所差異。詳細情況請與我們聯繫。
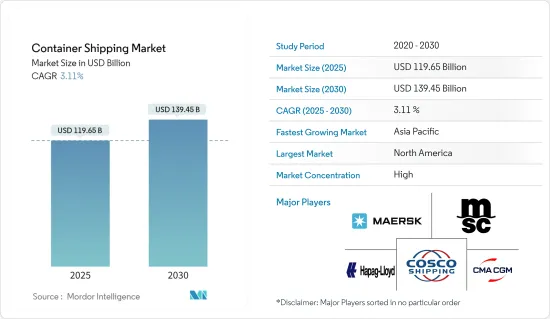
預計 2025 年貨櫃航運市場規模為 1,196.5 億美元,到 2030 年將達到 1,394.5 億美元,預測期內(2025-2030 年)的複合年成長率為 3.11%。
關鍵亮點
- 全球貨櫃航運業可能正在應對紅海的動盪局勢。儘管如此,今年對大多數專家來說肯定是充滿驚喜的一年。供應鏈專業人員正在策略性地重新規劃貿易路線,並利用技術來增強韌性和創新能力。航運公司對產業成長持樂觀態度,但仍保持謹慎,意識到地緣政治緊張等潛在干擾。
- 投資科技和規劃位居投資趨勢榜首,30%的受訪者表示正在為此投入資金。即時可視性和追蹤(24%)、協作和連接(27%)以及流程自動化(18%)也排名靠前。
- 交通量的成長得益於各種封鎖措施的放鬆導致全球經濟活動復甦、輔助包裝推動部分地區商品消費勢頭強勁、庫存重建導致電子商務強勁成長以及商業活動正常的季節性波動。
- 隨著企業永續性目標的日益關注以及歐盟新訂定的當地法規,永續性已成為許多托運人和運輸業者在新的一年優先考慮的議題。
- 例如,根據歐盟的《碳邊境調整機制》(CBAM)法律,所有歐盟進口商都必須報告與生產某些產品相關的碳排放。此外,自1月1日起,往返歐洲經濟區(EEA)的航運公司必須遵守歐盟新的排放交易體系(ETS)法規,該法規已擴展到航運業。
- 許多航運業者已開始採取措施,實現更永續的航運,例如採用慢速航行以滿足2023年國際海事組織溫室氣體戰略等排放標準,或引入氨、甲醇和再生食用油等生質燃料。然而,歐盟的新要求可能會導致航運公司調整航班時刻表、徵收額外費用並做出其他改變以實現永續性目標,這將不可避免地對托運人產生影響。
貨櫃船市場趨勢
高櫃貨櫃市場的興起
- *高櫃貨櫃有多種長度,包括 20 英尺和 40 英尺。高櫃箱的主要特點是高度增加。高立方體貨櫃高 9 英尺 6 英寸,而標準貨櫃高 8 英尺 6 英寸。
- *任何需要垂直空間的地方都可使用高立方體容器。當運輸因尺寸原因而不適合標準高度的貨物時,或者當您想要有效地最大化貨物數量時,這很有用。
- 高櫃貨櫃整體普通貨物(乾貨)。高櫃整體用於運輸普通貨物(乾貨),但特別適合運輸輕型、大量貨物(高度可達 2.70 公尺)以及超重貨物。
- 高箱貨櫃的主要優點是由於其高度(9 英尺 6 英寸),其立方體體積比標準貨櫃更大。這使得運輸更大或更高的貨物成為可能,為處理各種貨物提供了靈活性。
- 貨櫃產量統計數據顯示,幾年前,乾貨貨櫃產量超過660萬個,但未來幾年,這一數字將下降到345萬個標準箱。生產趨勢仍在波動,預計產量將增加,主要原因是更換需求。新的高櫃貨櫃的平均價格在 3,000 美元到 7,000 美元之間,而二手貨櫃的價格則在 1.50 美元到 5,000 美元之間,具體取決於尺寸。
亞太地區佔市場主導地位
- 中國是全球商品供應國,幾乎與所有國家都有貿易。一個國家的 GDP 很大程度上受到與其他國家貿易的影響。全球對中國商品(成品或原料)的需求很高。 2023年第一季,儘管面臨國際市場阻力,但中國出口仍呈現明顯復甦動能。
- 根據May Asia報道,中國3月出口年增14.8%,扭轉了一段時間的下滑趨勢。
- 根據最新發布的新華波羅的海國際航運中心發展指數,2023年全球航運中心城市前十名排名中,中國航運中心城市地位顯著提升,舟山、香港、寧波、上海等城市均榜上有名,凸顯了中國在全球航運領域日益增強的重要性。
- 日本是繼中國和希臘之後亞洲第三大船舶持有國。包括日本在內的亞洲國家在貨物處理性能方面處於領先地位,並擁有一些在效率和連接性方面排名世界前列的港口。
- 2023年4月至10月,印度所有主要港口的貨物吞吐量為4.6398億噸。去年4月至10月,印度主要港口的貨物吞吐量為4.465億噸。印度去年的商品出口額為 4,178 億美元,比上年成長 40%。 23會計年度出口總額達4,474.6億美元。政府推行了部分機械化,深化徵兵,實施快速撤離措施,以提高業務效率。
- 在所有商品中,貨櫃是印度 2023-24 年 4 月至 5 月期間處理的最大貨物,達 3,022 萬噸,佔總量的 22.6%。其次是POL原油(20.6%)、動力煤(15.1%)、其他大宗商品(8.2%)、鐵礦石/球團(7.1%)、POL產品(6.7%)、其他煤炭(5.7%)、冶金煤(4.6%)、LPG/ LNG(1.8%)、鋼鐵(1.2%)、化學肥料(1.2%)、FRM乾粉(1.1%)、食用油(1.1%)、其他礦石(1.0%)、FRM液體(0.9%)、水泥(0.4%)和糖(0.3%)。
貨櫃航運業概況
貨櫃航運市場本質上是細分的,有許多國際參與者。該領域的主要企業包括馬士基、地中海航運、達飛、中遠和赫伯羅特。由於全球海上貿易和工業化的成長,全球貨櫃運輸市場預計將穩步成長。
海運貨櫃市場的成長受到船舶運輸貨物需求的增加和貿易相關協議的增加的推動。此外,運輸和倉儲成本的波動也會影響貨櫃市場的成長。預測期內市場的成長前景預計將受到航運自動化轉型和海上安全標準提高等因素的推動。
其他福利
- Excel 格式的市場預測 (ME) 表
- 3個月的分析師支持
目錄
第1章 引言
- 調查前提條件
- 研究範圍
第2章調查方法
- 分析方法
- 研究階段
第3章執行摘要
第4章 市場動態與洞察
- 當前市場狀況
- 市場動態
- 驅動程式
- 國際貿易量增加
- 國家間貿易協定日益增多
- 限制因素
- 燃料價格上漲影響市場
- 貿易緊張局勢加劇
- 機會
- 市場技術進步
- 不斷擴大的世界貿易
- 驅動程式
- 價值鏈/供應鏈分析
- 行業法規政策
- 物流領域的技術發展
- 產業吸引力-波特五力分析
- 新進入者的威脅
- 買家/消費者的議價能力
- 供應商的議價能力
- 替代品的威脅
- 競爭對手之間的競爭強度
- COVID-19 市場影響
- 市場最終用戶洞察
第5章市場區隔
- 尺寸
- 小容器
- 大型容器
- 高櫃
- 按類型
- 普通貨櫃運輸
- 冷藏貨櫃運輸
- 按地區
- 北美洲
- 美國
- 加拿大
- 墨西哥
- 北美其他地區
- 歐洲
- 德國
- 法國
- 英國
- 義大利
- 其他歐洲國家
- 亞太地區
- 中國
- 日本
- 澳洲
- 印度
- 新加坡
- 馬來西亞
- 印尼
- 泰國
- 其他亞太地區
- 中東和非洲
- 埃及
- 卡達
- 沙烏地阿拉伯
- 阿拉伯聯合大公國
- 南非
- 其他中東和非洲地區
- 南美洲
- 巴西
- 哥倫比亞
- 南美洲其他地區
- 北美洲
第6章競爭格局
- 市場集中度概覽
- 公司簡介
- AP Moller-Maersk AS
- MSC Mediterranean Shipping Company SA
- CMA CGM
- China COSCO Holdings Company Limited
- Hapag-Lloyd
- ONE(Ocean Network Express)
- Evergreen Line
- Wan Hai Lines
- Zim
- SITC
- Zhonggu Logistics Corp.
- Antong Holdings(QASC)*
- 其他公司
第7章:市場的未來
第 8 章 附錄
The Container Shipping Market size is estimated at USD 119.65 billion in 2025, and is expected to reach USD 139.45 billion by 2030, at a CAGR of 3.11% during the forecast period (2025-2030).
Key Highlights
- The global container shipping industry may be dealing with a volatile situation in the Red Sea. Still, this year should provide plenty of moments for most professionals in space. Supply chain professionals are strategically rethinking trade routes and embracing technology to foster resilience and innovation. While shipping companies are optimistic about the industry's growth, they remain vigilant, recognizing potential disruptions, such as geopolitical tensions.
- Investments in technology and planning are the top investment trend, with 30% of respondents saying that is where they spend money. Real-time visibility and tracking (24%), collaboration and connectivity (27%), and process automation (18%) also appeared on the list.
- The increase in volumes transported was due to the pick-up in global economic activity following the easing of various lockdown measures, the strong momentum in terms of the consumption of goods encouraged in some locations by support packages, strong e-commerce growth with inventory rebuilding, and the usual seasonal variation in business activity.
- A heightened focus on corporate sustainability goals and new regional regulations from the European Union (EU) puts sustainability at the top of mind for many shippers and carriers heading into this year.
- For example, under the EU's Carbon Border Adjustment Mechanism (CBAM) law, all EU importers need to report carbon emissions related to the production of certain products. Additionally, starting January 1, carriers shipping to, from, or within the European Economic Area (EEA) are subject to the EU's new Emission Trading System (ETS) regulations, which were expanded to include maritime shipping.
- Many ocean carriers have already made progress toward more sustainable shipping, including using slow steaming to meet emissions standards like the 2023 IMO GHG Strategy and introducing biofuels such as ammonia, methanol, and recycled cooking oil. However, the new requirements from the European Union may lead carriers to adjust schedules, implement surcharges, or make other changes to meet their sustainability goals, which would inevitably impact shippers.
Container Shipping Market Trends
Increasing high cube containers segment
- * High cube containers are available in various lengths, including 20-foot and 40-foot options. The key feature of high cube containers is the increased height. While a standard container is 8 feet 6 inches high, high cube containers are 9 feet 6 inches tall.
- * High cube containers are used when extra vertical space is needed. They are beneficial for transporting goods that may not fit within the standard height due to their dimensions or for maximizing cargo volume efficiently.
- High-cube containers are used for all types of general cargo (dry cargo). However, they are particularly suitable for transporting light, voluminous cargoes and overheight cargoes up to a maximum of 2.70 m tall.
- The primary advantage of high cube containers is their extra height (9 feet 6 inches), providing more cubic capacity than standard containers. This allows for transporting more significant or taller cargo, offering flexibility in handling various goods.
- Statistics on the production of containers show that a few years ago, more than 6.6 million dry freight containers were produced, which will drop to 3.45 million TEU in the next few years. The trend in production is still fluctuating, with expectations of an increase mainly driven by replacement needs. The average cost of a new high cube container can range from USD 3,000 to USD 7,000, while a used unit may be around USD 1,50 to USD 5,000, depending on the size.
Asia-Pacific dominating the market
- China is a global supplier of goods, trading with almost every nation. The GDP of the nation is significantly influenced by foreign commerce. Global demand for Chinese commodities (completed items or raw materials) is high. In the first quarter of 2023, China's exports showed a stunning recovery despite experiencing obstacles in international markets.
- According to May Asia, China's exports increased by an impressive 14.8% in March compared to the same month last year, marking a positive turn of events after a period of decline.
- In the top 10 global rankings for 2023, Chinese shipping center cities are notably represented, according to the most recent edition of the Xinhua-Baltic International Shipping Centre Development Index. Cities like Zhoushan, Hong Kong, Ningbo, and Shanghai were well-represented on this list, highlighting China's increasing importance in the global shipping sector.
- Japan is the third-largest ship-owning country in Asia after China and Greece. Asian countries, including Japan, lead in cargo handling performance and have several ports ranked among the top globally for efficiency and connectivity.
- All of India's major ports handled 463.98 million tons (MT) of cargo traffic between April and October of 2023. India's major ports handled 446.50 million tons (MT) of cargo traffic between April and October of the previous year. India exported USD 417.8 billion of goods a few years ago, a 40% increase from the prior year. Exports of goods totaled USD 447.46 billion in FY23. The government has implemented several mechanizations, deepened the draft, and implemented quick evacuation policies to increase operational efficiency.
- In April-May 2023-24, among all commodities, containers handled the highest cargo of 30.22 million tonnes in India, accounting for 22.6% of the total. Next in line were POL-crude (20.6%), thermal coal (15.1%), other commodities (8.2%), iron ore/pellets (7.1%), POL products (6.7%), other coal (5.7%), coking coal (4.6%), LPG/LNG (1.8%), iron & steel (1.2%), fertilizer (1.2%), FRM dry (1.1%), edible oil (1.1%), other ores (1.0%), FRM liquid (0.9%), cement (0.4%), and sugar (0.3%).
Container Shipping Industry Overview
The container shipping market is fragmented in nature, with the presence of many international companies. The top players in the segment include Maersk, MSC, CMA, COSCO, and Hapag Lloyd. Due to the increased seaborne trade and industrialization worldwide, the global shipping container market is expected to grow steadily.
The growth of the shipping container market is supported by increased demand for cargo transport via ships and a rise in trade-tied agreements. In addition, the growth of the shipping container market is affected by fluctuations in transportation and storage costs. Nevertheless, growth prospects for the market in the forecast period will be driven by factors such as a planned shift towards automation of shipping and increased safety standards at sea.
Additional Benefits:
- The market estimate (ME) sheet in Excel format
- 3 months of analyst support
TABLE OF CONTENTS
1 INTRODUCTION
- 1.1 Study Assumptions
- 1.2 Scope of the Study
2 RESEARCH METHODOLOGY
- 2.1 Analysis Methodology
- 2.2 Research Phases
3 EXECUTIVE SUMMARY
4 MARKET DYNAMICS AND INSIGHTS
- 4.1 Current Market Scenario
- 4.2 Market Dynamics
- 4.2.1 Drivers
- 4.2.1.1 Increasing volume of international trade
- 4.2.1.2 The rise of trade agreements between nations
- 4.2.2 Restraints
- 4.2.2.1 Surge in fuel costs affecting the market
- 4.2.2.2 Increasing trade tension
- 4.2.3 Opportunities
- 4.2.3.1 Technological advancements in the market
- 4.2.3.2 Expanding global trade
- 4.2.1 Drivers
- 4.3 Value Chain/Supply Chain Analysis
- 4.4 Industry Policies and Regulations
- 4.5 Technological Developments in the Logistics Sector
- 4.6 Industry Attractiveness - Porter's Five Forces Analysis
- 4.6.1 Threat of New Entrants
- 4.6.2 Bargaining Power of Buyers/Consumers
- 4.6.3 Bargaining Power of Suppliers
- 4.6.4 Threat of Substitute Products
- 4.6.5 Intensity of Competitive Rivalry
- 4.7 Impact of COVID-19 on the Market
- 4.8 Insights into End Users in the Market
5 MARKET SEGMENTATION
- 5.1 By Size
- 5.1.1 Small Containers
- 5.1.2 Large Containers
- 5.1.3 High Cube Containers
- 5.2 By Type
- 5.2.1 General Container Shipping
- 5.2.2 Reefer Container Shipping
- 5.3 By Geography
- 5.3.1 North America
- 5.3.1.1 United States
- 5.3.1.2 Canada
- 5.3.1.3 Mexico
- 5.3.1.4 Rest of North America
- 5.3.2 Europe
- 5.3.2.1 Germany
- 5.3.2.2 France
- 5.3.2.3 United Kingdom
- 5.3.2.4 Italy
- 5.3.2.5 Rest of Europe
- 5.3.3 Asia-Pacific
- 5.3.3.1 China
- 5.3.3.2 Japan
- 5.3.3.3 Australia
- 5.3.3.4 India
- 5.3.3.5 Singapore
- 5.3.3.6 Malaysia
- 5.3.3.7 Indonesia
- 5.3.3.8 Thailand
- 5.3.3.9 Rest of Asia-Pacific
- 5.3.4 Middle East and Africa
- 5.3.4.1 Egypt
- 5.3.4.2 Qatar
- 5.3.4.3 Saudi Arabia
- 5.3.4.4 United Arab Emirates
- 5.3.4.5 South Africa
- 5.3.4.6 Rest of Middle East and Africa
- 5.3.5 South America
- 5.3.5.1 Brazil
- 5.3.5.2 Colombia
- 5.3.5.3 Rest of South America
- 5.3.1 North America
6 COMPETITIVE LANDSCAPE
- 6.1 Market Concentration Overview
- 6.2 Company Profiles
- 6.2.1 AP Moller-Maersk AS
- 6.2.2 MSC Mediterranean Shipping Company SA
- 6.2.3 CMA CGM
- 6.2.4 China COSCO Holdings Company Limited
- 6.2.5 Hapag-Lloyd
- 6.2.6 ONE (Ocean Network Express)
- 6.2.7 Evergreen Line
- 6.2.8 Wan Hai Lines
- 6.2.9 Zim
- 6.2.10 SITC
- 6.2.11 Zhonggu Logistics Corp.
- 6.2.12 Antong Holdings (QASC)*
- 6.3 Other Companies
7 FUTURE OF THE MARKET
8 APPENDIX
 冷藏貨櫃:全球市場佔有率和排名、總銷售額和需求預測(2025-2031 年)
 2025 年至 2033 年貨櫃運輸市場報告(按產品、貨櫃尺寸(小型貨櫃、大型貨櫃、高箱貨櫃等)、應用和地區分類)
 按貨櫃類型、材料類型、貨櫃尺寸、貨櫃所有者、應用和最終用戶行業分類的貨櫃運輸市場 - 2025-2032 年全球預測
 全球冷藏貨櫃運輸市場
 2025年全球貨櫃運輸市場報告
 2032 年全球貨櫃航運市場預測:按類型、船舶大小、推進力、技術、應用、最終用戶和地區分類
 全球智慧航運貨櫃市場研究報告 - 產業分析、規模、佔有率、成長、趨勢及 2025 年至 2033 年預測2034 年貨櫃改裝市場分析及預測:類型、產品、服務、技術、組件、應用、材料類型、流程、最終用戶、安裝類型全球40英尺貨櫃底盤市場
 貨櫃運輸:市場佔有率分析、行業趨勢、統計數據和成長預測(2025-2030 年)