


 |
市場調查報告書
商品編碼
1690184
美國低溫運輸物流:市場佔有率分析、產業趨勢、統計數據、成長預測(2025-2030 年)US Cold Chain Logistics - Market Share Analysis, Industry Trends & Statistics, Growth Forecasts (2025 - 2030) |
||||||
※ 本網頁內容可能與最新版本有所差異。詳細情況請與我們聯繫。
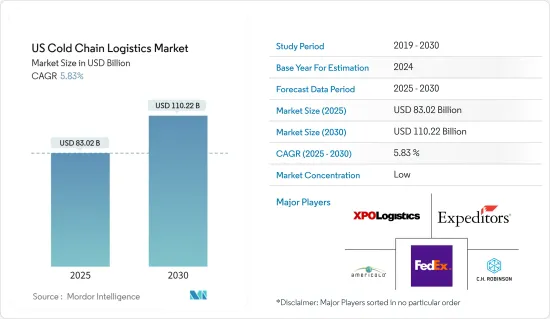
2025年美國低溫運輸物流市場規模預估為830.2億美元,預估至2030年將達1,102.2億美元,預測期間(2025-2030年)的複合年成長率為5.83%。
關鍵亮點
- 新冠疫情導致國內電子零售業和包裝食品飲料消費大幅成長,刺激了對冷藏保管空間和物流的需求。網路雜貨店的興起,其中生鮮食品和冷凍食品的訂單佔很大比例,也支撐了市場需求。政府對溫度敏感產品的生產和供應的嚴格監管也極大地促進了該市場的發展。
- 然而,運輸和倉儲行業的勞動力短缺、高能源需求以及低溫運輸物流業務對環境的負面影響是可能限制市場成長的一些挑戰。為了應對與高能源需求和負面環境影響相關的挑戰,一些公司正在實施增加運作低溫運輸基礎設施所需能源的解決方案。
- 參與企業正在採用人工智慧 (AI)、機器學習、物聯網 (IoT)、機器人、穿戴式裝置和配送中心自動化等技術來提高業務效率、降低營運成本並提供更好的客戶體驗。
- 外包在更廣泛的工業物流市場中呈現上升趨勢,截至 2022 年 5 月,第三方物流 (3PL) 供應商佔總租賃活動的 34%,高於 2021 年同期的 30%。由於成本和技術系統更複雜,這種趨勢在冷藏行業尤其普遍。
- 根據美國農業部 (USDA) 的數據,目前美國72% 的冷藏容量委託給公共冷藏 (PRW) 公司,低於五年前的 75%。其餘 28% 為內部低溫運輸營運商,高於五年前的 25%。
- 生鮮產品的進口、包括生技藥品在內的製藥業的成長、冷凍食品消費的成長以及藥品溫度監控的規定是推動美國低溫運輸物流市場需求的一些因素。
美國低溫運輸物流市場趨勢
增加墨西哥進口的生鮮食品
- 美國每年從世界各地進口價值220億美元的生鮮食品,並接收來自125多個國家的生鮮食品。該國32%的新鮮蔬菜和55%的新鮮水果都從其他國家進口。
- 拉丁美洲和北美之間空運的貨物幾乎70%都是生鮮產品。美國進口的新鮮水果和蔬菜77%來自墨西哥,另有11%來自加拿大。
- 墨西哥是美國最大的農業貿易夥伴,2022年進口總額(進口+出口)為719億美元。其中,美國對墨西哥的農產品出口額為285億美元,自墨西哥的進口額為434億美元。從墨西哥進口的主要農產品是水果和蔬菜;事實上,美國進口的44%的水果和48%的蔬菜都來自墨西哥。
- 根據美國農業部(USDA)的數據,2022年,美國從墨西哥進口的農產品中有83.6%是蔬菜、水果、飲料和蒸餾酒。
- 2022年,美國從墨西哥進口了價值187億美元的農產品,包括新鮮、冷凍和加工的水果、蔬菜和堅果。其中超過 98% 的進口產品透過墨西哥與德克薩斯、新墨西哥州、亞利桑那州和加利福尼亞州之間的陸路港口進入美國。如果只考慮新鮮水果和蔬菜,其占所有水果和蔬菜的近89%,總進口額將達到166億美元。
- 這些進口貨物由 590,906 輛 40,000 磅卡車運輸。美國從墨西哥進口的新鮮水果和蔬菜約有 55% 透過德克薩斯州陸港抵達,共 325,467 卡車,價值 116 億美元。
冷凍食品日益流行
- 根據美國冷凍食品協會 (AFFI) 的報告,2022 年冷凍食品銷售額將成長 8.6%,達到 722 億美元。在此期間,單位銷售額有所下降,但仍比疫情前的水平高出 5%。
- 2018 年至 2022 年間,冷凍食品銷售額成長了 194 億美元,凸顯了疫情對此類別成長的影響。雖然冷凍食品的美元銷售額自 2018 年以來持續上升,但 2021 年和 2022 年的單位銷售額分別下降了 3.2% 和 5.1%,凸顯了通貨膨脹對冷凍食品成本的潛在影響。
- 儘管銷量有所下降,但與疫情前的水平相比仍然很高,顯示對冷凍食品的需求持續存在。冷凍加工肉品、冷凍零食和冷凍魚貝類尤其如此,與疫情前的水平相比,這些產品的銷量均出現了兩數的成長。
- AFFI 的最新研究表明,超過四分之一的消費者比三年前更多地購買冷凍水果和蔬菜,因為他們認知到這些食品的許多好處。冷凍水果和蔬菜使家庭和人群更容易增加農產品消費量並減少食物廢棄物。美國冷凍蔬果整體普及率較高,94%的家庭購買冷凍蔬果。
- 截至 2022 年 6 月 26 日的 52 週內,美國冷凍水果和蔬菜銷售額達到 71 億美元,產品產量達到 39 億磅,比疫情前水準高出 2.71 億磅。該領域最暢銷的產品是普通蔬菜、馬鈴薯、洋蔥和水果,銷售額分別為 29 億美元、23 億美元和 15 億美元。
美國低溫運輸物流產業概況
美國低溫運輸物流市場高度分散,支持溫度敏感貨物的國內和國際運輸。隨著太陽能製冷裝置、多溫度卡車和貨運最佳化軟體的引入,發展正在進行中。聯邦快遞、XPO Logistics、Total Quality Logistics 和 Americold Logistics 等國際和本地公司都已進入該市場。
其他福利
- Excel 格式的市場預測 (ME) 表
- 3個月的分析師支持
目錄
第1章 引言
- 調查結果
- 調查前提
- 研究範圍
第2章調查方法
- 分析方法
- 研究階段
第3章執行摘要
第4章 市場動態與洞察
- 當前市場狀況
- 市場動態
- 驅動程式
- 製藥業的成長
- 增加墨西哥進口的生鮮食品
- 冷凍食品越來越受歡迎
- 限制因素
- 低溫運輸作業所產生的排放
- 勞動力短缺
- 機會
- 採用節能解決方案
- 網路雜貨業務的興起
- 驅動程式
- 產業吸引力-波特五力分析
- 買家/消費者的議價能力
- 供應商的議價能力
- 新進入者的威脅
- 替代品的威脅
- 競爭對手之間的競爭
- 洞察技術趨勢和自動化
- 深入了解政府法規和舉措
- 產業價值鏈/供應鏈分析
- 專注於氣候和溫度控制存儲
- 排放標準和法規對低溫運輸產業的影響
- COVID-19對市場的影響
第5章市場區隔
- 按服務
- 貯存
- 運輸
- 附加價值服務(速凍、貼標、庫存管理等)
- 按溫度類型
- 冷藏
- 《冷凍》
- 常溫
- 按應用
- 水果和蔬菜
- 乳製品(牛奶、奶油、起司、冰淇淋等)
- 魚、肉和水產品
- 加工食品
- 醫療藥品
- 烘焙和糖果
- 其他
第6章競爭格局
- 市場集中度概覽
- 公司簡介
- FedEx
- XPO Logistics
- CH Robinson Worldwide
- JB Hunt
- Expeditors
- Total Quality Logistics
- Americold Logistics
- Burris Logistics
- Prime Inc.
- Lineage Logistics
- Arc Best
- Stevens Transport
- DHL Supply Chain
- United States Cold Storage
- DB Schenker
- Covenant Transportation Services*
第7章:市場的未來
第 8 章 附錄
The US Cold Chain Logistics Market size is estimated at USD 83.02 billion in 2025, and is expected to reach USD 110.22 billion by 2030, at a CAGR of 5.83% during the forecast period (2025-2030).
Key Highlights
- The COVID-19 pandemic significantly boosted the domestic e-retailing sector and the consumption of processed foods and beverages, pushing the demand for refrigerated storage spaces and logistics. The rise of online groceries, with a significant share of orders for perishables and frozen foods, is also supporting the market demand. The market has also benefitted significantly from the stringent government regulation toward the production and supply of temperature-sensitive products.
- However, the labor shortages in the transportation and warehousing sector, high energy requirements, and the negative environmental impact of the cold chain logistics operations are some of the challenges that may limit the market growth. To tackle the challenges regarding the high energy requirements and negative environmental impact, some companies are introducing solutions that increase the energy required to run the cold chain infrastructure.
- Technologies like Artificial Intelligence (AI), Machine Learning, Internet of Things (IoT), Robotics, Ware, and distribution center automation are being incorporated by players to increase the efficiency of their operations, reduce operational costs, and provide better customer experience.
- More outsourcing is occurring throughout the broader industrial logistics market, with third-party logistics (3PL) providers accounting for 34% of total leasing activity in 2022 through May, up from 30% in the same period of 2021. This trend is particularly common in the cold storage industry due to costs and more complex technology systems.
- According to the US Department of Agriculture (USDA), 72% of the refrigerated storage capacity in the US is outsourced to public refrigerated warehouse (PRW) companies, down from 75% five years ago. The remaining 28% includes in-house cold chain operators, up from 25% five years ago.
- The perishables imports, pharmaceutical industry growth, including the biologics sector, increasing consumption of frozen foods, pharmaceutical temperature monitoring regulations, etc., are the demand drivers for the cold chain logistics market in the United States.
US Cold Chain Logistics Market Trends
Rising fresh produce imports from Mexico
- The United States imports over USD 22 billion worth of fresh produce annually from all over the globe and receives fresh produce from over 125 countries. Thirty-two percent of the country's fresh vegetables and fifty-five percent of its fresh fruit are imported from other countries.
- Almost 70% of all goods shipped via air freight between Latin America and North America consist of perishable products. Seventy-seven percent of the fresh fruits and vegetables imported by the United S come from Mexico, with an additional 11% from Canada.
- Mexico is the largest agricultural trading partner for the United States, totaling USD 71.9 billion (imports plus exports) in 2022. US agricultural exports to Mexico totaled USD 28.5 billion, while imports from Mexico totaled USD 43.4 billion. The main agricultural products imported from Mexico are fruits and vegetables; in fact, 44% of the fruits and 48% of the vegetables imported by the US are from Mexico.
- In 2022, 83.6% of US agricultural imports from Mexico consisted of vegetables, fruit, beverages, or distilled spirits, according to the US Department of Agriculture (USDA).
- The United States imported USD 18.7 billion of produce from Mexico in 2022, including fresh, frozen, and processed fruits, vegetables, and nuts. Just over 98% of these imports entered the United States through land ports between Mexico and Texas, New Mexico, Arizona, and California. When considering only fresh fruits and vegetables, which constitute nearly 89% of the total produce, imports totaled USD 16.6 billion.
- These imports were shipped in 590,906 forty-thousand-pound truckloads. Approximately 55% of the US fresh fruit and vegetable imports from Mexico entered through Texas land ports, arriving in 325,467 truckloads worth USD 11.6 billion.
Increasing popularity of frozen foods
- The American Frozen Food Institute (AFFI) reported that frozen food sales increased 8.6% to USD 72.2 billion in 2022. Unit sales decreased during that time but remained 5% above pre-pandemic levels.
- Between 2018 and 2022, frozen food dollar sales increased a whopping USD 19.4 billion, underlining the impact of the pandemic on the category's growth. While frozen food dollar sales have consistently climbed since 2018, unit sales decreased in both 2021 and 2022 by 3.2% and 5.1%, respectively, highlighting the potential impact of inflation on frozen food costs.
- Despite the decreases, unit sales remain elevated compared to pre-pandemic levels, indicating continued demand for frozen foods. This is particularly true for frozen processed meat, frozen snacks, and seafood, which have seen double-digit increases in unit sales compared to pre-pandemic levels.
- A new survey from AFFI finds that more than a quarter of shoppers are buying more frozen fruits and vegetables than three years ago and identify many benefits with these foods. Frozen fruits and vegetables help make it easier for households and demographic groups to increase their produce consumption and reduce food waste. Overall, penetration in the United States is high, with 94% of American households buying frozen fruits and vegetables.
- The sales of frozen fruits and vegetables in the United States reached USD 7.1 billion over the 52 weeks ending June 26, 2022, and product volume were 271 million pounds above pre-pandemic levels at 3.9 billion pounds. The top products within the segment were plain vegetables, potatoes, onions, and fruit, with sales of USD 2.9 billion, USD 2.3 billion, and USD 1.5 billion, respectively.
US Cold Chain Logistics Industry Overview
The cold chain logistics market of the United States is highly fragmented, aiding the domestic as well as international transportation of temperature-sensitive goods. It is undergoing developments with the introduction of solar-powered refrigerated units, multi-temperature trucks, and freight optimization software. International and local players like FedEx, XPO Logistics, Total Quality Logistics, Americold Logistics and many such companies are operational in the market.
Additional Benefits:
- The market estimate (ME) sheet in Excel format
- 3 months of analyst support
TABLE OF CONTENTS
1 INTRODUCTION
- 1.1 Study Deliverables
- 1.2 Study Assumptions
- 1.3 Scope of the Study
2 RESEARCH METHODOLOGY
- 2.1 Analysis Methodology
- 2.2 Research Phases
3 EXECUTIVE SUMMARY
4 MARKET DYNAMICS AND INSIGHTS
- 4.1 Current Market Scenario
- 4.2 Market Dynamics
- 4.2.1 Drivers
- 4.2.1.1 PHARMACEUTICAL INDUSTRY GROWTH
- 4.2.1.2 RISING FRESH PRODUCE IMPORTS FROM MEXICO
- 4.2.1.3 INCREASING POPULARITY OF FROZEN FOODS
- 4.2.2 Restraints
- 4.2.2.1 EMISSIONS FROM COLD CHAIN OPERATIONS
- 4.2.2.2 LABOUR SHORTAGES
- 4.2.3 Opportunities
- 4.2.3.1 Adopting energy-efficient solutions
- 4.2.3.2 rise of online grocery business
- 4.2.1 Drivers
- 4.3 Industry Attractiveness - Porter's Five Forces Analysis
- 4.3.1 Bargaining Power of Buyers/Consumers
- 4.3.2 Bargaining Power of Suppliers
- 4.3.3 Threat of New Entrants
- 4.3.4 Threat of Substitute Products
- 4.3.5 Intensity of Competitive Rivalry
- 4.4 Insights on Technological Trends and Automation
- 4.5 Insights on Government Regulations and Initiatives
- 4.6 Industry Value Chain/Supply Chain Analysis
- 4.7 Spotlight on Ambient/Temperature-controlled Storage
- 4.8 Impact of Emission Standards and Regulations on Cold Chain Industry
- 4.9 Impact of Covid-19 on the Market
5 MARKET SEGMENTATION
- 5.1 By Services
- 5.1.1 Storage
- 5.1.2 Transportation
- 5.1.3 Value-added Services (Blast Freezing, Labeling, Inventory Management, etc.)
- 5.2 By Temperature Type
- 5.2.1 Chilled
- 5.2.2 Frozen
- 5.2.3 Ambient
- 5.3 By Application
- 5.3.1 Fruits and Vegetables
- 5.3.2 Dairy Products (Milk, Butter, Cheese, Ice Cream, Etc.)
- 5.3.3 Fish, Meat, and Seafood
- 5.3.4 Processed Food
- 5.3.5 Healthcare & Pharmaceuticals
- 5.3.6 Bakery and Confectionary
- 5.3.7 Other Applications
6 COMPETITIVE LANDSCAPE
- 6.1 Market Concentration Overview
- 6.2 Company Profiles
- 6.2.1 FedEx
- 6.2.2 XPO Logistics
- 6.2.3 CH Robinson Worldwide
- 6.2.4 JB Hunt
- 6.2.5 Expeditors
- 6.2.6 Total Quality Logistics
- 6.2.7 Americold Logistics
- 6.2.8 Burris Logistics
- 6.2.9 Prime Inc.
- 6.2.10 Lineage Logistics
- 6.2.11 Arc Best
- 6.2.12 Stevens Transport
- 6.2.13 DHL Supply Chain
- 6.2.14 United States Cold Storage
- 6.2.15 DB Schenker
- 6.2.16 Covenant Transportation Services*
7 FUTURE OF THE MARKET
8 APPENDIX
 農產品低溫運輸物流市場預測至2032年:按組件、溫度範圍、運輸方式、儲存基礎設施、技術、最終用戶和地區分類的全球分析
 全球冷鏈物流市場:依技術、溫度類型、解決方案、產業和地區劃分-市場規模、產業趨勢、機會分析和預測(2025-2033 年)
 北美低溫運輸市場規模、佔有率和趨勢分析報告:按類型、包裝、設備、應用、國家和細分市場預測(2025-2033 年)
 冷鏈物流設備市場機會、成長促進因素、產業趨勢分析及預測(2025-2034年)
 低溫運輸市場按溫度範圍、設備類型、服務模式、最終用戶和分銷管道分類-2025-2032 年全球預測低溫運輸物流市場(按服務類型、溫度範圍和最終用途)-全球預測,2025-2032全球低溫運輸物流自動化市場:2032 年預測 - 按組件、溫度範圍、應用、最終用戶和地區分析
 電動車、電氣化與冷鏈運輸:機會在哪裡?
 2025年低溫運輸全球市場報告2032 年低溫運輸物流市場預測:按類型、溫度類型、應用和地區進行的全球分析