


 |
市場調查報告書
商品編碼
1684073
印尼錨固水泥漿:市場佔有率分析、產業趨勢與成長預測(2025-2030 年)Indonesia Anchors and Grouts - Market Share Analysis, Industry Trends & Statistics, Growth Forecasts (2025 - 2030) |
||||||
價格
※ 本網頁內容可能與最新版本有所差異。詳細情況請與我們聯繫。
簡介目錄
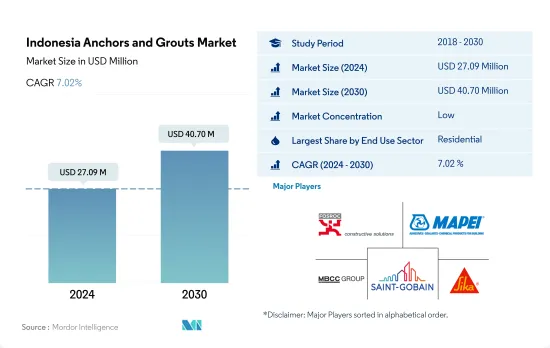
印尼錨固和水泥漿市場規模預計在 2024 年為 2,709 萬美元,預計到 2030 年將達到 4,070 萬美元,預測期內(2024-2030 年)的複合年成長率為 7.02%。
製造業在國民經濟中的主導地位將顯著促進錨固水泥漿的需求
- 2022年,市場在多個領域呈現成長,其價值將比2021年成長2.2%。 2023年,在經濟擴張和外國投資的推動下,建築業將成長。預計這種成長將推動對錨固水泥漿的需求。例如,公共工程和住宅部已設定目標,到 2023 年在努桑塔拉市建造 47 套公寓,預計需求將比 2022 年增加 6.8%。
- 錨固水泥漿的主要消費者是住宅領域,這主要是由於預製住宅的日益普及。在各種類型中,樹脂固定錨栓和水泥漿是該領域的主流,2022 年的銷售佔有率為 57%。
- 製造業在印尼經濟中佔據主導地位,2022 年對 GDP 的貢獻率約為 18.34%,工業設施的建設活動為錨固水泥漿提供了龐大的市場。這一趨勢使得工業和機構部門成為第二大消費者。由於其優異的耐化學性,環氧基錨栓和水泥漿明顯優於聚氨酯基錨栓和灌漿料,到 2022 年,環氧基錨栓和灌漿料將佔樹脂固定類型需求的 32%。
- 受城鎮人口快速成長、人均收入較低、勞動力價格低廉、中階不斷壯大以及土地成本相對較低的推動,中國製造業、教育、醫療保健和其他設施的建設顯著增加。這一趨勢正在吸引投資者。特別是,工業和設施部門預計在預測期內(2023-2030 年)以 8.82% 的最高複合年成長率成長。
印尼錨固和水泥漿市場趨勢
預計到 2028 年,印尼商業房地產市場規模將達到 1.39 兆美元,這可能會刺激商業領域的需求
- 2022年,印尼新建商業占地面積與前一年同期比較%。這一下降是由於新冠疫情期間建築活動下降後恢復正常所致。疫情爆發前,印尼商業建築的年能耗強度就已呈現下降趨勢,年平均下降率為2.64%。然而,2023年將出現復甦,新的商業占地面積將成長5.7%,這得益於對新的辦公室、倉庫和零售空間需求激增的外國直接投資(FDI)。
- 在新冠疫情期間,印尼 2020 年和 2021 年新增商業占地面積大幅增加,達到約 960 萬平方英尺。政府致力於振興經濟,並採取了諸如放寬私人和公共計劃建築相關隔離措施等措施。這使得員工可以返回現場工作,企業也可以繼續運作。值得注意的是,印尼2020年完工建築量預計將達到約1.32兆印尼盾,2021年將增加至1.42兆印尼盾。
- 預計到 2030 年,印尼的新商業占地面積將比 2023 年大幅成長約 58.72%。這一成長是由於對購物中心、辦公室和其他商業空間的需求不斷成長。零售房地產領域已成為該國特別有吸引力的行業。例如,商業房地產市場預計到2028年將達到1.39兆美元。印尼新的商業占地面積預計將保持穩定成長,預測期內複合年成長率為6.82%。
住宅需求的增加可能會推動住宅產業的成長
- 2022 年,印尼的新住宅占地面積與 2021 年相比成長了 7.10%。這一成長是由人口成長、富裕程度提高和都市化推動的。預計到 2022 年,政府主導的住宅支持將達到 29 兆印度盧比,根據住宅融資流動性工具計劃,到 2023 年將增至 32 兆印度盧比。該舉措旨在建造至少 22 萬套住宅。住宅建築業將經歷顯著成長。預計到 2023 年,這一數字與前一年同期比較增加至約 5,600 萬平方英尺。
- 2020年,印尼新建住宅占地面積較2019年成長7.06%。這是政府的一項策略性舉措,旨在優先發展建築業,以緩解景氣衰退並支持收入減少的家庭。因此,包括隔離在內的建設活動限制已大大放寬。然而,2021年趨勢逆轉,住宅開工占地面積下降約12.54%。這主要是由於建築業的外國直接投資(FDI)下降。 2021年建築業外國直接投資與前一年同期比較減51%。
- 預測期內,印尼的新住宅占地面積預計將以 6.08% 的複合年成長率成長。這一成長歸功於該國日益加快的都市化,這得益於政府舉措以及國內外投資的推動。這些因素直接或間接地加劇了該國日益成長的住宅需求,並最終促進了住宅建設。據估計,到 2030 年,每年將需要 82 萬至 100 萬套住宅才能滿足不斷成長的需求。
印尼錨固和水泥漿產業概況
印尼錨固和水泥漿市場較為分散,前五大公司佔34.76%。市場的主要企業有:Fosroc, Inc.、MAPEI SpA、MBCC Group、Saint-Gobain 和 Sika AG。
其他福利
- Excel 格式的市場預測 (ME) 表
- 3個月的分析師支持
目錄
第1章執行摘要和主要發現
第2章 報告要約
第3章 引言
- 研究假設和市場定義
- 研究範圍
- 調查方法
第4章 產業主要趨勢
- 最終用途趨勢
- 商業
- 工業/設施
- 基礎設施
- 住宅
- 重大基礎設施計劃(目前和已宣布)
- 法律規範
- 價值鍊和通路分析
第5章市場區隔
- 最終用途部門
- 商業
- 工業/設施
- 基礎設施
- 住宅
- 子產品
- 水泥基固定材料
- 樹脂固定
- 依技術
- 環氧水泥漿
- 聚氨酯(PU)水泥漿
- 其他類型
第6章 競爭格局
- 關鍵策略趨勢
- 市場佔有率分析
- 商業狀況
- 公司簡介
- Arkema
- Deltacretindo
- Fosroc, Inc.
- LATICRETE International, Inc.
- MAPEI SpA
- MBCC Group
- Normet
- Saint-Gobain
- Sika AG
- Ultrachem Construction Chemicals
第 7 章 CEO 的關鍵策略問題CEO 的關鍵策略問題
第 8 章 附錄
- 世界概況
- 概述
- 五力分析框架(產業吸引力分析)
- 全球價值鏈分析
- 市場動態(DRO)
- 資訊來源及延伸閱讀
- 圖片列表
- 關鍵見解
- 資料包
- 詞彙表
簡介目錄
Product Code: 50002026
The Indonesia Anchors and Grouts Market size is estimated at 27.09 million USD in 2024, and is expected to reach 40.70 million USD by 2030, growing at a CAGR of 7.02% during the forecast period (2024-2030).
The manufacturing sector's domination in the national economy provides a significant boost in the demand for anchors and grouts
- In 2022, the market witnessed growth across multiple sectors, with its value surpassing that of 2021 by 2.2%. The construction sector grew in 2023, driven by economic expansion and foreign investments. This growth was expected to fuel the demand for anchors and grouts. For instance, the Ministry for Public Works and Housing set a target of constructing 47 apartment towers in Nusantara City in 2023, indicating a projected demand increase of 6.8% over 2022.
- The residential segment is the primary consumer of anchors and grouts in the country, largely due to the rising popularity of prefabricated houses, which necessitate substantial usage of anchors and grouts for installation. Among the various types, the sector predominantly favors resin fixing anchors and grouts, accounting for a significant 57% volume share in 2022.
- Given the manufacturing sector's dominant role in Indonesia's economy, contributing approximately 18.34% to the GDP in 2022, the construction activities in industrial facilities create a sizable market for anchors and grouts. This trend makes the industrial and institutional segment the second-largest consumer. The preference for epoxy-based anchors and grouts over polyurethane-based ones is evident, with epoxy variants representing 32% of the resin fixing type demand in 2022, owing to their superior chemical resistance.
- Driven by factors like a surging urban population, low per capita income, affordable labor, a burgeoning middle class, and relatively lower land costs, there is a notable uptick in the construction of facilities, including manufacturing, education, and healthcare. This trend is attracting investors. Notably, the industrial and institutional sector is projected to witness the highest CAGR of 8.82% during the forecast period (2023-2030).
Indonesia Anchors and Grouts Market Trends
Indonesian commercial real estate market volume is projected to reach USD 1.39 trillion by 2028 and is likely to augment the demand for commercial sector
- In 2022, Indonesia witnessed a 9.7% decline in the volume of new commercial floor area compared to the previous year. This drop was a result of a return to normalcy following a decline in building activities during the COVID-19 pandemic. Even before the pandemic, commercial buildings in Indonesia were already showing a downward trend in annual energy intensity, accounting for a rate of 2.64% per year. However, in 2023, the country saw a rebound, registering a 5.7% increase in the volume of new commercial floor area, driven by a surge in foreign direct investment (FDI) necessitating new offices, warehouses, and retail spaces.
- Amidst the COVID-19 pandemic, in 2020 and 2021, Indonesia witnessed a significant surge in the volume of new commercial floor area, accounting for approximately 9.6 million square feet. The government's focus on revitalizing the economy led to measures such as easing construction-related quarantines, both in private and public projects. This allowed employees to resume work on-site and companies to continue their operations. Notably, the value of completed constructions in Indonesia stood at around IDR 1.32 quadrillion in 2020 and rose to IDR 1.42 quadrillion in 2021.
- The volume of new commercial floor area in Indonesia is projected to witness a robust growth of around 58.72% by 2030 compared to 2023. This surge is driven by a rising demand for shopping malls, offices, and other commercial spaces. The retail real estate segment is emerging as a particularly captivating sector in the country. For instance, the volume of the commercial real estate market is anticipated to reach USD 1.39 trillion by 2028. The commercial new floor area in Indonesia is expected to maintain steady growth, registering a CAGR of 6.82% during the forecast period.
Increase in demand for housing units is likely to augment the residential sector's growth
- In 2022, Indonesia witnessed a 7.10% volume growth in residential new floor area compared to 2021. This surge can be attributed to increased population, wealth, and urbanization. The government-led housing aid reached IDR 29 trillion in 2022, which was projected to increase to IDR 32 trillion in 2023 under the Housing Financing Liquidity Facility scheme. This initiative aims to construct at least 220 thousand houses. The residential construction sector is poised to witness a significant growth rate. It was estimated to increase to approximately 56 million square feet in 2023 compared to the preceding year.
- In 2020, the volume of residential new floor areas in Indonesia grew by 7.06% compared to 2019. This was a strategic move by the government, prioritizing construction to mitigate the economic downturn and support households grappling with reduced incomes. Consequently, restrictions on construction activities, including quarantines, were significantly eased. However, in 2021, the trend reversed, with a decline of about 12.54% in residential new floor area, primarily attributed to a dip in foreign direct investment (FDI) in the construction sector. FDI for construction plummeted by 51% in 2021 compared to the previous year.
- The residential new floor area in Indonesia is projected to witness a CAGR of 6.08% in volume during the forecast period. This growth stems from the country's increasing urbanization, bolstered by government initiatives and foreign and domestic investments. These factors, directly and indirectly, underscore the mounting housing needs in the nation, ultimately driving residential building construction. Projections indicate that to meet the escalating demand, the country would require between 820,000 and 1 million housing units annually by 2030.
Indonesia Anchors and Grouts Industry Overview
The Indonesia Anchors and Grouts Market is fragmented, with the top five companies occupying 34.76%. The major players in this market are Fosroc, Inc., MAPEI S.p.A., MBCC Group, Saint-Gobain and Sika AG (sorted alphabetically).
Additional Benefits:
- The market estimate (ME) sheet in Excel format
- 3 months of analyst support
TABLE OF CONTENTS
1 EXECUTIVE SUMMARY & KEY FINDINGS
2 REPORT OFFERS
3 INTRODUCTION
- 3.1 Study Assumptions & Market Definition
- 3.2 Scope of the Study
- 3.3 Research Methodology
4 KEY INDUSTRY TRENDS
- 4.1 End Use Sector Trends
- 4.1.1 Commercial
- 4.1.2 Industrial and Institutional
- 4.1.3 Infrastructure
- 4.1.4 Residential
- 4.2 Major Infrastructure Projects (current And Announced)
- 4.3 Regulatory Framework
- 4.4 Value Chain & Distribution Channel Analysis
5 MARKET SEGMENTATION (includes market size, forecasts up to 2030 and analysis of growth prospects.)
- 5.1 End Use Sector
- 5.1.1 Commercial
- 5.1.2 Industrial and Institutional
- 5.1.3 Infrastructure
- 5.1.4 Residential
- 5.2 Sub Product
- 5.2.1 Cementitious Fixing
- 5.2.2 Resin Fixing
- 5.2.2.1 By Technology
- 5.2.2.1.1 Epoxy Grout
- 5.2.2.1.2 Polyurethane (PU) Grout
- 5.2.3 Other Types
6 COMPETITIVE LANDSCAPE
- 6.1 Key Strategic Moves
- 6.2 Market Share Analysis
- 6.3 Company Landscape
- 6.4 Company Profiles
- 6.4.1 Arkema
- 6.4.2 Deltacretindo
- 6.4.3 Fosroc, Inc.
- 6.4.4 LATICRETE International, Inc.
- 6.4.5 MAPEI S.p.A.
- 6.4.6 MBCC Group
- 6.4.7 Normet
- 6.4.8 Saint-Gobain
- 6.4.9 Sika AG
- 6.4.10 Ultrachem Construction Chemicals
7 KEY STRATEGIC QUESTIONS FOR CONCRETE, MORTARS AND CONSTRUCTION CHEMICALS CEOS
8 APPENDIX
- 8.1 Global Overview
- 8.1.1 Overview
- 8.1.2 Porter's Five Forces Framework (Industry Attractiveness Analysis)
- 8.1.3 Global Value Chain Analysis
- 8.1.4 Market Dynamics (DROs)
- 8.2 Sources & References
- 8.3 List of Tables & Figures
- 8.4 Primary Insights
- 8.5 Data Pack
- 8.6 Glossary of Terms
02-2729-4219
+886-2-2729-4219
 2025年全球聚氨酯注射服務市場報告2025年環氧水泥漿全球市場報告
 全球即用型水泥漿和黏合劑市場水泥基灌漿料市場機會、成長動力、產業趨勢分析及 2025 - 2034 年預測灌漿與錨固市場機會、成長動力、產業趨勢分析及 2025 - 2034 年預測美國屋頂錨固市場規模、佔有率和趨勢分析報告:按屋頂類型、最終用途和細分市場預測,2025-2033 年屋頂錨固市場規模、佔有率和趨勢分析報告(按屋頂類型、最終用途、地區和細分市場預測,2025 年至 2033 年)
 RTU薄漿和黏合劑市場:全球產業分析、市場規模、佔有率、成長、趨勢和未來預測(2025-2034年)
 水泥基水泥漿市場規模、佔有率、成長分析、應用、類型、最終用途、分銷管道和地區 - 產業預測,2025 年至 2032 年
 錨固和灌漿市場 - 全球產業規模、佔有率、趨勢、機會和預測,按錨固類型、灌漿類型、應用、最終用戶、地區、競爭進行細分,2020-2030 年預測
▼