


 |
市場調查報告書
商品編碼
1683777
亞太地區錨固水泥漿:市場佔有率分析、產業趨勢與統計、成長預測(2025-2030 年)Asia-Pacific Anchors and Grouts - Market Share Analysis, Industry Trends & Statistics, Growth Forecasts (2025 - 2030) |
||||||
價格
※ 本網頁內容可能與最新版本有所差異。詳細情況請與我們聯繫。
簡介目錄
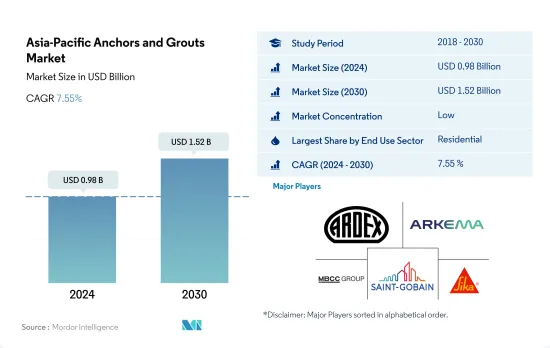
亞太地區錨固水泥漿市場規模預計在 2024 年為 9.8 億美元,預計到 2030 年將達到 15.2 億美元,預測期內(2024-2030 年)的複合年成長率為 7.55%。
預測期內工業和設施產業將以更快的速度成長
- 受訪的 2022 年市場需求下降了 1.5%,主要是由於終端用戶領域的建設活動減少。然而,預計 2023 年建築量將恢復,導致錨固水泥漿的需求與 2022 年相比激增 5.1%。
- 由於亞太地區人口眾多,住宅領域佔全球錨定水泥漿市場的一半以上。尤其是到 2022 年,光是中國就將佔該地區需求的 67%。需求是由這些產品的各種應用推動的,例如接縫填充、混凝土裂縫修復、結構加固等。
- 2022年,基礎設施領域將成為錨定水泥漿的第二大消費領域。該地區各國政府優先發展基礎設施,以促進經濟發展並吸引外商投資。例如,印度2022年的基礎建設支出將與前一年同期比較3.1%,符合2019年至2023年期間在基礎建設計劃上投資約1.4兆美元的計畫。
- 預計工業和機構部門的市值將實現最高成長,預測期內(2023-2030 年)的複合年成長率為 8.82%。這一成長是由製造工廠、教育機構和醫療中心等設施建設激增所推動的。這一趨勢是由城市人口的成長以及相對便宜的人事費用和土地成本的吸引力所驅動。例如,2023年,中國汽車製造商比亞迪公司宣佈在越南投資電動車製造和組裝。
預計日本對錨固水泥漿的需求量大。
- 錨固劑和水泥漿等建築化學品在提高建築物、橋樑和水壩等結構的穩定性、強度和壽命方面發揮著至關重要的作用。 2022 年亞太地區錨固水泥漿市場與 2021 年相比略有下降,下降幅度為 1.54%。中國下降幅度最大,2021 年至 2022 年錨定水泥漿市場價值暴跌 4.94%。下降的原因是政府嚴格的防疫政策導致建設活動關閉和停止。相比之下,澳洲則取得了令人矚目的成長,2021 年至 2022 年的金額成長率為 18.40%。
- 2022 年,中國在該地區的錨固水泥漿市場佔據主導地位,佔據 65% 的顯著市場佔有率。基礎設施投資的激增刺激了對錨固水泥漿的需求,尤其是在各個地區的建築項目中。中國在交通基礎設施方面的公共投資從 2021 年的 1,576 億美元增加到 2022 年的 1,656 億美元。基礎建設產業成為 2021-22 年唯一實現 5.60% 正成長的終端使用產業。
- 預計預測期內日本錨固水泥漿市場將以 8.09% 的最高複合年成長率成長。這一成長將由日本的工業和機構建設部門推動,預計該部門的複合年成長率為 9.23%。 2022年至2030年間,工業和機構建築的新占地面積預計將增加1.4億平方英尺,隨著企業將製造工廠遷至日本,需求預計會增加。預計這些因素將推動對錨固水泥漿的需求,尤其是在新生產單位的建設中。
亞太地區錨固和水泥漿市場趨勢
印度及其他地區零售和辦公空間不斷成長,推動亞太地區商業建築產業發展
- 2022年亞太地區新增零售占地面積與前一年同期比較3.23%。造成這項挫折的因素包括監管壓力、通膨上升和抵押房屋抵押貸款利率飆升。預計到 2023 年,該地區將實現復甦,新增商業占地面積約 1.46 億平方英尺。激增的主要原因是外國直接投資(FDI)增加,刺激了對新辦公室、倉庫、零售店和其他設施的需求。其中,越南建築業預計2023年將吸引7,144萬美元的外國直接投資。
- 2020 年,亞太地區新零售占地面積遭遇重大挫折,與 2019 年相比下降了 21.92%。下降的主要原因是政府大規模封鎖擾亂了計劃工作並嚴重影響了供應鏈、設施和勞動力。然而,隨著限制措施的放鬆,該地區出現了顯著的復甦,2021 年新建商業占地面積躍升 20.98%,達到約 5.26 億占地面積。
- 預計亞太地區新建商業占地面積將大幅成長,預計 2030 年將比 2023 年增加 14.1 億平方英尺。這一成長主要是由對購物中心、辦公空間和零售店的需求不斷成長所推動的。亞太地區已成為全球零售強區,貢獻了全球零售成長的近四分之三。例如,印度前七大城市的甲級辦公室市場到 2026 年可能會成長到 10 億平方英尺,到 2030 年可能會成長到 12 億平方英尺。整體而言,預測期內亞太地區新商業占地面積預計複合年成長率為 5.16%。
印度的經濟適用住宅將會增加,到 2030 年可能達到 2,500 萬套,該地區的住宅建設也將擴大。
- 2022年亞太地區住宅占地面積與前一年同期比較% 。在新冠疫情期間建築活動激增之後,該行業正在逐漸恢復正常,而這一數字出現下降。人口成長、富裕程度提高和都市化快速發展推動了該地區住宅產業的發展。預計 2023 年該地區新住宅占地面積將比 2022 年增加 4.1 億平方英尺。
- 2020年,亞太地區新建住宅占地面積較2019年減少約5.06%。這主要是由於政府封鎖、供應鏈中斷、勞動力短缺、建築生產力放緩以及外國投資低迷。然而,隨著限制措施的放鬆,該地區出現了強勁復甦,由於新建住宅增加,2021 年新住宅建築占地面積激增約 14 億平方英尺。例如,光是 2021 年,印度住宅房地產市場就會在前七大城市推出約 163,000 套住宅。
- 預測期內,亞太地區住宅新建占地面積預估複合年成長率為 3.98%。這一成長源於住宅需求、投資增加和政府優惠政策。重點建造更多經濟適用住宅有望振興該地區的住宅建築業並有助於其復甦。到 2030 年,預計印度 40% 以上的人口將居住在都市區,這將需要額外 2,500 萬套經濟適用住宅。預計需求激增將有助於印度住宅房地產市場在 2030 年達到 150 萬套。
亞太地區錨固和水泥漿產業概況
亞太地區錨固水泥漿市場較為分散,前五大公司佔了21.81%的市佔率。市場的主要企業是:Ardex Group、Arkema、MBCC Group、Saint-Gobain和Sika AG(按字母順序排列)。
其他福利
- Excel 格式的市場預測 (ME) 表
- 3 個月的分析師支持
目錄
第 1 章執行摘要和主要發現
第2章 報告要約
第 3 章 簡介
- 研究假設和市場定義
- 研究範圍
- 調查方法
第4章 產業主要趨勢
- 最終用途趨勢
- 商業的
- 業/設施
- 基礎設施
- 住宅
- 重大基礎建設計劃
- 法律規範
- 價值鏈與通路分析
第 5 章。市場區隔(包括市場規模、2030 年預測、成長前景分析)
- 最終用途領域
- 商業的
- 業/設施
- 基礎設施
- 住宅
- 子產品
- 水泥基固定材料
- 樹脂固定
- 依技術分類
- 環氧水泥漿
- 聚氨酯(PU)水泥漿
- 其他類型
- 國家
- 澳洲
- 中國
- 印度
- 印尼
- 日本
- 馬來西亞
- 韓國
- 泰國
- 越南
- 其他亞太地區
第6章 競爭格局
- 關鍵策略趨勢
- 市場佔有率分析
- 業務狀況
- 公司簡介
- Ardex Group
- Arkema
- Cemkrete Inter Co., Ltd
- Fosroc, Inc.
- LATICRETE International, Inc.
- MAPEI SpA
- MBCC Group
- RPM International Inc.
- Saint-Gobain
- Sika AG
第 7 章 CEO 需要回答的關鍵策略問題CEO 需要回答的關鍵策略問題
第 8 章 附錄
- 世界概況
- 概述
- 五力分析框架(產業吸引力分析)
- 全球價值鏈分析
- 市場動態(DRO)
- 資訊來源和進一步閱讀
- 圖片列表
- 關鍵見解
- 資料包
- 詞彙表
簡介目錄
Product Code: 93526
The Asia-Pacific Anchors and Grouts Market size is estimated at 0.98 billion USD in 2024, and is expected to reach 1.52 billion USD by 2030, growing at a CAGR of 7.55% during the forecast period (2024-2030).
Industrial and institutional sector to grow at a faster rate during the forecast period
- In 2022, the market studied witnessed a 1.5% decline in demand, primarily driven by a dip in construction activities across end-user sectors. However, the construction volume was projected to rebound in 2023, leading to a 5.1% surge in demand for anchors and grouts compared to 2022.
- The residential sector dominates the anchors and grouts market in Asia-Pacific, given its substantial population, accounting for over half of the global total. Notably, China alone represented 67% of the region's demand in 2022. The demand is fueled by various applications of these products, including joint filling, concrete crack repairs, and structural enhancements.
- In 2022, the infrastructure sector emerged as the second-largest consumer of anchors and grouts. Governments in the region prioritized infrastructure development to stimulate their economies and attract foreign investments. For instance, India's infrastructure spending in 2022 rose by 3.1% from the previous year, aligning with its plan to invest approximately USD 1.4 trillion in infrastructure projects between 2019 and 2023.
- During the forecast period (2023-2030), the industrial and institutional sector is projected to witness the highest growth in market value, boasting a CAGR of 8.82%. This surge can be attributed to the escalating construction of facilities like manufacturing plants, educational institutions, and healthcare centers. This trend is propelled by the expanding urban population and the appeal of relatively affordable labor and land costs. For instance, in 2023, Chinese automaker BYD Co. announced its investment in electric vehicle manufacturing and assembly in Vietnam.
High demand is forecasted for anchors and grouts in Japan as companies bring production units back home
- Construction chemicals like anchors and grouts play a crucial role in enhancing the stability, strength, and longevity of structures such as buildings, bridges, and dams. In 2022, the value of the anchors and grouts market in Asia-Pacific witnessed a slight decline of 1.54% compared to 2021. China experienced the sharpest downturn, with its anchors and grouts market value plummeting by 4.94% from 2021 to 2022. This decline can be attributed to the government's stringent zero-COVID policy, which led to lockdowns and halted construction activities. In contrast, Australia saw a remarkable upswing, registering a growth rate of 18.40% in value from 2021 to 2022.
- In 2022, China dominated the anchors and grouts market in the region, commanding a significant market share of 65% by value. The surge in infrastructure investments fueled the demand for anchors and grouts, especially in various regional construction ventures. China's public spending on transport infrastructure rose to USD 165.6 billion in 2022, up from USD 157.6 billion in 2021. The infrastructure construction segment emerged as the sole end-use sector in the country to witness a positive growth of 5.60% from 2021 to 2022.
- Japan's anchors and grouts market is projected to witness the highest CAGR of 8.09% during the forecast period. This growth can be attributed to the country's industrial and institutional construction sector, which is anticipated to witness a robust CAGR of 9.23%. There is an estimated surge of 140 million square feet in new floor area for I&I construction from 2022 to 2030, coupled with a trend of companies relocating their manufacturing facilities to Japan. These factors are expected to drive the demand for anchors and grouts, particularly in the construction of new production units.
Asia-Pacific Anchors and Grouts Market Trends
Rising retail and office spaces in countries such as India to boost the Asia-Pacific commercial construction sector
- In 2022, Asia-Pacific witnessed a 3.23% decline in its commercial new floor area compared to the previous year. This setback was attributed to factors such as regulatory pressures, higher inflation, and a surge in mortgage rates. In 2023, the region rebounded, with commercial construction new floor area increasing by approximately 146 million sq. ft. This surge was primarily driven by a rise in foreign direct investment (FDI), which spurred the demand for new offices, warehouses, retail outlets, and other facilities. Notably, the Vietnamese construction sector attracted an FDI capital of USD 71.44 million in 2023.
- In 2020, the Asia-Pacific region experienced a significant setback in commercial new floor area, with a volume decline of 21.92% compared to 2019. This decline was primarily due to widespread government lockdowns, which disrupted project work and severely impacted supply chains, equipment, and labor. However, as restrictions eased, the region witnessed a remarkable rebound, with its commercial new floor area surging by 20.98% in 2021, reaching a volume of approximately 526 million sq. ft.
- Asia-Pacific's commercial new floor area is projected to witness substantial growth, with an estimated increase of 1.41 billion sq. ft by 2030 compared to 2023. This surge is fueled by a rising demand for shopping malls, office spaces, retail outlets, and more. The Asia-Pacific region is emerging as a global retail powerhouse, contributing to nearly three-quarters of the worldwide retail growth. For instance, the Indian Grade A office market in its top seven cities may to expand to 1 billion sq. ft by 2026 and further to 1.2 billion sq. ft. by 2030. Overall, the commercial new floor area in Asia-Pacific is projected to witness a volume CAGR of 5.16% during the forecast period.
Rising affordable housing units, such as India's likely to reach 25 million by 2030, to augment the residential constructions in the region
- In 2022, the residential new floor area in the Asia-Pacific region saw a volume decline of approximately 5.39% from the previous year. This dip was a result of the sector normalizing after a surge in building activity during the COVID-19 pandemic. The region's residential sector is driven by a growing population, increasing wealth, and rapid urbanization. The residential new floor area in the region was expected to rise by 410 million sq. ft in 2023 compared to 2022.
- In 2020, the residential new floor area in Asia-Pacific declined in volume by around 5.06% compared to 2019. This was primarily due to government-imposed lockdowns, disruptions in the supply chain, labor shortages, reduced construction productivity, and low foreign investments. However, as restrictions eased, the region saw a significant rebound, with the residential new floor area surging by about 1.4 billion sq. ft in 2021, driven by the addition of new residential housing units. For instance, in 2021 alone, the Indian residential real estate market introduced approximately 163 thousand new residential units across its top seven cities.
- The residential new floor area in the Asia-Pacific region is projected to witness a CAGR of 3.98% during the forecast period. This growth can be attributed to the demand for housing, increased investments, and favorable government policies. The focus on constructing more affordable housing units is expected to rejuvenate the residential construction sector in the region, aiding its recovery. By 2030, it is estimated that over 40% of India's population will reside in urban areas, leading to a demand for an additional 25 million affordable housing units. This surge in demand is expected to push the Indian residential real estate market to reach 1.5 million units by 2030.
Asia-Pacific Anchors and Grouts Industry Overview
The Asia-Pacific Anchors and Grouts Market is fragmented, with the top five companies occupying 21.81%. The major players in this market are Ardex Group, Arkema, MBCC Group, Saint-Gobain and Sika AG (sorted alphabetically).
Additional Benefits:
- The market estimate (ME) sheet in Excel format
- 3 months of analyst support
TABLE OF CONTENTS
1 EXECUTIVE SUMMARY & KEY FINDINGS
2 REPORT OFFERS
3 INTRODUCTION
- 3.1 Study Assumptions & Market Definition
- 3.2 Scope of the Study
- 3.3 Research Methodology
4 KEY INDUSTRY TRENDS
- 4.1 End Use Sector Trends
- 4.1.1 Commercial
- 4.1.2 Industrial and Institutional
- 4.1.3 Infrastructure
- 4.1.4 Residential
- 4.2 Major Infrastructure Projects (current And Announced)
- 4.3 Regulatory Framework
- 4.4 Value Chain & Distribution Channel Analysis
5 MARKET SEGMENTATION (includes market size, forecasts up to 2030 and analysis of growth prospects.)
- 5.1 End Use Sector
- 5.1.1 Commercial
- 5.1.2 Industrial and Institutional
- 5.1.3 Infrastructure
- 5.1.4 Residential
- 5.2 Sub Product
- 5.2.1 Cementitious Fixing
- 5.2.2 Resin Fixing
- 5.2.2.1 By Technology
- 5.2.2.1.1 Epoxy Grout
- 5.2.2.1.2 Polyurethane (PU) Grout
- 5.2.3 Other Types
- 5.3 Country
- 5.3.1 Australia
- 5.3.2 China
- 5.3.3 India
- 5.3.4 Indonesia
- 5.3.5 Japan
- 5.3.6 Malaysia
- 5.3.7 South Korea
- 5.3.8 Thailand
- 5.3.9 Vietnam
- 5.3.10 Rest of Asia-Pacific
6 COMPETITIVE LANDSCAPE
- 6.1 Key Strategic Moves
- 6.2 Market Share Analysis
- 6.3 Company Landscape
- 6.4 Company Profiles
- 6.4.1 Ardex Group
- 6.4.2 Arkema
- 6.4.3 Cemkrete Inter Co., Ltd
- 6.4.4 Fosroc, Inc.
- 6.4.5 LATICRETE International, Inc.
- 6.4.6 MAPEI S.p.A.
- 6.4.7 MBCC Group
- 6.4.8 RPM International Inc.
- 6.4.9 Saint-Gobain
- 6.4.10 Sika AG
7 KEY STRATEGIC QUESTIONS FOR CONCRETE, MORTARS AND CONSTRUCTION CHEMICALS CEOS
8 APPENDIX
- 8.1 Global Overview
- 8.1.1 Overview
- 8.1.2 Porter's Five Forces Framework (Industry Attractiveness Analysis)
- 8.1.3 Global Value Chain Analysis
- 8.1.4 Market Dynamics (DROs)
- 8.2 Sources & References
- 8.3 List of Tables & Figures
- 8.4 Primary Insights
- 8.5 Data Pack
- 8.6 Glossary of Terms
02-2729-4219
+886-2-2729-4219
 2025年全球聚氨酯注射服務市場報告2025年環氧水泥漿全球市場報告
 全球即用型水泥漿和黏合劑市場水泥基灌漿料市場機會、成長動力、產業趨勢分析及 2025 - 2034 年預測灌漿與錨固市場機會、成長動力、產業趨勢分析及 2025 - 2034 年預測美國屋頂錨固市場規模、佔有率和趨勢分析報告:按屋頂類型、最終用途和細分市場預測,2025-2033 年屋頂錨固市場規模、佔有率和趨勢分析報告(按屋頂類型、最終用途、地區和細分市場預測,2025 年至 2033 年)
 RTU薄漿和黏合劑市場:全球產業分析、市場規模、佔有率、成長、趨勢和未來預測(2025-2034年)
 水泥基水泥漿市場規模、佔有率、成長分析、應用、類型、最終用途、分銷管道和地區 - 產業預測,2025 年至 2032 年
 錨固和灌漿市場 - 全球產業規模、佔有率、趨勢、機會和預測,按錨固類型、灌漿類型、應用、最終用戶、地區、競爭進行細分,2020-2030 年預測
▼