


 |
市場調查報告書
商品編碼
1684064
環氧水泥漿:市場佔有率分析、產業趨勢與統計、成長預測(2025-2030)Epoxy Grout - Market Share Analysis, Industry Trends & Statistics, Growth Forecasts (2025 - 2030) |
||||||
價格
※ 本網頁內容可能與最新版本有所差異。詳細情況請與我們聯繫。
簡介目錄
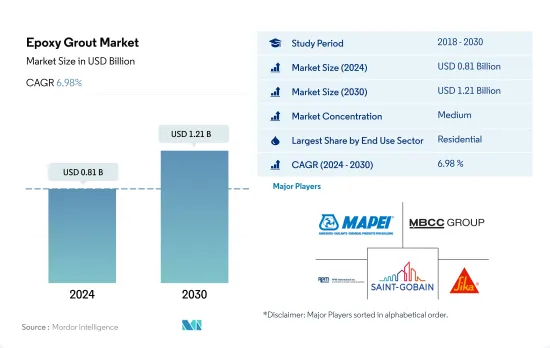
環氧水泥漿市場規模預計在 2024 年為 8.1 億美元,預計到 2030 年將達到 12.1 億美元,預測期內(2024-2030 年)的複合年成長率為 6.98%。
經濟適用住宅需求的增加預計將推動環氧水泥漿市場的發展
- 受住宅和基礎設施建設領域需求成長的以金額為準,預計 2022 年全球環氧水泥漿消費量將成長 2.49%。預計到 2023 年,環氧水泥漿將佔全球錨定水泥漿市場的約 40.78%。
- 據估計,到2023年,住宅領域將成為全球最大的環氧水泥漿消費領域。都市化、政府措施、國內和國際投資是推動全球住宅需求的因素之一。到 2030 年,預計印度將有超過 40% 的人口居住在都市區,這將需要約 2,500 萬套經濟適用住宅。因此,預計 2023 年至 2030 年間,住宅領域的環氧水泥漿消費量將增加 1.35 億美元。
- 預計全球市場的工業和設施部門在預測期內(2023-2030 年)環氧水泥漿消費量將呈現最高的複合年成長率,為 7.75%。對新工業建築的投資正在推動這一成長,預計到 2026 年,美國的支出將達到 650 億美元。此外,預計到 2030 年,全球工業占地面積將成長 3.09%,這主要得益於不斷成長的倉儲需求。例如,預計到 2030 年,印度的倉儲空間將達到 5 億平方英尺。因此,預計到 2030 年,全球工業和機構部門的環氧水泥漿消費量將達到 2.49 億美元,高於 2023 年的 1.47 億美元。
由於中國和印度等龐大的成長市場,亞太地區很可能主導全球環氧水泥漿市場。
- 2022年,全球環氧水泥漿需求預計與前一年同期比較增加1,740萬美元。這種成長歸因於其比其他水泥漿類型更受歡迎,因為它具有更好的抗污漬、防水和抗化學品性能。歐洲的成長最為顯著,2022 年環氧水泥漿的需求量較 2021 年增加了 1,250 萬美元。預計 2023 年商業市場對環氧水泥漿的需求將再增加 1,000 萬美元。
- 以中國主導的亞太地區將主導全球環氧水泥漿市場,到2022年將佔全球需求的31%。日本和印度也發揮了關鍵作用,當年貢獻了該地區18%的需求。尤其是日本,預計需求成長最快,2023 年至 2030 年的複合年成長率為 8.4%。
- 歐洲是世界第二大環氧水泥漿消費國。德國、法國和英國將成為主要參與者,到 2022 年,它們將總合佔據該地區 40% 的需求佔有率。在歐洲,住宅和商業部門推動了 60% 以上的水泥漿需求。預計義大利將成為該地區成長最快的國家,預測期內複合年成長率為 6.23%。
- 預計日本、中國、韓國和印度等國家將見證亞太地區環氧水泥漿需求的最高成長率。因此,預計亞太地區的需求將成長最快,預測期內以金額為準年成長率為 8.35%。
全球環氧水泥漿市場趨勢
亞太地區大型辦公大樓建設計劃激增,帶動全球專用商業建築占地面積增加
- 2022年,全球新建商業建築占地面積將與前一年同期比較去年小幅成長0.15%。歐洲表現突出,增幅達 12.70%,這得益於歐洲大力推行節能辦公大樓,以實現 2030 年二氧化碳排放目標。隨著員工重返辦公室,歐洲公司正在重新簽訂租約,刺激 2022 年新辦公大樓建設面積達到 450 萬平方英尺。預計這一勢頭將在 2023 年持續下去,全球成長率預計為 4.26%。
- 新冠疫情造成勞動力和材料短缺,導致商業建築計劃取消和延遲。然而,隨著停工緩解和建設活動恢復,2021 年全球新增商業占地面積飆升 11.11%,其中亞太地區以 20.98% 的成長率領先。
- 展望未來,全球新增商業占地面積的複合年成長率將達到4.56%。預計亞太地區的複合年成長率將達到 5.16%,超過其他地區。這一成長背後的驅動力是中國、印度、韓國和日本商業設施建設計劃的活性化。尤其北京、上海、香港、台北等中國主要城市的甲級辦公室建設正在加速。此外,印度計劃於 2023 年至 2025 年間在七大城市開設約 60 家購物中心,總面積約 2,325 萬平方英尺。總合到 2030 年,亞太地區的這些措施將比 2022 年增加 15.6 億平方英尺的新零售占地面積。
預計南美洲的住宅將出現最快的成長,這得益於政府加大對經濟適用住宅計畫的投資,這將推動全球住宅產業的發展。
- 2022年,全球新建住宅占地面積與2021年相比減少了約2.89億平方英尺。這是由於土地稀缺、勞動力短缺以及建築材料價格不永續的高企造成的住宅危機。這場危機對亞太地區造成了嚴重影響,2022 年新占地面積與 2021 年相比下降了 5.39%。不過,2023 年的前景更加光明,預計全球新建占地面積將比 2022 年成長 3.31%,這要歸功於政府投資,這些投資可以為 2030 年之前 30 億人建造新的經濟適用住宅提供資金。
- 新冠疫情造成經濟放緩,導致大量住宅建設計劃取消或延後,2020年全球新建占地面積較2019年下降4.79%。隨著2021年限制措施的解除,住宅計劃被壓抑的需求得到釋放,2021年全球新建占地面積較2020年成長11.22%,其中歐洲增幅最高,為18.28%,其次是南美洲,2021年較2020年成長17.36%。
- 預測期內,全球住宅新占地面積預計複合年成長率為 3.81%,其中南美洲的複合年成長率最快,為 4.05%。巴西宣布將於 2023 年實施「Minha Casa Minha Vida」等計劃和舉措,同時還將進行多項監管改革,政府計劃投資 19.8 億美元為低收入家庭提供經濟適用住宅;智利也宣布將於 2023 年實施「FOGAES」等計劃和舉措,旨在為家庭提供經濟適用住宅房屋抵押貸款,這些計劃和建設舉措將刺激新住宅的建設舉措。
環氧水泥漿行業概況
環氧水泥漿市場適度整合,前五大公司佔據51.94%的市佔率。該市場的主要企業有:MAPEI SpA、MBCC Group、RPM International Inc.、Saint-Gobain 和 Sika AG(按字母順序排列)。
其他福利
- Excel 格式的市場預測 (ME) 表
- 3個月的分析師支持
目錄
第1章執行摘要和主要發現
第2章 報告要約
第3章 引言
- 研究假設和市場定義
- 研究範圍
- 調查方法
第4章 產業主要趨勢
- 最終用途趨勢
- 商業
- 工業/設施
- 基礎設施
- 住宅
- 重大基礎設施計劃(目前和已宣布)
- 法律規範
- 價值鍊和通路分析
第5章市場區隔
- 最終用途部門
- 商業
- 工業/設施
- 基礎設施
- 住宅
- 地區
- 亞太地區
- 按國家
- 澳洲
- 中國
- 印度
- 印尼
- 日本
- 馬來西亞
- 韓國
- 泰國
- 越南
- 其他亞太地區
- 歐洲
- 按國家
- 法國
- 德國
- 義大利
- 俄羅斯
- 西班牙
- 英國
- 其他歐洲國家
- 中東和非洲
- 按國家
- 沙烏地阿拉伯
- 阿拉伯聯合大公國
- 其他中東和非洲地區
- 北美洲
- 按國家
- 加拿大
- 墨西哥
- 美國
- 南美洲
- 按國家
- 阿根廷
- 巴西
- 南美洲其他地區
- 亞太地區
第6章競爭格局
- 關鍵策略趨勢
- 市場佔有率分析
- 商業狀況
- 公司簡介
- Ardex Group
- Arkema
- Don Construction Products Ltd.
- Five Star Products, Inc.
- LATICRETE International, Inc.
- MAPEI SpA
- MBCC Group
- RPM International Inc.
- Saint-Gobain
- Sika AG
第 7 章 CEO 的關鍵策略問題CEO 的關鍵策略問題
第 8 章 附錄
- 世界概況
- 概述
- 五力分析框架(產業吸引力分析)
- 全球價值鏈分析
- 市場動態(DRO)
- 資訊來源及延伸閱讀
- 圖片列表
- 關鍵見解
- 資料包
- 詞彙表
簡介目錄
Product Code: 50002017
The Epoxy Grout Market size is estimated at 0.81 billion USD in 2024, and is expected to reach 1.21 billion USD by 2030, growing at a CAGR of 6.98% during the forecast period (2024-2030).
A rise in demand for affordable housing units is expected to drive the epoxy grout market
- The global consumption of epoxy grouts saw a 2.49% growth in terms of value in 2022, driven by rising demand from the residential and infrastructure construction sectors. Epoxy grouts were projected to make up approximately 40.78% of the global anchors and grouts market in 2023.
- In 2023, the residential sector was estimated to be the largest consumer of epoxy grouts globally. Factors such as urbanization, government initiatives, and investments, both domestic and foreign, are fueling the need for housing worldwide. By 2030, it is estimated that over 40% of India's population will reside in urban areas, leading to a demand for around 25 million affordable housing units. As a result, the consumption of epoxy grouts in the residential sector is projected to rise by USD 135 million from 2023 to 2030.
- The industrial and institutional sector of the global market is anticipated to exhibit the highest CAGR of 7.75% in terms of the consumption of epoxy grouts during the forecast period (2023-2030). Investments in new industrial buildings, like the projected USD 65 billion spending in the United States by 2026, are driving this growth. Additionally, the global industrial floor area is expected to rise by 3.09% in 2030, largely due to an uptick in warehousing needs. For instance, India's warehousing space is anticipated to reach 500 million sq. ft by 2030. As a result, the global consumption of epoxy grouts from the industrial and institutional sector is estimated to reach USD 249 million in 2030, up from USD 147 million in 2023.
Owing to its huge and growing markets, such as China and India, Asia-Pacific may dominate the global epoxy grout market
- In 2022, the global demand for epoxy grouts witnessed a USD 17.4 million surge compared to the previous year. This uptick can be attributed to their growing preference over other grout types, owing to their superior resistance to stains, water, and chemicals. Europe saw the most significant surge, with the demand for epoxy grouts rising by USD 12.5 million in 2022 compared to 2021. The commercial sector of the market was projected to drive an additional USD 10 million surge in demand for epoxy grouts in 2023.
- Asia-Pacific, led by China, dominates the global epoxy grout market, accounting for 31% of the demand in 2022. Japan and India also played pivotal roles, collectively contributing to 18% of the regional demand in the same year. Notably, Japan is projected to witness the highest growth in demand, with a CAGR of 8.4% from 2023 to 2030.
- Europe stands as the second-largest consumer of epoxy grouts globally. Germany, France, and the United Kingdom emerged as key players, collectively representing a 40% share of the regional demand in 2022. In Europe, the residential and commercial sectors drive over 60% of the grout demand. Italy is set to witness the most rapid growth in the region, with a projected CAGR of 6.23% during the forecast period.
- Countries like Japan, China, South Korea, and India are expected to witness the highest growth rates in terms of the demand for epoxy grouts in Asia-Pacific. As a result, Asia-Pacific is projected to experience the swiftest surge in demand, with a CAGR of 8.35% in terms of value during the forecast period.
Global Epoxy Grout Market Trends
Asia-Pacific's surge in large-scale office building projects is set to elevate the global floor area dedicated to commercial construction
- In 2022, the global new floor area for commercial construction witnessed a modest growth of 0.15% from the previous year. Europe stood out with a significant surge of 12.70%, driven by a push for high-energy-efficient office buildings to align with its 2030 carbon emission targets. As employees returned to offices, European companies, resuming lease decisions, spurred the construction of 4.5 million square feet of new office space in 2022. This momentum is poised to persist in 2023, with a projected global growth rate of 4.26%.
- The COVID-19 pandemic caused labor and material shortages, leading to cancellations and delays in commercial construction projects. However, as lockdowns eased and construction activities resumed, the global new floor area for commercial construction surged by 11.11% in 2021, with Asia-Pacific taking the lead with a growth rate of 20.98%.
- Looking ahead, the global new floor area for commercial construction is set to achieve a CAGR of 4.56%. Asia-Pacific is anticipated to outpace other regions, with a projected CAGR of 5.16%. This growth is fueled by a flurry of commercial construction projects in China, India, South Korea, and Japan. Notably, major Chinese cities like Beijing, Shanghai, Hong Kong, and Taipei are gearing up for an uptick in Grade A office space construction. Additionally, India is set to witness the opening of approximately 60 shopping malls, spanning 23.25 million square feet, in its top seven cities between 2023 and 2025. Collectively, these endeavors across Asia-Pacific are expected to add a staggering 1.56 billion square feet to the new floor area for commercial construction by 2030, compared to 2022.
South America's estimated fastest growth in residential constructions due to increasing government investments in schemes for affordable housing to boost the global residential sector
- In 2022, the global new floor area for residential construction declined by around 289 million square feet compared to 2021. This can be attributed to the housing crisis generated due to the shortage of land, labor, and unsustainably high construction materials prices. This crisis severely impacted Asia-Pacific, where the new floor area declined 5.39% in 2022 compared to 2021. However, a more positive outlook is expected in 2023 as the global new floor area is predicted to grow by 3.31% compared to 2022, owing to government investments that can finance the construction of new affordable homes capable of accommodating 3 billion people by 2030.
- The COVID-19 pandemic caused an economic slowdown, due to which many residential construction projects got canceled or delayed, and the global new floor area declined by 4.79% in 2020 compared to 2019. As the restrictions were lifted in 2021 and pent-up demand for housing projects was released, new floor area grew 11.22% compared to 2020, with Europe having the highest growth of 18.28%, followed by South America, which rose 17.36% in 2021 compared to 2020.
- The global new floor area for residential construction is expected to register a CAGR of 3.81% during the forecast period, with South America predicted to develop at the fastest CAGR of 4.05%. Schemes and initiatives like the Minha Casa Minha Vida in Brazil announced in 2023 with a few regulatory changes, for which the government plans an investment of USD 1.98 billion to provide affordable housing units for low-income families, and the FOGAES in Chile also publicized in 2023, with an initial investment of USD 50 million, are aimed at providing mortgage loans to families for affordable housing and will encourage the construction of new residential units.
Epoxy Grout Industry Overview
The Epoxy Grout Market is moderately consolidated, with the top five companies occupying 51.94%. The major players in this market are MAPEI S.p.A., MBCC Group, RPM International Inc., Saint-Gobain and Sika AG (sorted alphabetically).
Additional Benefits:
- The market estimate (ME) sheet in Excel format
- 3 months of analyst support
TABLE OF CONTENTS
1 EXECUTIVE SUMMARY & KEY FINDINGS
2 REPORT OFFERS
3 INTRODUCTION
- 3.1 Study Assumptions & Market Definition
- 3.2 Scope of the Study
- 3.3 Research Methodology
4 KEY INDUSTRY TRENDS
- 4.1 End Use Sector Trends
- 4.1.1 Commercial
- 4.1.2 Industrial and Institutional
- 4.1.3 Infrastructure
- 4.1.4 Residential
- 4.2 Major Infrastructure Projects (current And Announced)
- 4.3 Regulatory Framework
- 4.4 Value Chain & Distribution Channel Analysis
5 MARKET SEGMENTATION (includes market size, forecasts up to 2030 and analysis of growth prospects.)
- 5.1 End Use Sector
- 5.1.1 Commercial
- 5.1.2 Industrial and Institutional
- 5.1.3 Infrastructure
- 5.1.4 Residential
- 5.2 Region
- 5.2.1 Asia-Pacific
- 5.2.1.1 By Country
- 5.2.1.1.1 Australia
- 5.2.1.1.2 China
- 5.2.1.1.3 India
- 5.2.1.1.4 Indonesia
- 5.2.1.1.5 Japan
- 5.2.1.1.6 Malaysia
- 5.2.1.1.7 South Korea
- 5.2.1.1.8 Thailand
- 5.2.1.1.9 Vietnam
- 5.2.1.1.10 Rest of Asia-Pacific
- 5.2.2 Europe
- 5.2.2.1 By Country
- 5.2.2.1.1 France
- 5.2.2.1.2 Germany
- 5.2.2.1.3 Italy
- 5.2.2.1.4 Russia
- 5.2.2.1.5 Spain
- 5.2.2.1.6 United Kingdom
- 5.2.2.1.7 Rest of Europe
- 5.2.3 Middle East and Africa
- 5.2.3.1 By Country
- 5.2.3.1.1 Saudi Arabia
- 5.2.3.1.2 United Arab Emirates
- 5.2.3.1.3 Rest of Middle East and Africa
- 5.2.4 North America
- 5.2.4.1 By Country
- 5.2.4.1.1 Canada
- 5.2.4.1.2 Mexico
- 5.2.4.1.3 United States
- 5.2.5 South America
- 5.2.5.1 By Country
- 5.2.5.1.1 Argentina
- 5.2.5.1.2 Brazil
- 5.2.5.1.3 Rest of South America
- 5.2.1 Asia-Pacific
6 COMPETITIVE LANDSCAPE
- 6.1 Key Strategic Moves
- 6.2 Market Share Analysis
- 6.3 Company Landscape
- 6.4 Company Profiles
- 6.4.1 Ardex Group
- 6.4.2 Arkema
- 6.4.3 Don Construction Products Ltd.
- 6.4.4 Five Star Products, Inc.
- 6.4.5 LATICRETE International, Inc.
- 6.4.6 MAPEI S.p.A.
- 6.4.7 MBCC Group
- 6.4.8 RPM International Inc.
- 6.4.9 Saint-Gobain
- 6.4.10 Sika AG
7 KEY STRATEGIC QUESTIONS FOR CONCRETE, MORTARS AND CONSTRUCTION CHEMICALS CEOS
8 APPENDIX
- 8.1 Global Overview
- 8.1.1 Overview
- 8.1.2 Porter's Five Forces Framework (Industry Attractiveness Analysis)
- 8.1.3 Global Value Chain Analysis
- 8.1.4 Market Dynamics (DROs)
- 8.2 Sources & References
- 8.3 List of Tables & Figures
- 8.4 Primary Insights
- 8.5 Data Pack
- 8.6 Glossary of Terms
02-2729-4219
+886-2-2729-4219
 2025年全球聚氨酯注射服務市場報告2025年環氧水泥漿全球市場報告
 全球即用型水泥漿和黏合劑市場水泥基灌漿料市場機會、成長動力、產業趨勢分析及 2025 - 2034 年預測灌漿與錨固市場機會、成長動力、產業趨勢分析及 2025 - 2034 年預測美國屋頂錨固市場規模、佔有率和趨勢分析報告:按屋頂類型、最終用途和細分市場預測,2025-2033 年屋頂錨固市場規模、佔有率和趨勢分析報告(按屋頂類型、最終用途、地區和細分市場預測,2025 年至 2033 年)
 RTU薄漿和黏合劑市場:全球產業分析、市場規模、佔有率、成長、趨勢和未來預測(2025-2034年)
 水泥基水泥漿市場規模、佔有率、成長分析、應用、類型、最終用途、分銷管道和地區 - 產業預測,2025 年至 2032 年
 錨固和灌漿市場 - 全球產業規模、佔有率、趨勢、機會和預測,按錨固類型、灌漿類型、應用、最終用戶、地區、競爭進行細分,2020-2030 年預測
▼