

 |
市場調查報告書
商品編碼
1644818
歐洲報關:市場佔有率分析、產業趨勢與成長預測(2025-2030 年)Europe Customs Brokerage - Market Share Analysis, Industry Trends & Statistics, Growth Forecasts (2025 - 2030) |
||||||
※ 本網頁內容可能與最新版本有所差異。詳細情況請與我們聯繫。
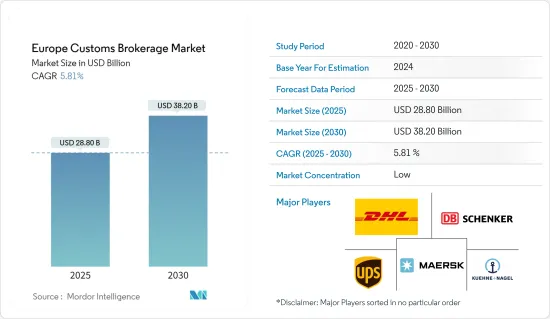
2025 年歐洲報關市場規模預計為 288 億美元,預計到 2030 年將達到 382 億美元,預測期內(2025-2030 年)的複合年成長率為 5.81%。
關鍵亮點
- 2023年第三季度,歐盟商品進出口額與2023年第一季相比分別下降4.6%(年比)和1.2%(年比)。歐盟商品出口連續第三個季度下降,進口連續第四個季度下降。
- 歐盟貿易順差仍約180億歐元(197.5億美元),高於2021年第三季的69億歐元(75.7億美元)順差。
- 2023 年第三季其他製成品進口額與去年同期相比下降了 66 億歐元(72.4 億美元),其次是機械和車輛進口額與去年同期相比下降了 66 億歐元(72.4 億美元),其次是機械和車輛進口額 62 億歐元(68 億美元)和能源進口額 47 億歐元(51.6 億美元)。
- 機械與車輛類出口下降 69 億歐元(75.7 億美元),其他製成品類出口下降 27 億歐元(29.6 億美元)。同時,能源和化學品分別增加了 34 億歐元(37.3 億美元)和 32 億歐元(35.1 億美元)。
- 能源產業的虧損自 2022 年第三季以來一直呈下降趨勢,當時創下 -1,938 億歐元(2,126.5 億美元)的歷史最低水準。這背後的主要因素是2023年第三季能源價格的下跌,導致虧損下降。
歐洲報關市場趨勢
德國推動市場成長
- 德國是歐洲最大經濟體、世界第四大經濟體,也是世界第三大生產國。
- 經日曆年和季節性調整後,2022 年 9 月德國商品出口額為 1,265 億歐元(1,386.3 億美元),商品進口額為 1,100 億歐元(1,205.5 億美元)。
- 2022 年 9 月貿易順差為 165 億歐元,而 2022 年 8 月順差為 177 億歐元(194 億美元),2022 年 9 月順差為 50 億歐元(54.8 億美元)。
- 2023年9月,德國對歐盟成員國的出口額為698億歐元,從歐盟成員國的進口額為587億歐元(641.9億美元)。經季節性已調整的和日曆年調整後,對歐盟國家的出口與2023年8月相比下降2.1%,進口下降2.6%。
- 2023年9月,對歐元區國家的出口為488億歐元(534.8億美元)(下降2.4%),從歐元區國家的進口為389億歐元(426.3億美元)(下降3.4%)。同時,歐盟內部出口額為 209 億歐元(229 億美元)(下降 1.3%),而從歐元區以外進口額為 198 億歐元(217 億美元)(下降 0.2%)。
- 2022 年 9 月,對歐盟以外第三國的商品出口額為 567 億歐元(621.4 億美元),經日曆和季節性調整後的進口額為 513 億歐元(562.2 億美元)。與 2022 年 8 月相比,第三國出口下降 28 億歐元(30.7 億美元),進口下降 6 億歐元(6.6 億美元)。
- 德國出口的大部分產品銷往美國。經過季節性和日曆年調整後,對美國的商品出口與2022年8月相比下降了40億歐元(43.8億美元),而對美國的出口則下降至128億歐元(135.7億美元)。對華商品出口下降 73 億歐元(80 億美元),至 77 億歐元(84.4 億美元)。同時,對英國的出口增加了 23 億歐元(23 億美元),達到 67 億歐元(73.4 億美元)。
- 2023 年 9 月,中華人民共和國佔進口額的大部分,金額130 億歐元(142.5 億美元)。經日曆和季節性調整後,銷售額較上月下降 7 億歐元(7.7 億美元)。美國增加了 5 億歐元(5.5 億美元),達到 77 億歐元(84.4 億美元)。
- 英國增加了 52 億歐元(57 億美元),達到 32 億歐元(35.1 億美元)。同時,2023 年 9 月,從俄羅斯聯邦的進口減少了 112 億歐元(122.7 億美元),而上個月則減少了 114 億歐元(124.9 億美元)。對俄羅斯的出口較上月下降了 417 億歐元(457 億美元)。同時,自俄羅斯的進口額比上季增加了75億歐元(82.2億美元),但季減了894億歐元(979.7億美元)。
遠洋運輸佔據市場主導地位
- 航運長期以來一直是歐洲經濟成長和繁榮的主要動力。海上運輸促進了歐洲各國之間的貿易和聯繫。能源、糧食和商品供應受到保障,海運是歐盟內部和外部進出口的主要方式。
- 海上運輸佔歐盟對外貨運貿易的近90%,短程海運佔歐盟內部貿易噸公里數的三分之一。良好的海上運輸服務對於歐洲島嶼和周邊海域的生活品質至關重要。
- 每年有超過4億乘客經過歐洲港口。總體而言,航運業為歐洲經濟提供了就業和收入。
- 2022年歐洲港口的貨物吞吐量將為35億噸,略高於2021年(與前一年同期比較-0.8%)。 2020 年可能因疫情以及歐盟和全球的限制而大幅下降,2022 年的水準略低於 2018 年。
- 歐洲港口貨運活動自2014年以來呈現正面趨勢,標誌著2009年經濟危機後略有復甦。與 2020 年同期相比,2021 年第一季出現下降,隨後 2021 年後三個季度和 2022 年前兩個季度出現顯著成長。然而,2022 年最後兩季的活動有所下降,第三季年減 -0.1%,第四季下降 -2.2%。
- 在海運方面,荷蘭將在2022年維持歐洲最大海運國的地位,其他七個歐洲最大港口分別是鹿特丹(荷蘭)、安特衛普(布魯日)、漢堡(漢堡)、阿姆斯特丹(阿姆斯特丹-慕尼黑)、阿爾赫西拉斯(Harpo[2])和馬賽(馬賽)。
- 以海運貨運量佔人口比例來看,歐盟成員國範圍從 2022 年荷蘭的 33.3 TfC 到波蘭(羅馬尼亞)的 3.2 TfC 以及歐盟平均水準的 7.8 TfC。不過,在 2022 年向歐盟統計局報告海事資料的國家中,歐洲自由貿易聯盟成員國挪威的比例最高(39.4 TfC)。
歐洲報關產業概況
歐洲報關市場依其性質分為多個部分。市場上報關行眾多,競爭激烈。市場的主要企業包括 DHL Logistics、馬士基物流、Kuehne and Nagel Logistics、聯合包裹服務公司和 DB Schenker。
這些公司建立了良好的聲譽並擁有廣泛的客戶和合作夥伴網路。他們通常也擁有豐富的歐洲國家清關程序經驗,因此是企業的可靠選擇。
其他福利
- Excel 格式的市場預測 (ME) 表
- 3 個月的分析師支持
目錄
第 1 章 簡介
- 研究假設和市場定義
- 市場覆蓋
第2章調查方法
第3章執行摘要
第4章 市場洞察
- 當前市場狀況
- 政府措施和法規
- 供應鏈/價值鏈分析
- 貨物運輸中的通關中介功能概述
- 海關定價概覽
- 了解終端用戶產業的海關服務
- COVID-19 對市場的影響
第5章 市場動態
- 驅動程式
- 國際貿易成長
- 複雜的海關法規
- 限制因素
- 監管挑戰
- 地緣政治不確定性
- 機會
- 電子商務繁榮
- 技術進步
- 產業吸引力-波特五力分析
- 供應商的議價能力
- 消費者議價能力
- 新進入者的威脅
- 競爭威脅
- 競爭對手之間的競爭
第6章 市場細分
- 按交通方式
- 海上
- 空運
- 跨境陸路運輸
- 按地區
- 德國
- 英國
- 法國
- 荷蘭
- 義大利
- 歐洲其他地區
第7章 競爭格局
- 市場集中度概覽
- 公司簡介
- DHL Group Logistics
- DB Schenker
- Kuehne and Nagel
- Maersk Logistics
- United Parcel Services
- FedEx
- Rhenus Logistics
- Gerlach Customs
- APL Logistics
- Gaston Schul Logistics*
第 8 章:市場的未來
第 9 章 附錄
- 總體經濟指標
- 資本流動洞察
- 進出口統計
The Europe Customs Brokerage Market size is estimated at USD 28.80 billion in 2025, and is expected to reach USD 38.20 billion by 2030, at a CAGR of 5.81% during the forecast period (2025-2030).
Key Highlights
- The volume of EU goods exports and imports decreased in Q3 2023, with a decrease of 4.6% (YoY) and 1.2% (RuY), respectively, compared to Q1 2023. The volume of EU exports in goods decreased for a third consecutive quarter, while imports decreased for a fourth consecutive quarter.
- The surplus in the EU's trade balance remained at around EUR 18 billion (USD 19.75 billion), with a surplus of EUR 6.9 billion (USD 7.57 billion)recorded in Q3 2021.
- Other manufactured goods imports decreased by EUR 6.6 billion (USD 7.24 billion) in the Q3 of 2023 compared to the Q2 of 2023, followed by machinery and vehicles at EUR 6.2 billion(USD 6.80 billion) and energy at EUR 4.7 billion(USD 5.16 billion).
- Exports decreased in the machinery and vehicles group by EUR 6.9 billion (USD 7.57 billion) and in the other manufactured goods group by EUR 2.7 billion(USD 2.96 billion). At the same time, energy and chemicals increased by EUR 3.4 billion (USD 3.73 billion) and EUR 3.2 billion(USD 3.51 billion), respectively.
- In the energy sector, the trade deficit has been on a declining trend since Q3 of 2022, when it reached a record low of -EUR 193.8 billion (USD 212.65 billion). The main reason for this was falling energy prices in Q3 of 2023, which contributed to the decrease in the trade deficit.
Europe Customs Brokerage Market Trends
Germany Driving the Growth of the Market
- In addition to having the biggest economy in Europe and the fourth-largest economy in the world, Germany is the third-largest producer in the world.
- After adjusting for calendar and seasonality, the volume of goods exported by Germany totaled EUR 126,5 billion (USD 138.63 billion), and the volume of goods imported totaled EUR 110,0 billion (USD 120.55 billion) in September 2022.
- The trade balance recorded a surplus of EUR 16,5 billion in September 2022 compared with a surplus of EUR 17,7 billion (USD 19.40 billion) recorded in August 2022 and EUR 5,0 billion (USD 5.48 billion) recorded in September 2022.
- Germany exported goods to the EU Member States in September 2023 worth EUR 69.8 billion while importing goods from these countries worth EUR 58.7 billion (USD 64.19 billion). Calendar and seasonally adjusted, exports to EU countries decreased by 2.1%, while imports decreased by 2.6% compared to August 2023.
- In September 2023, the value of goods exported to euro-zone countries totaled EUR 48.8 billion (USD 53.48 billion) (-2.4%), while the value of goods imported from euro-area countries totaled EUR 38.9 billion (USD 42.63 billion) (-3.4%). On the other hand, goods to the EU were exported worth EUR 20.9 billion (USD 22.90 billion) (-1.3%), while the value of imports from non-euro-zone countries was EUR 19.8 billion (USD 21.70 billion) (-0.2%).
- The volume of goods exported to third countries outside the European Union (EU) totaled EUR 56.7 billion (USD 62.14 billion in September 2022, while imports totaled EUR 51.3 billion (USD 56.22 billion), both calendar- and seasonally-adjusted. Compared to August 2022, third-country exports decreased by EUR 2,8 billion (USD 3.07 billion), while imports decreased by EUR 0,6 billion (USD 0.66 billion).
- The majority of German exports were made to the United States. After adjusting for seasonal and calendar adjustments, the value of goods exports to the US decreased by EUR 4,0 billion (USD 4.38 billion) compared to August 2022, with exports to the US dropping to EUR 12.8 billion (USD 13.57 billion). The volume of goods exports to China decreased by EUR 7.3 billion (USD 8 billion) to EUR 7.7 billion (USD 8.44 billion). In contrast, exports to the UK increased by EUR 2.3 billion (USD 2.3 billion) to EUR 6.7 billion (USD 7.34 billion).
- In September 2023, the People's Republic of China accounted for the majority of imports, with goods valued at EUR 13,0 billion (USD 14.25 billion). After calendar and seasonal adjustments, this represents a decrease of EUR 0.7 billion (USD 0.77 billion) compared to the previous month. The United States increased imports by EUR 0.5 billion (USD 0.55 billion) to EUR 7.7 billion (USD 8.44 billion).
- The United Kingdom increased imports by EUR 5.2 billion (USD 5.70 Billion) to EUR 3,2 billion (USD 3.51 billion) in the same month. On the other hand, imports from the Russian Federation decreased by EUR 11.2 billion (USD 12.27 billion) in September 2023, compared to a decrease of EUR 11.4 billion (USD 12.49 billion) in the month before. Compared to the month before, exports to Russia decreased by EUR 41.7 billion (USD 45.70 billion). At the same time, imports from Russia increased by EUR 7.5 billion (USD 8.22 billion) from the month before and decreased by EUR 89.4 billion (USD 97.97 billion) compared to the month before.
Sea Transport Dominates the Market
- Shipping has long been a key driver of economic growth and prosperity for Europe. Maritime Transport facilitates trade and links between all European countries. Energy, food, and commodity supply are safeguarded, and maritime transport is the main means of import and export into the EU and beyond.
- Seaborne accounts for almost 90% of external freight trade in the EU, and short sea shipping accounts for one-third of EU exchanges in ton-kilometres. Good maritime transport services are essential for the quality of life in Europe's islands and peripheral maritime regions.
- Over 400 million passengers arrive and leave at European ports each year. In general, maritime industries provide employment and income to the European economy.
- EU ports handled 3,5 billion tonnes of goods in 2022, which is slightly higher than in 2021 (-0.8% YoY). After a significant drop in 2020, which is most likely due to the pandemic and restrictions imposed across the EU and globally, the levels in 2022 are slightly lower than in 2018.
- EU port freight activity showed a positive trend since 2014, suggesting a slight recovery after the 2009 economic crisis. After a drop in the first quarter of 2021 when compared to the same quarter in 2020, there was a clear increase in the last three quarters of 2021 and the first two quarters of 2022. However, there was a decrease in activity in the final two quarters of 2022, with a drop in activity (-0.1% YoY in the 3rd quarter and (-2.2%) in the 4th quarter.
- In terms of maritime freight transport, the Netherlands maintained its position as the largest country in Europe for maritime freight transport in 2022, with the other seven largest ports in Europe being Rotterdam (Netherlands), Antwerp (Bruges), Hamburg (Hamburg), Amsterdam (Amsterdam-Munich), Algeciralas (Harpo[2]) and Marseille (Marseille).
- In terms of seaborne cargo-to-capita ratios, EU Member States ranged from 33.3 TfC in the Netherlands in 2022 to 3.2 TfC in Poland (Romania) and the EU average of 7.8 TfC in 2022. However, Norway, an EFTA country, had the highest ratio (39.4 TfC) of maritime data reporting countries to Eurostat in 2022.
Europe Customs Brokerage Industry Overview
The market for customs brokerage in Europe is fragmented in nature. With a large number of customs brokers operating in the market, the competition is high. The major players in the market include DHL Logistics, Maersk Logistics, Kuehne and Nagel Logistics, United Parcel Services, DB Schenker, etc.
The companies have built a strong reputation and have a wide network of clients and partners. They often have extensive experience in handling customs procedures across different European countries, making them a reliable choice for businesses.
Additional Benefits:
- The market estimate (ME) sheet in Excel format
- 3 months of analyst support
TABLE OF CONTENTS
1 INTRODUCTION
- 1.1 Study Assumptions and Market Definition
- 1.2 Scope of the Market
2 RESEARCH METHODOLOGY
3 EXECUTIVE SUMMARY
4 MARKET INSIGHTS
- 4.1 Current Market Scenario
- 4.2 Government Initiatives and Regulations
- 4.3 Supply Chain/Value Chain Analysis
- 4.4 Brief on Customs Brokerage as a Freight Forwarding Function
- 4.5 Overview of Customs Pricing
- 4.6 Insights on Customs Brokerage Services by End-user Industry
- 4.7 Impact of COVID-19 on the Market
5 MARKET DYNAMICS
- 5.1 Drivers
- 5.1.1 Increasing international trade
- 5.1.2 Complex custom regulations
- 5.2 Restraints
- 5.2.1 Regulatory Challenges
- 5.2.2 Geopolitical Uncertainity
- 5.3 Opportunities
- 5.3.1 E-commerce Boom
- 5.3.2 Technological Advancements
- 5.4 Industry Attractiveness - Porter's Five Forces Analysis
- 5.4.1 Bargaining Power of Suppliers
- 5.4.2 Bargaining Power of Consumers
- 5.4.3 Threat of New Entrants
- 5.4.4 Threat of Subsititutes
- 5.4.5 Intensity of Competitive Rivalry
6 MARKET SEGMENTATION
- 6.1 By Mode Of Transport
- 6.1.1 Sea
- 6.1.2 Air
- 6.1.3 Cross-Border Land Transport
- 6.2 By Geography
- 6.2.1 Germany
- 6.2.2 United Kingdom
- 6.2.3 France
- 6.2.4 Netherlands
- 6.2.5 Italy
- 6.2.6 Rest of Europe
7 COMPETITIVE LANDSCAPE
- 7.1 Market Concentration Overview
- 7.2 Company Profiles
- 7.2.1 DHL Group Logistics
- 7.2.2 DB Schenker
- 7.2.3 Kuehne and Nagel
- 7.2.4 Maersk Logistics
- 7.2.5 United Parcel Services
- 7.2.6 FedEx
- 7.2.7 Rhenus Logistics
- 7.2.8 Gerlach Customs
- 7.2.9 APL Logistics
- 7.2.10 Gaston Schul Logistics*
8 FUTURE OF THE MARKET
9 APPENDIX
- 9.1 Macroeconomic Indicators
- 9.2 Insights on capital flow
- 9.3 Exports and Import Statistics


