


 |
市場調查報告書
商品編碼
1639456
電信分析 -市場佔有率分析、產業趨勢/統計、成長預測 (2025-2030)Telecom Analytics - Market Share Analysis, Industry Trends & Statistics, Growth Forecasts (2025 - 2030) |
||||||
※ 本網頁內容可能與最新版本有所差異。詳細情況請與我們聯繫。
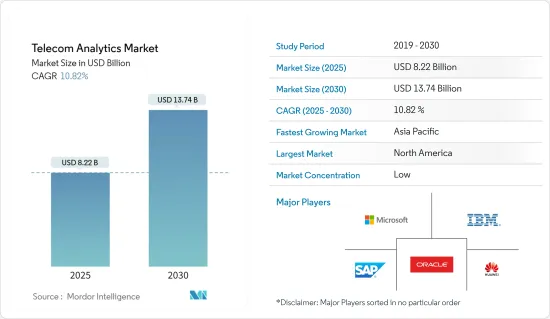
電信分析市場規模預計到 2025 年為 82.2 億美元,預計到 2030 年將達到 137.4 億美元,預測期內(2025-2030 年)複合年成長率為 10.82%。
由於新加入經營者的出現導致競爭加劇,減少取消訂單的需求比以往任何時候都更大,新進業者通常會提供比現有企業更便宜、更優惠的合約。此外,資料資料有效的分析來更深入地了解客戶行為和偏好。即時服務使用模式正在激勵這些公司實施分析。
主要亮點
- 電訊分析市場結合了各種複雜的商業智慧(BI) 技術,可以滿足電訊業的複雜需求。這包括發展銷售、減少客戶流失和詐欺、加強風險管理以及降低營運成本。因此,電訊正在採用先進的分析主導的資料解決方案,更快、更簡單地僅處理相關資料,並使用資料挖掘和預測分析等網路分析來產生及時、準確的見解。
- 此外,通訊業正在進入一個新時代,新的客戶關注點從消費者轉向企業,5G 和雲端新技術,以及利用分析和資料科學提供敏捷和響應式服務的全新方式對工作方式的需求。 。截至 2023 年 1 月,GSA 報告稱,全球已有 243 個商用 5G 部署,112 家營運商投資獨立 5G。這種商業化將帶來新的 B2B 和 B2B2X 應用程式。為此,通訊業者需要能夠可靠地服務這些客戶,而不僅僅是增加容量或靈活地改變服務水準和資源。
- 例如,2023 年 2 月,Oracle 公司宣布發布 Oracle Network Analytics Data Director,這是我們網路分析產品組合中的第二個應用程式。該應用程式使營運商能夠靈活地將 5G 核心整合到其現有的營運工具中,甚至對於 Oracle 未提供的網路功能也是如此。 Oracle Communications Network Analytics Data Director 本質上從各種來源獲取流量,包括 SCP(服務通訊代理)和 NRF(網路儲存庫功能)等 Oracle 5G 網路功能,並將其傳遞給用戶應用程式。
- 由於全球行動用戶數量眾多,預計電信分析服務將託管在雲端。因此,雲端託管也有望因消費群的持續增加而進一步擴大。因此,通訊服務供應商(CSP) 對這項技術的採用正在顯著成長。
- 電信分析可協助通訊服務供應商(CSP) 提高生產力、提高客戶滿意度並增加收益。例如,諾基亞的Nokia AVA分析和見解幫助許多主要通訊公司重塑了其市場測量產品。層級服務供應商POST Luxembourg 使用諾基亞 AVA 在用戶受到影響之前主動識別並解決 97% 的網路問題。此外,Hutchison 3 Indonesia 將網路頻譜效率提高了 17%。此外,沃達豐使用貝爾實驗室機器學習演算法檢測異常並幫助自動進行根本原因分析,解決網路問題的速度提高了 30%。
- 改進的資料基礎設施使分析能夠在通訊行業中得到應用,為資料豐富的通訊業者提供有意義的情報以實現業務轉型。電信分析可讓您整合和分析與支出和計劃相關的客戶資料以及網路使用情況和網路活動時間等行為資料。
- 智慧型設備的激增和 IP 網路使用的增加導致通訊業通訊詐騙死灰復燃。詐騙已成為通訊市場最棘手的問題,因為攻擊可能來自任何地方。因此,當局已開始對通訊業進行安全監管。在印度,印度電訊監管局對未達語音品質標準有嚴格的規定和處罰。預計這將增加該國對網路分析解決方案的需求。
- 在 COVID-19 大流行期間,通訊分析的使用全面擴展。由於在家工作的能力導致寬頻壓力增加、線上串流平台的興起、內部流程可見度的提高以及電信分析的基本操作在此期間擴大等因素,對電信分析的需求處於積極鎖定狀態。
電信分析市場趨勢
減少取消的需求迅速增加
- 在電訊領域,流失率可以定義為在預定時間內更換服務供應商的用戶的百分比。如果這個百分比逐年增加,就會損害公司品牌,因此公司正在專注於降低解約率。這對公司未來的銷售和業務產生負面影響。根據 krtrimaiq 的數據,新澤西州和加州的解約率是美國最高的。
- 透過使用 Telecom Analytics,我們將解約率降低了 15%。電信服務供應商尋求客戶流失分析解決方案,以防止收益損失、增強客戶服務並節省行銷和銷售費用。透過實施用戶分析解決方案,用戶可以從用戶使用資料中了解更多資訊,識別用戶行為模式並改善客戶體驗。此外,通訊業者可以交叉銷售和提升銷售。
- 電信分析非常重要,因為它為電信公司提供了客戶概況,並允許他們識別盈利最高的客戶、盈利最低的客戶等。同時,您還可以追蹤客戶關係的演變(購買、續約、問題)並查看每個客戶在客戶旅程中的位置。
- 此外,電信分析的好處之一是,在客戶管理中,所有客戶資料都安全地儲存在一個系統中,並且可以隨時存取。因為以一致的方式收集每個消費者的詳細資訊以供以後分析非常重要。
- 此外,Bharti Airtel、Reliance Jio 和 Vodafone 等行動電話電信商正在使用人工智慧,透過客服中心和客戶服務接觸點的網路提供來改善客戶體驗,提高用戶保留率,我正在努力尋找減少客戶流失的方法。
- 此外,這個市場上的公司正在提供通訊分析解決方案,其中結合了機器學習來了解態度,幫助通訊業者識別有風險的用戶以及當前和未來流失的原因。因此,營運商正在製定行銷和客戶服務計劃以減少客戶流失。您還可以發現準備升級其資料方案的用戶以及新服務的潛在客戶。在電訊領域,客戶流失分析還可以預測客戶何時更換營運商或服務供應商。
- 電訊領域的客戶有多種服務供應商可供選擇,並且可以主動在營運商之間切換。在競爭如此激烈的市場中,電訊業的年平均解約率率為15-25%。現在,客戶維繫的重要性超過了獲取客戶,因為獲取新客戶的成本比保留現有客戶高 5 到 10 倍。留住盈利的消費者是許多現有企業的首要商業目標。為了減少客戶流失,通訊業者必須識別最有可能流失的消費者。
- 沃達豐2021/2022會計年度第一季的德國預付解約率率為11.3%。沃達豐預付客戶解約率最高的是英國(英國),其解約率率為91.9%。這些地區的解約率很高,降低解約率的需求正在顯著增加。
北美佔最大市場佔有率
- 預計北美將在電訊分析市場中佔據重要的市場佔有率,這主要是由於商業智慧解決方案的高支出。此外,由於該地區通訊高度發達,通訊業者之間的競爭激烈,預計該地區的通訊分析市場將變得更加活躍。
- 用於客戶支援的IT基礎設施和技術的持續進步、眾多市場供應商的存在以及管理最新客戶經驗和幫助台軟體的熟練技術專業知識的可用性,使該地區獨一無二,為電信分析的成長做出了貢獻。此外,北美公司正在積極尋求策略併購。例如,美國科技巨頭IBM收購了Sanovi Technologies,以加強其雲端服務。 Sanovi 為企業資料中心和雲端基礎架構提供雲端遷移、業務永續營運和混合雲端復原軟體。
- 此外,BYOD 計劃可能是由於平板電腦和智慧型手機在美國日益普及而推動的。例如,2022年1月,美國人口普查局和消費者科技協會預測,美國智慧型手機銷售額將從2021年的730億美元增加到2022年的747億美元。隨著物聯網在眾多行業和企業中迅速採用,這一數字預計將進一步增加。因此,隨著智慧型手機用戶的增加,詐騙和詐騙的可能性也在增加,這正在推動這個通訊分析市場呈指數級成長。
- 北美是一些全球最大的行動電話服務供應商的所在地,他們嚴重依賴消費者的回饋。因此,透過選擇Telecom Analytics,該地區的CSP可以以更高的效率提供更高品質的服務。例如,美國通訊供應商 Verizon 擁有各種分析解決方案和人工智慧團隊。同時,資料科學和認知智慧團隊致力於將分析和認知技術引入 Verizon 的客戶互動中。其他供應商也正在關注類似的努力,預計這將推動該地區對通訊分析解決方案的需求。
- 此外,政府增加支持網路普及的措施和投資預計將增加對通訊分析市場的需求。例如,2022 年 7 月,美國農業部 (USDA) 宣布將投資 4.01 億美元,為 11 個州的企業和 31,000 名農村居民提供高速網路存取。這是美國政府對負擔得起的高速網路和農村基礎設施投資的承諾的一部分。
- Stormforge 於 2021 年 4 月發布的一項研究顯示,18% 的北美受訪者表示,他們每月在公司的雲端運算上花費 10 萬至 25 萬美元。此外,32% 的受訪者預計其公司的雲端支出將在未來 12 個月內大幅增加,44% 的受訪者預計同期雲端支出將小幅增加。此外,根據 Statista 2022 年進行的全球消費者調查,44% 的受訪者使用線上儲存文件和圖像,40% 的受訪者使用線上應用程式建立辦公室文件。雲端服務的高支出趨勢預計將推動該地區通訊分析市場的成長。
電信分析產業概述
電信分析市場競爭激烈,目前參與企業眾多,進入分散化階段。全球電信分析市場的幾家主要企業正在不斷努力推動產品進步。幾家知名公司正在結盟或擴大在新興市場的足跡,以鞏固其市場地位。主要企業包括華為技術有限公司、SAP SE 和甲骨文公司。
- 2023 年 3 月 - IBM 公司宣布將為埃及電信 (TE) 提供智慧自動化軟體,以實施涵蓋行動、固定和核心網路上所有營運支援系統 (OSS) 的解決方案。埃及電信將採用部署在 RedHat OpenShift 上的 IBM Cloud Pak for Watson AIOps 來實施 IBM 機器人流程自動化 (RPA) 解決方案。此解決方案使 TE 能夠鳥瞰整個 IT 環境,從而加快創新速度、降低營運成本並最大限度地縮短故障排除和解決網路相關事件所需的時間。
- 2023 年 2 月 - Bharti Airtel 宣布將與 NVIDIA 合作建置基於 AI 的解決方案,以改善其客服中心所有入境的整體客戶體驗。該公司對進入客服中心的84% 的呼叫應用了自動語音辨識演算法。這使得公司能夠在與消費者互動時找到代理商的改進之處,從而帶來更好的客戶體驗。該公司利用 NVIDIA NeMo 對話式 AI套件包來開發這款專用語音應用程式和 NVIDIA AI 企業軟體套件。
其他好處
- Excel 格式的市場預測 (ME) 表
- 3 個月分析師支持
目錄
第1章簡介
- 研究假設和市場定義
- 調查範圍
第2章調查方法
第3章執行摘要
第4章市場洞察
- 市場概況
- 價值鏈分析
- 產業吸引力-波特五力分析
- 新進入者的威脅
- 買方議價能力
- 供應商的議價能力
- 替代品的威脅
- 競爭公司之間敵對關係的強度
- COVID-19 對市場的影響
- 市場動態
- 減少取消的需求迅速增加
- 詐欺的脆弱性增加
- 市場限制因素
- 通訊業者缺乏意識
第5章市場區隔
- 按用途
- 客戶分析
- 網路分析
- 市場分析
- 價格分析
- 服務分析
- 其他
- 按發展
- 雲
- 本地
- 按地區
- 北美洲
- 美國
- 加拿大
- 歐洲
- 英國
- 德國
- 法國
- 歐洲其他地區
- 亞太地區
- 中國
- 印度
- 日本
- 其他亞太地區
- 其他
- 拉丁美洲
- 中東/非洲
- 北美洲
第6章 競爭狀況
- 公司簡介
- Dell Inc.
- Oracle Corporation
- IBM Corporation
- SAP SE
- Microsoft Corporation
- InfoFaces Inc.
- Accenture PLC
- Huawei Technologies Co. Ltd
- Teradata Corporation
- Wipro Limited
- Nokia Corporation
第7章 投資分析
第8章 市場機會及未來趨勢
The Telecom Analytics Market size is estimated at USD 8.22 billion in 2025, and is expected to reach USD 13.74 billion by 2030, at a CAGR of 10.82% during the forecast period (2025-2030).
The need for reducing churn is more important than ever, as the competition is increasing with the incidence of new entrants, who provide lucrative deals that are generally inexpensive than the incumbents. In addition, the increasing amount of unstructured and structured data requires effective analysis to get more profound insights into customer behavior and preferences. Real-time service usage patterns motivate these companies to adopt analytics.
Key Highlights
- The telecom analytics market combines various sophisticated business intelligence (BI) technologies that satisfy the complex demands of the telecom industry. These include developing sales, reducing churn and deception, enhancing risk management, and decreasing operational costs. Hence, telecom organizations are adopting advanced analytics-driven data solutions for faster and simpler processing of only relevant data, helping them achieve timely and accurate insights using network analytics such as data mining and predictive analytics.
- Moreover, the telecommunications industry is entering a new era and increasing need for a new customer focus - enterprises instead of consumers, new technologies in 5G and the cloud, and fundamentally new ways of working to deliver agile, faster services using analytics and data science. As of January 2023, the GSA reports that there are 243 commercial 5G deployments worldwide, with 112 operators investing in standalone 5G. This commercialization will lead to new B2B and B2B2X applications. In doing so, operators need to ensure that they can serve these customers beyond simply expanding capacity or flexibly changing service levels and resources.
- For instance, in February 2023, Oracle Corporation announced to release the second application in our Network Analytics portfolio, the Oracle Network Analytics Data Director which enables operators to flexibly integrate their 5G core into their existing operational tools, even for network functions that are not provided by Oracle. Oracle Communications Network Analytics Data Director basically ingests traffic from various sources such as Oracle 5G network functions such as Service Communication Proxy (SCP) and Network Repository Function (NRF) and distributes it to subscriber applications.Both incoming and outgoing data are encrypted, allowing users to guarantee end-to-end data transfer.
- Telecom analytics service is expected to be hosted on the cloud because of the large number of mobile users worldwide. Hence, cloud hosting is also set to expand further due to the continuous rise in the consumer base. Thus, the adoption of this technology by communications service providers (CSPs) is growing significantly.
- Telecom analytics has been helping communications service providers (CSPs) to boost productivity, enhance customer satisfaction, and grow revenues. For instance, Nokia Corporation's Nokia AVA analytics and insights helped many leading telecom companies re-engineer their market measurement products. POST Luxembourg, a Tier-1 service provider, used Nokia AVA to proactively identify and solve 97% of network issues before they could affect subscribers. Moreover, Hutchison 3 Indonesia improved the spectral efficiency of its network by 17%. Additionally, Vodafone solves network issues up to 30% faster by using Bell Labs machine learning algorithms that detect anomalies and help automate root cause analysis.
- The improvements in data infrastructure have enabled the use of analytics in the telecom industry, owing to which data-rich carriers can yield meaningful intelligence to transform their businesses. Telecom analytics allows pages to merge and analyze customer data related to spending and plans and behaviour data like internet usage or duration of networking activities.
- Due to the proliferation of smart devices and the increasing use of IP networks, the telecom industry is experiencing a resurgence of communications fraud. As attacks can come from any source, scam has emerged as the most troublesome problem for the telecom market. Due to this, authorities are initiating regulations for the telecoms sector safety. In India, the Telecom Regulatory Authority of India has issued stringent rules and penalties for failing to meet the voice quality benchmark. It is expected to increase the demand for network analytics solutions in the country.
- During the COVID-19 pandemic outbreak, the overall utilization of telecom analytics has expanded. Due to the factors like the increased pressure on broadband caused by the ability to work from home, the rise in online streaming platforms, improved visibility of internal processes, and essential operations by telecom analytics, the demand for telecom analytics has grown during the active lockdown period.
Telecom Analytics Market Trends
The surge in need for churn reduction
- In the context of the telecom sector, churn can be defined as the percentage of subscribers who switch service providers within a predetermined time frame. Companies are putting a lot of effort into lowering churn since if the percentage increases year over year, it damages the company's brand. This badly impacts future sales and business for the corporation. According to krtrimaiq, New Jersey and California have the highest churn percentage in the US.
- By using telecom analytics, it cut churn by 15%. Telecom service providers demand customer churn analytics solutions to prevent revenue loss, enhance customer service, and save marketing and sales expenses. By implementing telecom analytics solutions, carriers can learn extensively from subscriber usage data to identify subscriber behavior patterns and enhance customer experiences. Additionally, it gives telecom providers the ability to cross-sell and up-sell.
- Telecom analytics is very important as it gives telecom companies an overview of their customers and allows them to identify the most profitable, least profitable, etc. At the same time, it also allows tracking the evolution of customer relationships (purchases, renewals, issues) and seeing where each customer is in the customer journey.
- Furthermore, one of the benefits of telecom analytics is in customer management all customer data is securely stored in one system and can be accessed at any time. As it's important to have a consistent way to collect details about each consumer for later analysis.
- Moreover, mobile phone companies such as Bharti Airtel, Reliance Jio, and Vodafone are using artificial intelligence to enhance customer experience through their customer service touchpoints call centers, and network offerings and try to find ways to improve subscriber stickiness and reduce churn.
- Additionally, companies in the market are providing telecom analytics solutions laced with machine learning to understand attitudes, enabling carriers to identify at-risk subscribers or the causes of current and prospective churn. As a result, businesses are developing marketing or customer service initiatives to reduce turnover. Additionally, it can spot subscribers ready for data plan upgrades and prospective customers for new services. In the telecom sector, churn analytics also makes it possible to predict when customers will likely transfer carriers or service providers.
- Customers in the telecom sector have a variety of service providers to select from, and they can actively switch between operators. The telecoms sector has an average annual churn rate of 15 to 25 percent in this fiercely competitive market. Customer retention has now surpassed customer acquisition in importance since it is 5-10 times more expensive to gain new customers than to keep existing ones. Retaining highly profitable consumers is the top business objective for many established operators. Telecom businesses must identify the consumers who are most likely to leave to reduce customer turnover.
- In the first quarter of Vodafone's financial year 2021/2022, the prepaid churn rate in Germany was 11.3 percent. Vodafone has the highest churn rate among its prepaying customers in the United Kingdom (UK), where the churn rate is 91.9 percent. Since the churn rate is higher in these regions, the need for churn reduction is growing significantly.
North America to Hold the Largest Market Share
- North America is anticipated to occupy a significant market share in the telecom analytics market, primarily owing to the region's high expenditure on business intelligence solutions. Besides, telecommunications in the region is highly developed with intense competition among the communication providers, which is expected further to boost the region's telecom analytics market.
- The continuous advancements in IT infrastructure and technology used for customer support, the presence of a large number of market vendors, and the accessibility of proficient technical expertise in managing the modern customer experience and helpdesk software contribute to the telecom analytics market growth in the region. Furthermore, North American companies actively make strategic mergers and acquisitions. For instance, American technology giant IBM acquired Sanovi Technologies to bolster its cloud offerings. Sanovi provides cloud migration, business continuity, and hybrid cloud recovery software for enterprise data centres and cloud infrastructure.
- Moreover, the BYOD policy is probably driven by the growing popularity of tablets and smartphones in the US. For instance, the US Census Bureau and Consumer Technology Association predicted in January 2022 that sales of smartphones in the US would rise from USD 73 billion in 2021 to USD 74.7 billion in 2022. This is anticipated to increase further with the quick adoption of IoT across numerous sectors and companies. Hence, with the rise of smartphone users, the probability of fraud or scams is also increasing, which in turn is fueling the growth of this telecom analytics market exponentially.
- North America has a few of the world's largest cellular service providers, who rely enormously on consumer feedback. Thus, by opting for telecom analytics, CSPs in the region can offer better quality service at high efficiency. For instance, Verizon, a telecommunications provider in the United States, has deployed various analytic solutions and AI groups around the company. On the other hand, the Data Science and Cognitive Intelligence group focus on implementing analytics and cognitive technology in Verizon's customer interactions. The increased focus of other vendors in order to follow the same would boost the demand for telecom analytics solutions in the region.
- Furthermore, the rising government initiative and investment to support the internet penetration in the country will increase the demand for telecom analytics market. For instance, in July 2022, the United States Department of Agriculture (USDA) has announced a USD 401 million investment to bring high-speed Internet access to businesses and 31,000 rural residents in 11 states. This is part of the US government's commitment to investing in affordable high-speed internet and rural infrastructure.
- In a research study released by Stormforge in April 2021, 18% of respondents from North America claim that their firm spends between $100,000 and $250,000 per month on cloud computing. In addition, 32% of respondents predict that their organization's cloud spending will expand significantly over the following 12 months, while 44% predict a slight increase in cloud spending over the same period. Additionally, as per the research study by Statista Global Consumer Survey conducted in the United States in 2022, it has been found that 44 percent of respondents use online storage for files and pictures, while 40 percent of respondents use online applications to create office documents. This trend of high spending on cloud services will drive the growth of the telecom analytics market in the region.
Telecom Analytics Industry Overview
The Telecom Analytics Market is very competitive and moving towards the fragmented stage as the market currently consists of many players. Several key players in the global telecom analytics market are in constant efforts to bring product advancements. A few prominent companies are entering into collaborations and expanding their footprints in developing regions to consolidate their positions in the market. The major players are Huawei Technologies, SAP SE, and Oracle Corp.
- March 2023- IBM Corporation announced to provide intelligent automation software to Telecom Egypt (TE) to implement an umbrella solution for all its operations support systems (OSS) on mobile, fixed, and core networks. Telecom Egypt will adopt IBM Cloud Pak for Watson AIOps deployed on RedHat OpenShift to implement an IBM Robotic Process Automation (RPA) solution. The solution provides TE with a holistic view of its entire IT environment to help them innovate faster, reduce operating costs, and minimize the time to troubleshoot and resolve network-related incidents.
- February 2023- Bharti Airtel announced to build an AI-based solution by collaborating with NVIDIA to improve the overall customer experience for all inbound calls to its contact center. The company runs an automated speech recognition algorithm on 84% of its calls coming into its contact centers. This will help the company identify improvement areas for the agent when interacting with the consumers, leading to a better customer experience. The company has leveraged the NVIDIANeMo conversational AI toolkit to develop this specialized speech application and NVIDIA AI enterprise software suite.
Additional Benefits:
- The market estimate (ME) sheet in Excel format
- 3 months of analyst support
TABLE OF CONTENTS
1 INTRODUCTION
- 1.1 Study Assumptions and Market Definition
- 1.2 Scope of the Study
2 RESEARCH METHODOLOGY
3 EXECUTIVE SUMMARY
4 Market Insights
- 4.1 Market Overview
- 4.2 Value Chain Analysis
- 4.3 Industry Attractiveness - Porter's Five Forces Analysis
- 4.3.1 Threat of New Entrants
- 4.3.2 Bargaining Power of Buyers
- 4.3.3 Bargaining Power of Suppliers
- 4.3.4 Threat of Substitute Products
- 4.3.5 Intensity of Competitive Rivalry
- 4.4 Impact of Covid-19 on the Market
- 4.5 Market Dynamics
- 4.5.1 The surge in need for churn reduction
- 4.5.2 Increasing Vulnerability to Fraudulent Activities
- 4.6 Market Restraints
- 4.6.1 Lack of Awareness Among Telecom Operators
5 MARKET SEGMENTATION
- 5.1 By Application
- 5.1.1 Customer Analytics
- 5.1.2 Network Analytics
- 5.1.3 Market Analytics
- 5.1.4 Price Analytics
- 5.1.5 Service Analytics
- 5.1.6 Other Applications
- 5.2 By Deployment
- 5.2.1 Cloud
- 5.2.2 On-premise
- 5.3 By Geography
- 5.3.1 North America
- 5.3.1.1 United States
- 5.3.1.2 Canada
- 5.3.2 Europe
- 5.3.2.1 United Kingdom
- 5.3.2.2 Germany
- 5.3.2.3 France
- 5.3.2.4 Rest of Europe
- 5.3.3 Asia Pacific
- 5.3.3.1 China
- 5.3.3.2 India
- 5.3.3.3 Japan
- 5.3.3.4 Rest of Asia Pacific
- 5.3.4 Rest of the World
- 5.3.4.1 Latin America
- 5.3.4.2 Middle East and Africa
- 5.3.1 North America
6 COMPETITIVE LANDSCAPE
- 6.1 Company Profiles
- 6.1.1 Dell Inc.
- 6.1.2 Oracle Corporation
- 6.1.3 IBM Corporation
- 6.1.4 SAP SE
- 6.1.5 Microsoft Corporation
- 6.1.6 InfoFaces Inc.
- 6.1.7 Accenture PLC
- 6.1.8 Huawei Technologies Co. Ltd
- 6.1.9 Teradata Corporation
- 6.1.10 Wipro Limited
- 6.1.11 Nokia Corporation
7 INVESTMENT ANALYSIS
8 MARKET OPPORTUNITIES AND FUTURE TRENDS
 2025年全球電信分析市場報告
 2025 年至 2033 年電信分析市場規模、佔有率、趨勢及預測(按組件、部署模式、組織規模、應用和地區)日本電信分析市場報告(按組件、部署模式、組織規模、應用和地區)2025 年至 2033 年
 電信分析市場規模、佔有率、成長分析(按組件、部署模式、組織規模、應用和地區)- 產業預測,2025-2032 年
 通訊分析全球市場規模、佔有率、趨勢分析報告:按部署模式、組織規模、組件、應用、地區、展望和預測,2024-2031 年
 全球通訊分析市場:市場規模、佔有率和趨勢分析(按組件、部署方法、組織規模、應用、地區和細分市場,2025-2030 年)
 全球通訊分析市場,2024-2028
 到 2030 年的通訊分析市場預測:按組件、部署、公司規模、應用程式、最終用戶和區域進行的全球分析