


 |
市場調查報告書
商品編碼
1851321
雲端服務仲介(CSB):市場佔有率分析、產業趨勢、統計數據和成長預測 (2025-2030)Cloud Services Brokerage (CSB) - Market Share Analysis, Industry Trends & Statistics, Growth Forecasts (2025 - 2030) |
||||||
※ 本網頁內容可能與最新版本有所差異。詳細情況請與我們聯繫。
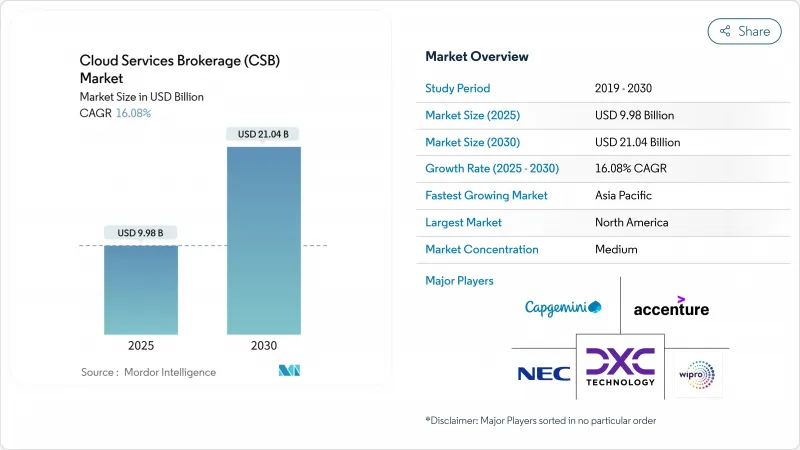
據估計,2025 年雲端服務仲介市場規模為 99.8 億美元,預計到 2030 年將達到 210.4 億美元,預測期(2025-2030 年)複合年成長率為 16.08%。
這種成長反映了企業需要單一平台來管理日益複雜的多重雲端環境。尤其在歐洲,數位服務和數據法律確立了嚴格的可攜性和主權規則,推動了對仲介管理的需求。供應商整合,例如博通收購VMware,促使許多IT領導者轉向獨立平台,以保持議價能力並避免被鎖定。同時,超大規模雲端市場蓬勃發展,為與亞馬遜雲端服務(AWS)、微軟Azure和谷歌雲端生態系統合作的仲介創造了利潤豐厚的聯合銷售管道。儘管供應鏈逆風依然存在,例如半導體供應限制導致區域基礎設施成本上漲15-20%,但雲端服務代理市場仍在承受這些壓力,因為成本管治工具已被證明至關重要。
全球雲端服務仲介(CSB) 市場趨勢與洞察
混合雲和多重雲端採用率激增
混合雲和多重雲端策略如今已成為資訊長 (CIO)藍圖的主流,預計到 2025 年,92% 的企業將採用多重雲端架構。因此,企業需要能夠將分散環境統一到一個統一策略域中,同時避免廠商鎖定的仲介平台。金融服務公司處於領先地位,因為資料居住要求禁止其直接遷移Oracle公有雲。 Oracle 和 Google Cloud 的直接互連展示了服務仲介如何實現低延遲的公共雲端雲端資料流,而無需經過開放的網際網路。容器的激增增加了複雜性,要求服務代理程式 (CSB) 增強 Kubernetes編配能力,並使 DevOps 團隊無需操作特定於主機的腳本。透過混合邊緣工作負載,仲介提供了一個涵蓋本地、公有雲和邊緣節點的單一管治架構,最大限度地減少了技能差距和營運風險。
企業雲端支出加速成長
終端用戶雲端支出預計在2025年達到7,234億美元,比2024年成長21.20%。巨額帳單使財務主管面臨預算超支的風險,因此,財務營運(FinOps)方面的洞察已成為董事會層面的強制性要求。 CSB的平台現已整合機器學習演算法,可預測消費量高峰並自動調整資源規模。銀行已展現出緊迫感:儘管目前僅使用了49%的承諾雲端支出,但他們計劃進一步增加撥款,以運行需要高階GPU的AI模式。由於缺乏仲介主導的監管機制,許多財務長擔心「帳單衝擊」。
安全和合規問題
共用責任模式令許多風險負責人感到困惑,尤其是在《數位服務法案》對雲端服務提供者施加新的通知和取得規則之後。因此,仲介必須支援跨所有連接提供者的細粒度存取控制、地理圍籬和防篡改審核日誌。實現如此深入的功能會增加研發成本並延長銷售週期,因為買家需要提供徹底滲透測試的證據。身分識別管理仍然是最具挑戰性的環節:雲端服務經紀商必須在保持最小權限預設的同時,聯合 Azure AD、AWS IAM 和 Google Identity 的憑證。
細分市場分析
外部雲端服務代理平台憑藉其廠商中立的優勢和成熟的功能集,預計在2024年佔據雲端服務代理市場48%的佔有率。同時,內部雲端服務代理預計將以18.70%的複合年成長率成長,反映出經營團隊致力於將雲端管治嵌入到企業DevOps流程中。隨著財富500強銀行和通訊業者推出與ServiceNow、Jira和CI/CD堆疊相連接的仲介門戶,預計到2030年,與內部平台相關的雲端服務代理市場規模將成長一倍以上。
內部安全解決方案的激增得益於平台工程人員的增加以及策略性收購,例如IBM以64億美元收購HashiCorp,後者將Terraform和Vault自動化功能整合於一體。內部安全解決方案庫(CSB)還能從長遠角度降低授權成本,並使安全團隊能夠在程式碼層面實施組織特定的控制措施。外部供應商則將自身定位為「仲介」層,透過提供更快的價值實現速度和始終線上市場整合,將傳統安全解決方案、內部解決方案和SaaS仲介整合在一起。
到2024年,公有雲端服務仍將佔據雲端服務仲介市場54%的佔有率,這主要得益於超大規模可用區不斷擴展。然而,混合雲的採用率正以20.30%的複合年成長率加速成長。歐盟主權雲端舉措正引導買家採用將受監管資料保留在本地,並能彈性地將分析需求擴展到公共容量的架構,而這正是微軟歐盟主權雲的目標模式。
隨著製造商尋求在工廠車間處理對延遲要求極高的工作負載,邊緣運算正進一步推動混合雲的普及。仲介現在可以將本地 Kubernetes 叢集與雲端後端連接起來,只需單擊即可實現工作負載遷移。隨著 5G 專用網路的日益普及,我們預計 CSB主機將能夠管理本地 MEC 節點以及傳統的 IaaS 資源。
雲端服務仲介(CSB) 市場報告按平台(內部仲介輔助、外部仲介輔助)、部署模式(公共雲端、私有雲端、混合雲端)、企業(中小企業、大型企業)、最終用戶垂直行業(IT 和通訊、銀行和金融服務、保險、零售和消費品、其他)和地區進行細分。
區域分析
由於北美地區雲端運算發展成熟度較高且擁有豐富的合作夥伴生態系統,預計到2024年,北美地區仍將維持全球44%的收入佔有率。金融服務和醫療保健機構引領這一趨勢,它們被仲介簡化薩班斯-奧克斯利法案和HIPAA報告流程的能力所吸引。儘管半導體短缺導致區域機架成本持續上漲,但仲介正透過最佳化工作負載在低成本區域的部署來減輕其影響。隨著聯邦機構和國防承包商尋求確保資料居住於國內,主權雲正日益受到重視,促使仲介獲得FedRAMP高標準控制認證。
亞太地區是成長最快的地區,預計到2030年複合年成長率將達到18.50%。從印度到日本,各國政府都在推行「雲端優先」政策,雲端運算預計將為該地區GDP貢獻0.25%至2.23%的成長。日本的Sakura Internet等雲端服務供應商正將中介功能整合到其國內雲端服務中,以吸引那些對跨境資料傳輸規則持謹慎態度的企業。同時,台灣和韓國的半導體製造群正在權衡地緣政治風險,以確保國內資料中心部署所需的零件供應。
歐盟資料法和 GAIA-X 都嚴格遵循資料可攜性和主權目標。微軟的主權藍圖和Oracle的歐盟監管雲表明,它們為仲介疊加層提供了合適的服務環境。阿拉伯聯合大公國、沙烏地阿拉伯和巴西的國家數位經濟計畫正在資助超大規模資料中心區域的推出,一旦連接性差距消除,這將為仲介的採用創造有利條件。
其他福利:
- Excel格式的市場預測(ME)表
- 3個月的分析師支持
目錄
第1章 引言
- 研究假設和市場定義
- 調查範圍
第2章調查方法
第3章執行摘要
第4章 市場情勢
- 市場概覽
- 市場促進因素
- 混合雲和多重雲端採用率激增
- 加速企業雲端投資
- 對集中成本和管治的需求
- 超大規模資料中心業者市場的繁榮
- CSB 的人工智慧主導財務營運
- 主權雲合規層
- 市場限制
- 安全和合規問題
- 中小企業對CSB價值的認知不足
- 原生超大規模資料中心工具會蠶食 CSB 的市場佔有率
- 費用壓縮會擠壓利潤空間。
- 價值/供應鏈分析
- 監管環境
- 技術展望
- 波特五力分析
- 新進入者的威脅
- 買方的議價能力
- 供應商的議價能力
- 替代品的威脅
- 競爭的激烈程度
第5章 市場規模與成長預測
- 按平台
- 內部仲介協助
- 外部仲介協助
- 按部署模式
- 公有雲
- 私有雲端
- 混合雲
- 按公司規模
- 小型企業
- 主要企業
- 按最終用戶行業分類
- 資訊科技/通訊
- 銀行、金融服務和保險
- 零售和消費品
- 醫療保健和生命科學
- 政府/公共部門
- 製造業
- 媒體與娛樂
- 按地區
- 北美洲
- 美國
- 加拿大
- 墨西哥
- 南美洲
- 巴西
- 阿根廷
- 智利
- 其他南美洲
- 歐洲
- 德國
- 英國
- 法國
- 其他歐洲地區
- 亞太地區
- 中國
- 日本
- 印度
- 亞太其他地區
- 中東和非洲
- 阿拉伯聯合大公國
- 沙烏地阿拉伯
- 南非
- 其他中東和非洲地區
- 北美洲
第6章 競爭情勢
- 市場集中度
- 策略趨勢
- 市佔率分析
- 公司簡介
- Accenture
- IBM
- Wipro
- Capgemini
- DXC Technology
- NEC
- NTT Data
- Cognizant
- Jamcracker
- VMware
- Flexera(RightScale)
- Ingram Micro Cloud
- Arrow Electronics(CloudBlue)
- AppDirect
- Pax8
- Cloudmore
- Boomi
- DoubleHorn
- TietoEVRY
- Tech Mahindra
第7章 市場機會與未來展望
The Cloud Services Brokerage Market size is estimated at USD 9.98 billion in 2025, and is expected to reach USD 21.04 billion by 2030, at a CAGR of 16.08% during the forecast period (2025-2030).
This growth reflects enterprises' need for a single pane of glass to govern increasingly complex multi-cloud estates, where the typical organization now juggles 2.6 public clouds alongside private resources. Regulatory mandates add further momentum, especially in Europe, where the Digital Services Act and Data Act enforce strict portability and sovereignty rules that amplify demand for brokerage controls. Supplier consolidation, highlighted by Broadcom's VMware takeover, has nudged many IT leaders toward independent platforms to preserve negotiating power and avoid lock-in. Meanwhile, hyperscaler marketplaces have exploded, creating lucrative co-sell avenues for brokers tied into Amazon Web Services, Microsoft Azure, and Google Cloud ecosystems. Supply-chain headwinds persist, with semiconductor constraints lifting regional infrastructure costs by 15-20%, yet the cloud service brokerage market continues to absorb this pressure as cost governance tools prove indispensable.
Global Cloud Services Brokerage (CSB) Market Trends and Insights
Hybrid and Multi-Cloud Adoption Surge
Hybrid and multi-cloud strategies now dominate CIO roadmaps, with 92% of enterprises expected to pursue multi-cloud architectures by 2025. The resulting sprawl demands brokerage platforms that stitch disparate environments into unified policy domains while shielding organizations from vendor lock-in. Financial services firms stand at the forefront because data-residency mandates bar outright public-cloud migration. Oracle's direct interconnect with Google Cloud demonstrates how service brokers enable low-latency cross-cloud data flows without traversing the open internet. Container proliferation compounds complexity, pushing CSBs to deliver deep Kubernetes orchestration so DevOps teams avoid juggling console-specific scripts. With edge workloads entering the mix, a broker offers one governance fabric spanning on-prem, public, and edge nodes, minimizing skills gaps and operational risk.
Enterprise Cloud-Spend Acceleration
End-user cloud spending is on track to hit USD 723.4 billion in 2025, a 21.20% jump over 2024 levels. Bigger invoices expose finance leaders to budget overruns, turning FinOps insight into a board-level mandate. CSB platforms now embed machine-learning algorithms that forecast consumption spikes and trigger automated right-sizing. Banks showcase the urgency: despite using only 49% of their committed cloud outlays, they plan to boost allocations further to run AI models requiring premium GPUs. Without broker-led guardrails, many CFOs fear "bill shock," where a single poorly scoped data-science project can wipe out annual spend thresholds within months.
Security and Compliance Concerns
Shared-responsibility models confuse many risk officers, especially when the Digital Services Act imposes fresh notice-and-action rules on cloud operators. Brokers must therefore support granular access controls, geo-fencing, and tamper-proof audit logs across every connected provider. Implementing such depth raises R&D costs and lengthens sales cycles as buyers demand exhaustive penetration-test evidence. Identity management remains the hardest element: CSBs must federate credentials across Azure AD, AWS IAM, and Google Identity while preserving least-privilege defaults.
Other drivers and restraints analyzed in the detailed report include:
- Need for Centralized Cost and Governance
- Hyperscaler Marketplace Co-Sell Boom
- Low SME Awareness of CSB Value
For complete list of drivers and restraints, kindly check the Table Of Contents.
Segment Analysis
External Brokerage Enablement platforms accounted for 48% of the cloud service brokerage market share in 2024, thanks to their vendor-neutral appeal and mature feature sets. Internal Brokerage Enablement, however, is forecast to compound at 18.70% CAGR, reflecting management's push to embed cloud governance natively into enterprise DevOps pipelines. The cloud service brokerage market size tied to internal platforms is set to more than double by 2030 as Fortune 500 banks and telecoms spin up bespoke portals linked to ServiceNow, Jira, and CI/CD stacks.
This internal surge rides on rising platform-engineering headcount and strategic acquisitions such as IBM's USD 6.4 billion purchase of HashiCorp, which delivers Terraform and Vault automation under one roof. Internal CSBs also cut license spend over time and let security teams inject organization-specific controls at the code level. External vendors still hold ground by offering faster time-to-value and evergreen marketplace integrations, positioning themselves as "broker of brokers" layers that manage legacy, internal, and SaaS estates together.
Public Cloud services retained 54% of the cloud service brokerage market in 2024, propelled by ever-expanding hyperscaler availability zones. Yet, Hybrid Cloud deployments are sprinting ahead at 20.30% CAGR as CFOs weigh egress fees against compliance mandates. EU sovereign initiatives have nudged buyers toward architectures where regulated data stays on-prem while analytics elastically burst to public capacity, a pattern Microsoft's EU Sovereign Cloud expressly targets.
Edge computing further boosts hybrid adoption because manufacturers want latency-critical workloads processed on factory floors. Brokers now knit local Kubernetes clusters with cloud back-ends, granting one-click workload mobility. As 5G private networks spread, expect CSB consoles to manage on-prem MEC nodes alongside classic IaaS resources, a capability public-only brokers cannot match.
The Cloud Services Brokerage (CSB) Market Report is Segmented by Platform (Internal Brokerage Enablement and External Brokerage Enablement ), Deployment Model (Public Cloud, Private Cloud, and Hybrid Cloud), Enterprise (Small and Medium-Sized Enterprises and Large Enterprises), End-User Industry (IT and Telecommunications, Banking, Financial Services and Insurance, Retail and Consumer Goods, and More), and Geography.
Geography Analysis
North America retained 44% of global revenue in 2024, owing to early cloud maturity and dense partner ecosystems. Financial services and healthcare providers dominate adoption, drawn to brokers that streamline Sarbanes-Oxley and HIPAA reporting. Semiconductor shortages continue to inflate regional rack costs, yet brokers mitigate the impact by optimizing workload placement across lower-cost zones. Sovereign-cloud conversations are growing louder as federal agencies and defense contractors seek domestic data-residency assurances, nudging brokers to certify FedRAMP High controls.
Asia Pacific is the fastest-growing territory at an 18.50% CAGR through 2030. Governments from India to Japan run "cloud-first" directives, while regional GDP uplift from cloud computing is estimated at 0.25%-2.23%. Japanese providers such as Sakura Internet now bundle brokerage functions with domestic clouds, appealing to firms wary of trans-border data transfer rules. Meanwhile, semiconductor manufacturing clusters in Taiwan and South Korea secure component supply for local data-center rollout, counterbalancing geopolitical risks.
Europe stands out for regulatory pull: the EU Data Act and GAIA-X lay down stringent portability and sovereignty targets. Microsoft's sovereign-cloud roadmap and Oracle's EU Regulated Cloud hint at a service landscape tailor-made for broker overlays. The Middle East and Africa, plus South America, remain emergent but promising; national digital-economy programs in the UAE, Saudi Arabia, and Brazil are funding hyperscaler region launches, planting fertile ground for broker uptake once connectivity gaps close.
- Accenture
- IBM
- Wipro
- Capgemini
- DXC Technology
- NEC
- NTT Data
- Cognizant
- Jamcracker
- VMware
- Flexera (RightScale)
- Ingram Micro Cloud
- Arrow Electronics (CloudBlue)
- AppDirect
- Pax8
- Cloudmore
- Boomi
- DoubleHorn
- TietoEVRY
- Tech Mahindra
Additional Benefits:
- The market estimate (ME) sheet in Excel format
- 3 months of analyst support
TABLE OF CONTENTS
1 INTRODUCTION
- 1.1 Study Assumptions and Market Definition
- 1.2 Scope of the Study
2 RESEARCH METHODOLOGY
3 EXECUTIVE SUMMARY
4 MARKET LANDSCAPE
- 4.1 Market Overview
- 4.2 Market Drivers
- 4.2.1 Hybrid and multi-cloud adoption surge
- 4.2.2 Enterprise cloud-spend acceleration
- 4.2.3 Need for centralized cost and governance
- 4.2.4 Hyperscaler marketplace co-sell boom
- 4.2.5 AI-driven FinOps within CSBs
- 4.2.6 Sovereign-cloud compliance layers
- 4.3 Market Restraints
- 4.3.1 Security and compliance concerns
- 4.3.2 Low SME awareness of CSB value
- 4.3.3 Native hyperscaler tools cannibalize CSBs
- 4.3.4 Fee-compression squeezes margins
- 4.4 Value/Supply-Chain Analysis
- 4.5 Regulatory Landscape
- 4.6 Technological Outlook
- 4.7 Porter's Five Forces Analysis
- 4.7.1 Threat of New Entrants
- 4.7.2 Bargaining Power of Buyers
- 4.7.3 Bargaining Power of Suppliers
- 4.7.4 Threat of Substitutes
- 4.7.5 Intensity of Rivalry
5 MARKET SIZE AND GROWTH FORECASTS (VALUE)
- 5.1 By Platform
- 5.1.1 Internal Brokerage Enablement
- 5.1.2 External Brokerage Enablement
- 5.2 By Deployment Model
- 5.2.1 Public Cloud
- 5.2.2 Private Cloud
- 5.2.3 Hybrid Cloud
- 5.3 By Enterprise Size
- 5.3.1 Small and Medium-sized Enterprises
- 5.3.2 Large Enterprises
- 5.4 By End-user Industry
- 5.4.1 IT and Telecommunications
- 5.4.2 Banking, Financial Services and Insurance
- 5.4.3 Retail and Consumer Goods
- 5.4.4 Healthcare and Life Sciences
- 5.4.5 Government and Public Sector
- 5.4.6 Manufacturing
- 5.4.7 Media and Entertainment
- 5.5 By Geography
- 5.5.1 North America
- 5.5.1.1 United States
- 5.5.1.2 Canada
- 5.5.1.3 Mexico
- 5.5.2 South America
- 5.5.2.1 Brazil
- 5.5.2.2 Argentina
- 5.5.2.3 Chile
- 5.5.2.4 Rest of the South America
- 5.5.3 Europe
- 5.5.3.1 Germany
- 5.5.3.2 United Kingdom
- 5.5.3.3 France
- 5.5.3.4 Rest of Europe
- 5.5.4 Asia Pacific
- 5.5.4.1 China
- 5.5.4.2 Japan
- 5.5.4.3 India
- 5.5.4.4 Rest of Asia Pacific
- 5.5.5 Middle East and Africa
- 5.5.5.1 United Arab Emirates
- 5.5.5.2 Saudi Arabia
- 5.5.5.3 South Africa
- 5.5.5.4 Rest of Middle East and Africa
- 5.5.1 North America
6 COMPETITIVE LANDSCAPE
- 6.1 Market Concentration
- 6.2 Strategic Moves
- 6.3 Market Share Analysis
- 6.4 Company Profiles (includes Global-level Overview, Market-level Overview, Core Segments, Financials as available, Strategic Information, Market Rank/Share, Products and Services, Recent Developments)
- 6.4.1 Accenture
- 6.4.2 IBM
- 6.4.3 Wipro
- 6.4.4 Capgemini
- 6.4.5 DXC Technology
- 6.4.6 NEC
- 6.4.7 NTT Data
- 6.4.8 Cognizant
- 6.4.9 Jamcracker
- 6.4.10 VMware
- 6.4.11 Flexera (RightScale)
- 6.4.12 Ingram Micro Cloud
- 6.4.13 Arrow Electronics (CloudBlue)
- 6.4.14 AppDirect
- 6.4.15 Pax8
- 6.4.16 Cloudmore
- 6.4.17 Boomi
- 6.4.18 DoubleHorn
- 6.4.19 TietoEVRY
- 6.4.20 Tech Mahindra
7 MARKET OPPORTUNITIES AND FUTURE OUTLOOK
- 7.1 White-space and Unmet-need Assessment
 2025年全球雲端基礎儲存庫服務市場報告2025年全球物聯網(IoT)雲端平台市場報告
 按服務類型、部署模式、公司規模和最終用戶產業分類的消費者雲端服務市場 - 全球預測(2025-2032 年)物聯網 (IoT) 雲端平台市場按服務模式、組件、部署類型、最終用途、性別和組織規模分類 - 全球預測,2025 年至 2032 年物聯網雲端平台市場按應用、元件、部署模型、連接技術、最終用途產業和組織規模分類 - 全球預測 2025-2032雲端和現場服務管理市場按組件、服務類型、最終用戶行業和組織規模分類 - 全球預測 2025-2032雲端工程市場按服務類型、部署模式、組織規模和垂直行業分類 - 全球預測 2025-2032 年雲端服務經紀市場(按產品、服務類型、平台類型、部署模式、垂直產業和公司規模)-2025 年至 2032 年全球預測2025年全球專業雲端服務市場報告2025年全球雲端服務仲介市場報告