


 |
市場調查報告書
商品編碼
1441558
電動客車:全球市場佔有率分析、產業趨勢與統計、成長預測(2024-2029)Global Electric Bus - Market Share Analysis, Industry Trends & Statistics, Growth Forecasts (2024 - 2029) |
||||||
價格
※ 本網頁內容可能與最新版本有所差異。詳細情況請與我們聯繫。
簡介目錄
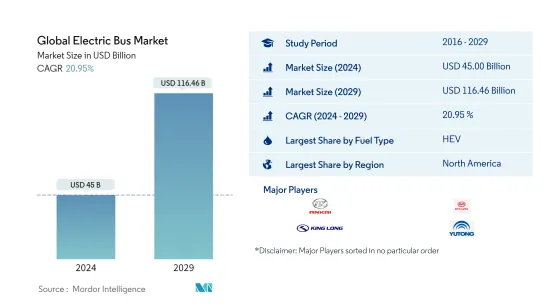
預計2024年全球電動客車市場規模將達450億美元,預計2029年將達到1,164.6億美元,預測期內(2024-2029年)複合年成長率為20.95%。
主要亮點
- 依燃料類型分類的最大區隔市場 - 混合動力汽車:過去二十年的公共和私人投資開發了可與內燃機公車競爭的公車。這使得混合公車成為全球電動公車市場上最大的燃料類型。
- 依燃料類型分類成長最快的區隔市場 - 純電動車:政府為減少碳排放而採取的做法和私人計劃以及充電基礎設施的發展,使純電動車成為全球客車中成長最快的區隔市場。它是一種燃料類型。
- 依國家/地區分類最大的區隔市場 -美國:中國是電動公車市場的主要企業,佔全球全電動公車的 98%。這是因為主要的電動公車製造商都是中國製造。
- 第二市場參與者 - HEV:該公司專注於研發活動。憑藉豐富的電動巴士車型和在中國市場的強大地位,中通客車已成為全球客車市場的第二領導者。
電動客車市場趨勢
依燃料類型分類,混合動力汽車是最大的區隔市場。
- 燃料佔任何車輛營運成本的很大一部分。使用電動公車作為大眾交通工具不僅可以降低燃料成本,還可以降低其他初始成本和總擁有成本。到2030年,電動公車的價格預計將降至柴油公車的價格水準。與柴油引擎公車相比,電動公車可降低 81-83% 的維護和營運成本。公眾對空氣污染、氣候變遷和柴油價格上漲的認知不斷提高,是促使大多數州和城市交通當局擴大將清潔大眾交通工具解決方案涵蓋其區域發展計畫的一些因素。
- 電動巴士市場有潛力填補大眾交通工具系統的空白。透過減少與營運和維護相關的費用,並減少與公共健康和環境相關的隱性成本,公共巴士的大規模電氣化為相關人員帶來了顯著的利益,並增加了服務供應商和服務提供商在提供利益方面取得平衡的可能性服務之間。隨著各國政府大力推動向電動車的過渡,大眾交通工具和電動公車供應商有潛力在適當的法規結構和市場機制的幫助下引領市場。
- 電動巴士生態系統是根據既定的政府指導方針實施的。然而,從規劃、相關人員責任和營運角度來看,電動公車充電站的安裝和管理已成為一項緊迫的課題,也是促進電動公車生態系統發展的最重要問題,需要解決:優先權。
依地區分類,北美是最大的部分。
- 燃料佔任何車輛營運成本的很大一部分。隨著燃料成本的上升,使用電動公車作為大眾交通工具不僅可以降低燃料成本,還可以降低其他初始成本和總擁有成本。到2030年,電動公車的價格預計將降至柴油公車的價格。與柴油引擎公車相比,電動公車可降低 81-83% 的維護和營運成本。
- 柴油公車的平均成本約為 50 萬美元,而電動公車的平均成本為 75 萬美元。儘管初始成本很高,但電動公車通常是一種經濟高效的替代方案,並且由於維護和燃料成本較低而降低了營運成本,可以在公車的整個生命週期內節省大量成本。同時,公車車的相對穩定性也會提高成本的可預測性。電費和石化燃料價格的比較。由於政策優惠,電動公車在經濟上變得可行。維護和燃料成本已顯著降低。根據電動公車製造商介紹,電動公車可節省近40萬美元的燃油成本和12.5萬美元的維護成本,足以彌補較高的初始成本。
- 電動巴士生態系統的上述要素已根據既定的政府指導方針實施。然而,電動巴士充電站的安裝和管理在規劃、相關人員責任範圍和營運方面都存在緊迫問題,需要優先解決,以促進電動巴士生態系統的發展。 。在世界上。
電動客車產業概況
全球電動客車市場整合度較高,前五家企業佔比達67.30%。
其他福利
- Excel 格式的市場預測 (ME) 表
- 3 個月分析師支持
目錄
第1章執行摘要和主要發現
第2章 提供報告
第3章簡介
- 研究假設和市場定義
- 調查範圍
- 調查方法
第4章 產業主要趨勢
- 人口
- GDP
- CVP
- 通貨膨脹率
- 汽車貸款利率
- 電池價格(每度電)
- 物流績效指數
- 電動的影響
- 新XEV車型發布
- 充電站的部署
- 法律規範
- 價值鍊和通路分析
第5章市場區隔
- 汽油種類
- BEV
- FCEV
- HEV
- PHEV
- 地區
- 非洲
- 南非
- 亞太地區
- 澳洲
- 中國
- 印度
- 印尼
- 日本
- 馬來西亞
- 韓國
- 泰國
- 其他亞太地區
- 歐洲
- 奧地利
- 比利時
- 捷克共和國
- 丹麥
- 愛沙尼亞
- 法國
- 德國
- 愛爾蘭
- 義大利
- 拉脫維亞
- 立陶宛
- 挪威
- 波蘭
- 俄羅斯
- 西班牙
- 瑞典
- 英國
- 歐洲其他地區
- 中東
- 阿拉伯聯合大公國
- 其他多邊環境協定
- 中東
- 北美洲
- 加拿大
- 墨西哥
- 美國
- 北美其他地區
- 南美洲
- 拉丁美洲其他地區
- 非洲
第6章 競爭形勢
- 重大策略舉措
- 市場佔有率分析
- 公司形勢
- 公司簡介
- Anhui Ankai Automobile Co. Ltd
- Ashok Leyland
- BYD Company Limited
- Daimler AG
- King Long United Automotive Industry Co. Ltd.
- NFI Group Inc.
- Proterra Inc.
- Tata Motors Limited
- Volvo Group
- Zhengzhou Yutong Group Co. Ltd.
- Zhongtong Bus Holding Co. Ltd.
第7章 CEO 面臨的關鍵策略問題
第8章附錄
- 世界概況
- 概述
- 波特的五力框架
- 全球價值鏈分析
- 市場動態(DRO)
- 來源和參考文獻
- 表格和圖形列表
- 重要見解
- 資料包
- 詞彙表
簡介目錄
Product Code: 93052
The Global Electric Bus Market size is estimated at USD 45 billion in 2024, and is expected to reach USD 116.46 billion by 2029, growing at a CAGR of 20.95% during the forecast period (2024-2029).
Key Highlights
- Largest Segment by Fuel Type - HEV : Public and private investments made over the last two decades have developed the buses to compete with ICE-based buses. Which is making Hybrid buses the largest fuel type in global e-bus market.
- Fastest-growing Segment by Fuel Type - BEV : The government practices and private programs to cut carbon emission, and development in charging infrastructure is making BEV the fastest growing fuel type in buses Globally.
- Largest Segment by Country - US : China is a major player in the electric bus market, accounting for 98% of all-electric buses worldwide. This is due to the major e-bus manufacturers being from china.
- Second leading Market Player - HEV : The company has a strong focus on R&D activities. Variety of e bus models offering and strong hold on the Chinese market makes Zhongtong Bus Holding Co Ltd 2nd leading player in global bus market.
Electric Bus Market Trends
HEV is the largest segment by Fuel Type.
- Fuel constitutes a major part of the operating cost of any vehicle. Using an electric bus for public transport reduces fuel costs, as well as other upfront costs and the total cost of ownership. By 2030, the prices for electric buses are expected to decline to the price level of diesel-fueled buses. Electric buses help reduce 81-83% of the maintenance and operating costs compared to a diesel-engine bus. The rising general awareness about air pollution, climate change, and increasing diesel prices are some of the factors incentivizing most state and city transport authorities to increasingly accommodate clean public transport solutions in their regional development plans.
- The e-bus market has the potential to fill the gaps in the public transport system. By reducing expenses related to operation and maintenance and cutting down hidden costs linked to public health and the environment, mass electrification of public buses may allow the concerned stakeholders to reap huge benefits and help strike a balance in providing returns between the service providers and the service users over the long run. With a strong government push for EV transition, the public transport authorities and e-bus suppliers may drive the market with the help of a proper regulatory framework and market mechanism.
- The e-bus ecosystem is being implemented in accordance with established government guidelines. However, there is an immediate challenge of setting up and managing e-bus charging stations in terms of planning, the extent of stakeholders' responsibilities, and operation, which must be addressed as a high priority to expedite the development of the e-bus ecosystem across the world.
North America is the largest segment by Region.
- Fuel constitutes a major part of the operating cost of any vehicle. With the increasing costs of fuel, using an electric bus for public transport reduces not only the fuel cost but also other upfront costs and the total cost of ownership. By 2030, the prices for electric buses are expected to decline to those of diesel-fueled buses. Electric buses help reduce 81-83% of the maintenance and operating costs compared to diesel-engine buses.
- An average diesel transit bus costs approximately USD 500,000, compared to USD 750,000 for an electric bus. Despite these higher upfront costs, electric buses are often a cost-efficient alternative, producing major savings over the course of their lifetimes by offering lower operating costs from reduced spending on maintenance and fuel while also providing greater predictability in costs due to the relative stability of electricity prices compared to fossil fuel prices. Electric buses are becoming more financially viable with favorable policies; they have substantially reduced maintenance and fuel costs. According to electric bus manufacturers, electric buses save USD 400,000 in fuel expenses and nearly USD 125,000 in maintenance costs, more than making up for the higher upfront cost.
- The aforementioned factors of the e-bus ecosystem are being implemented in accordance with established government guidelines. However, there are immediate challenges in setting up and managing e-bus charging stations in terms of planning, the extent of stakeholders' responsibilities, and operations that must be addressed on a high priority in order to expedite the development of the e-bus ecosystem across the world.
Electric Bus Industry Overview
The Global Electric Bus Market is fairly consolidated, with the top five companies occupying 67.30%. The major players in this market are Anhui Ankai Automobile Co. Ltd, BYD Company Limited, King Long United Automotive Industry Co. Ltd., Zhengzhou Yutong Group Co. Ltd. and Zhongtong Bus Holding Co. Ltd. (sorted alphabetically).
Additional Benefits:
- The market estimate (ME) sheet in Excel format
- 3 months of analyst support
TABLE OF CONTENTS
1 EXECUTIVE SUMMARY & KEY FINDINGS
2 REPORT OFFERS
3 INTRODUCTION
- 3.1 Study Assumptions & Market Definition
- 3.2 Scope of the Study
- 3.3 Research Methodology
4 KEY INDUSTRY TRENDS
- 4.1 Population
- 4.2 GDP
- 4.3 CVP
- 4.4 Inflation Rate
- 4.5 Interest Rate For Auto Loans
- 4.6 Battery Price (per Kwh)
- 4.7 Logistics Performance Index
- 4.8 Electrification Impact
- 4.9 New XEV Models Announced
- 4.10 Charging Stations Deployment
- 4.11 Regulatory Framework
- 4.12 Value Chain & Distribution Channel Analysis
5 MARKET SEGMENTATION
- 5.1 Fuel Type
- 5.1.1 BEV
- 5.1.2 FCEV
- 5.1.3 HEV
- 5.1.4 PHEV
- 5.2 Region
- 5.2.1 Africa
- 5.2.1.1 South Africa
- 5.2.2 Asia-Pacific
- 5.2.2.1 Australia
- 5.2.2.2 China
- 5.2.2.3 India
- 5.2.2.4 Indonesia
- 5.2.2.5 Japan
- 5.2.2.6 Malaysia
- 5.2.2.7 South Korea
- 5.2.2.8 Thailand
- 5.2.2.9 Rest-of-APAC
- 5.2.3 Europe
- 5.2.3.1 Austria
- 5.2.3.2 Belgium
- 5.2.3.3 Czech Republic
- 5.2.3.4 Denmark
- 5.2.3.5 Estonia
- 5.2.3.6 France
- 5.2.3.7 Germany
- 5.2.3.8 Ireland
- 5.2.3.9 Italy
- 5.2.3.10 Latvia
- 5.2.3.11 Lithuania
- 5.2.3.12 Norway
- 5.2.3.13 Poland
- 5.2.3.14 Russia
- 5.2.3.15 Spain
- 5.2.3.16 Sweden
- 5.2.3.17 UK
- 5.2.3.18 Rest-of-Europe
- 5.2.4 Middle East
- 5.2.4.1 UAE
- 5.2.4.2 Rest-of-MEA
- 5.2.5 Miidle East
- 5.2.6 North America
- 5.2.6.1 Canada
- 5.2.6.2 Mexico
- 5.2.6.3 US
- 5.2.6.4 Rest-of-North America
- 5.2.7 South America
- 5.2.7.1 Rest-of-Latin America
- 5.2.1 Africa
6 COMPETITIVE LANDSCAPE
- 6.1 Key Strategic Moves
- 6.2 Market Share Analysis
- 6.3 Company Landscape
- 6.4 Company Profiles
- 6.4.1 Anhui Ankai Automobile Co. Ltd
- 6.4.2 Ashok Leyland
- 6.4.3 BYD Company Limited
- 6.4.4 Daimler AG
- 6.4.5 King Long United Automotive Industry Co. Ltd.
- 6.4.6 NFI Group Inc.
- 6.4.7 Proterra Inc.
- 6.4.8 Tata Motors Limited
- 6.4.9 Volvo Group
- 6.4.10 Zhengzhou Yutong Group Co. Ltd.
- 6.4.11 Zhongtong Bus Holding Co. Ltd.
7 KEY STRATEGIC QUESTIONS FOR VEHICLES CEOS
8 APPENDIX
- 8.1 Global Overview
- 8.1.1 Overview
- 8.1.2 Porter's Five Forces Framework
- 8.1.3 Global Value Chain Analysis
- 8.1.4 Market Dynamics (DROs)
- 8.2 Sources & References
- 8.3 List of Tables & Figures
- 8.4 Primary Insights
- 8.5 Data Pack
- 8.6 Glossary of Terms
02-2729-4219
+886-2-2729-4219
 電動中型和大型客車市場:按類型、座椅數量、自主水平、應用和最終用途分類 - 2024-2030 年全球預測
 燃料電池電動客車市場評估:依客車類型、應用、技術、功率、公車模型、地區劃分的機會和預測(2017-2031)
 2024 年電動客車全球市場報告
 全球電動公車和客車市場:成長機會(2030 年)
 全球電動客車市場:按動力,電池類型,應用,裡程,長度,消費者,地區,機會,預測2017-2031 年
 燃料電池客車市場報告:2030 年趨勢、預測與競爭分析
 全球電動中型和大型客車市場:技術展望、趨勢、市場分析和預測 - 按推廣細分、組成、應用和地區 - 預測(截至 2030 年)
 電動中型/大型客車(9-14m)市場、份額、規模、趨勢、產業分析報告:按推廣、應用、地區、細分市場預測,2024-2032
 2024-2028年全球電動客車市場
 全球電動客車市場預測(至2030年)
▼