


 |
市場調查報告書
商品編碼
2122916
運輸管理系統:市場佔有率分析、產業趨勢與統計、成長預測(2026-2031)Transportation Management System - Market Share Analysis, Industry Trends & Statistics, Growth Forecasts (2026 - 2031) |
||||||

※ 本網頁內容可能與最新版本有所差異。詳細情況請與我們聯繫。
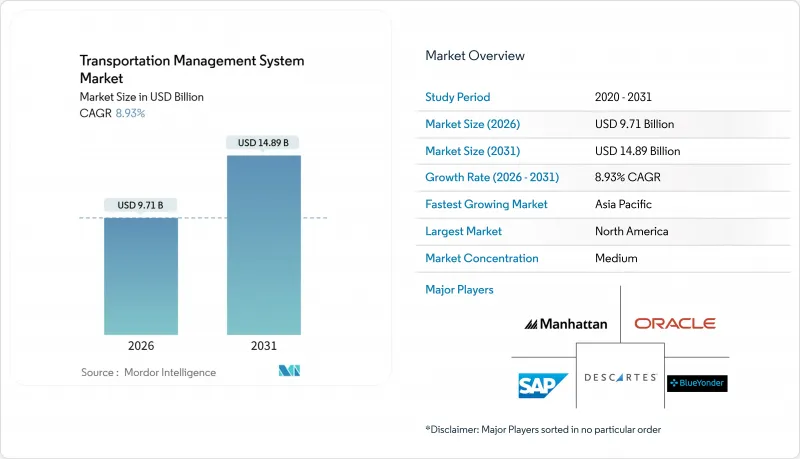
根據 Mordor Intelligence 預測,運輸管理系統市場規模預計將在 2026 年達到 97.1 億美元,到 2031 年達到 148.9 億美元,複合年成長率為 8.93%。
本報告按運輸方式(例如公路)、部署類型(本地部署、雲端部署、混合部署)、企業規模(例如大型企業、微企業)、最終用戶行業(例如製造業、汽車業)、組件(軟體、服務)、應用程式(例如訂單管理)和地區進行細分。市場預測以美元計價。
全球運輸管理系統 (TMS) 市場趨勢與洞察
基於雲端的TMS的採用正在加速,從而降低了服務交付成本。
多租戶雲端平台透過整合托運人需求、利用即時運費比較自動選擇承運商以及在旺季靈活擴展運算資源,可將貨運成本降低 15% 至 25%。運輸管理系統 (TMS) 市場正受益於訂閱式定價Oracle,這種模式無需資本投資,並將供應商的獎勵與準時和高效的營運掛鉤。 Oracle 和 SAP 於 2024 年將其路線規劃引擎遷移到記憶體內架構,將規劃到執行的延遲從幾分鐘縮短到幾秒鐘。同時,Blue Yonder 透過整合需求預測和路線規劃,並主動調配庫存,降低了缺貨風險。新功能可以按月而非按年發布,確保功能始終與時俱進,以應對監管變化。此外,企業可以避免硬體升級週期,並將節省的資金用於資料科學人才和持續改進專案。
電子商務和全通路零售業對即時最後一公里最佳化的需求
對當日送達的需求將規劃時間從數天縮短至數小時,這要求零售商將複雜的路線重組邏輯整合到其運輸管理系統 (TMS) 工作流程中。亞馬遜計劃在 2024 年將其配送服務合作夥伴 (DSP) 網路擴展至 4,500 家承包商,這增加了對能夠與面向消費者的追蹤頁面同步的輕量級行動介面的需求。路線密度演算法已將高運量托運人在都市區的單件包裹配送成本降低了 30-40%——如果沒有雲端的擴充性和精細化控制,這種成本降低是不可能實現的。群眾外包配送模式需要動態容量匹配和即時競價,而傳統的本地部署平台無法提供這些功能。微型倉配中心通常位於人口密集區域 16 公里範圍內,這進一步增加了對能夠每 15-30 分鐘協同最佳化庫存放置和配送決策的系統的需求。
與傳統ERP/WMS系統整合成本高昂
使用 SAP ECC 或 Oracle E-Business Suite 的公司在整合雲端運輸管理系統 (TMS) 時,由於舊有系統缺乏最新的 API,將面臨 50 萬至 300 萬美元的成本。隨著 ERP 實例數量的增加,複雜性也隨之增加,因為客戶、產品和位置主資料必須進行雙向對應。曼哈頓顧問公司 (Manhattan Associates) 的報告顯示,2024 年整合專案的專業服務收入年增 18%,凸顯了這些挑戰的嚴峻性。一些製造商正在推遲運輸管理系統 (TMS) 的實施,直到更廣泛的數位轉型完成,這導致實施時間延遲數年。這種負擔對資本密集產業的影響最為沉重,而數位化原生零售商只需幾週即可完成雲端 TMS 的部署。
細分市場分析
預計到2025年,陸運貨運將佔運輸管理系統市場的56.91%,凸顯了整車運輸和零擔(小到大)服務在國內物流領域的持續主導地位。同時,空運預計將以9.83%的複合年成長率(CAGR)實現最高成長。這主要歸功於製藥公司將高價值生物製藥產品轉向空運,將門到門運輸時間縮短至48小時以內,並降低了溫度偏差的風險。國際航空運輸協會(IATA)的「ONE Record」標準允許航空公司和貨運代理商即時發布預訂和狀態API,進一步擴大了以航空為中心的運輸管理系統(TMS)的市場規模。多式聯運模組能夠同步鐵路和公路之間的貨櫃轉運,幫助鐵路在1600公里長的線路上保持競爭力,但由於其調度柔軟性有限,難以快速響應需求激增,因此其成長速度落後於空運。海運用戶依賴專用的貨櫃追蹤擴展程序,該程序在一個控制中心內提供船舶時刻表、港口堵塞情況和短途運輸(陸路運輸)預訂的可見性。
隨著亞馬遜航空計劃在2025年將機隊規模擴大至110架飛機,航空貨運技術的應用加速發展,零售商現在要求能夠即時掌握跨境電商包裹的運輸狀態。總部位於柏林的貨運平台Cargo.one已與100家航空公司合作,構建了一個直接連接主流運輸管理系統(TMS)供應商的一鍵預訂門戶,將報價週期從三天縮短至幾秒鐘。監管壓力也在推動這項技術的應用。國際民航組織(ICAO)的CORSIA框架要求航空公司計算貨物運輸相關的碳排放量,而能夠提供排放數據和成本資訊的TMS模組正在影響航空公司的選擇。隨著小規模托運人能夠獲得即時的現貨運輸時段,網路密度不斷提高,裝載率不斷提升,運輸管理系統(TMS)的市場價值提案也進一步增強。
預計到2025年,雲端解決方案將佔總營收的61.23%,複合年成長率達9.61%,優於其他解決方案。這主要得益於付費使用制模式,該模式可根據出貨量進行擴展,這對季節性波動顯著的零售商而言至關重要。 TMS客戶也非常欣賞每月更新的功能,這使得他們能夠在不停機的情況下快速實現合規性更新和AI升級——這是傳統本地部署架構所無法提供的柔軟性。混合模式將主資料保留在本地,同時在雲端進行處理,這種模式對必須證明資料駐留的受監管行業極具吸引力,但整體成長仍然緩慢。供應商正逐步淘汰其本地部署藍圖, Oracle已於2025年發布了最後一個主要的本地部署功能包,並將工程資源轉移到其SaaS版本。
Blue Yonder宣布已於2024年在微軟Azure上重建了其Luminate套件,使客戶能夠在六個月內將計劃週期縮短40%,並將負載整合效率提高12%。 Kuebix和3Gtms提供的免費加值服務使入門級功能得以普及,而高級分析功能則以按需付費的方式提供,這使得微企業也能成為現實的買家。人工智慧和機器學習工作負載正在利用雲端資料中心中GPU加速的叢集,從而實現能夠預測前置作業時間變化和碳足跡的貨運模型。隨著雲端提供者通過嚴格的審計,安全性擔憂持續緩解,而安全漏洞事件擴大與本地伺服器修補不足有關。因此,運輸管理系統(TMS)市場正在不可逆轉地向SaaS模式轉變。
區域分析
預計到2025年,北美將佔據運輸管理系統(TMS)市場最大的區域佔有率,達到42.67%,這主要得益於電子商務的普及、電子日誌記錄器(ELD)的嚴格執行以及分散的承運商群體導致協調複雜性增加。儘管隨著部署趨於飽和,成長速度有所放緩,但由於高級人工智慧功能、與自動駕駛車輛的整合以及碳排放最佳化模組,收入仍在成長。亞太地區預計到2031年將以9.91%的複合年成長率成長,這主要受中國降低10%物流成本的指令以及印度強制要求貨物單據數位化的電子運單系統的推動。在中國,地方政府為實施經認證的TMS的承運商提供高達30%的軟體成本補助。同時,在印度,與市場平台的整合正在創造價值,可以將1,200萬小規模卡車司機分散的車隊的閒置時間從40%減少到25%。
歐洲也佔據了相當大的市場佔有率,德國、法國和英國擴大採用運輸管理系統 (TMS) 來應對跨境海關程序的複雜性以及「Fit for 55」碳排放報告要求。提供本地多語言介面和符合增值稅規定的發票功能的供應商正展現出優勢。在中東和非洲,尤其是在阿拉伯聯合大公國和沙烏地阿拉伯,各國正在投資海關程序的自動化,以促進經濟多元化。杜拜環球港務集團 (DP World) 於 2024 年在其全球碼頭實施 Oracle 運輸管理系統,使貨櫃停留時間縮短了 18%。在南美洲,儘管面臨系統整合成本上升和外匯波動等不利因素,巴西和阿根廷的航運公司正在採用輕量級路線最佳化應用程式來抵消柴油價格飆升的影響。在日本,老化的駕駛團隊正在推動向人工智慧驅動的調度系統轉型,以減少加班時間,從而提振當地需求。
創投的流入正推動物流科技新創企業蓬勃發展。 2024年,亞太地區的物流科技新創企業共籌集了42億美元資金,確保了本土創新人才的源源不絕。馬來西亞國家物流計畫和澳洲貨運與供應鏈策略等政府藍圖,加上創業投資支持、津貼稅額扣抵等政策,正在加速中小企業對物流科技的採納。
其他好處:
- Excel格式的市場預測(ME)表
- 3個月的分析師支持
目錄
第1章:引言
- 研究假設和市場定義
- 調查範圍
第2章:調查方法
第3章執行摘要
第4章 市場狀況
- 市場概覽
- 市場促進因素
- 基於雲端的TMS的採用正在加速,從而降低了服務交付成本。
- 即時回應需求,最佳化電子商務和全通路零售的最後一公里配送。
- 電子記錄設備 (ELD) 和溫室氣體排放報告法規的進步正在推動貨運數位化。
- 貨運市場與交易平台的整合,使得動態運輸能力的取得成為可能。
- AI驅動的預測ETA工具可減少停留時間和SLA違約費用。
- 開放原始碼遙測 API 和微服務為中小企業提供了模組化的 TMS。
- 市場限制因素
- 與傳統ERP/WMS系統整合成本高昂
- 雲端採用中的資料安全和隱私問題
- 公司內部缺乏足夠的資料科學人員來使用分析模組。
- 承運商和遠端資訊處理行業之間標準的不一致阻礙了多模態的透明度。
- 產業價值鏈分析
- 監理情勢
- 技術展望
- 宏觀經濟因素對市場的影響
- 波特五力分析
第5章 市場規模與成長預測
- 交通途徑
- 路
- 鐵路
- 航空
- 海上運輸
- 不同的發展
- 現場
- 雲
- 混合
- 按公司規模
- 大公司
- 小型企業
- 微企業
- 按最終用戶行業分類
- 製造業
- 零售與電子商務
- 食品/飲料
- 醫療和藥品
- 車
- 第三方物流和物流服務供應商
- 按組件
- 軟體
- 服務
- 諮詢
- 整合與部署
- 支援與維護
- 透過使用
- 訂單管理
- 路線規劃與最佳化
- 貨物審核和付款
- 即時可視化和追蹤
- 庫存和倉庫整合
- 按地區
- 北美洲
- 美國
- 加拿大
- 墨西哥
- 歐洲
- 德國
- 英國
- 法國
- 俄羅斯
- 其他歐洲國家
- 亞太地區
- 中國
- 日本
- 印度
- 韓國
- 澳洲
- 其他亞太國家
- 中東和非洲
- 中東
- 沙烏地阿拉伯
- 阿拉伯聯合大公國
- 其他中東國家
- 非洲
- 南非
- 埃及
- 其他非洲國家
- 中東
- 南美洲
- 巴西
- 阿根廷
- 其他南美國家
- 北美洲
第6章 競爭情勢
- 市場集中度
- 策略趨勢
- 市佔率分析
- 公司簡介
- SAP SE
- Oracle Corporation
- Blue Yonder Group, Inc.
- Descartes Systems Group
- Manhattan Associates
- MercuryGate International
- Trimble Transportation
- E2open LLC
- Project44, Inc.
- Transplace, LLC
- Infor Nexus
- Kinaxis Inc.
- CH Robinson
- BluJay Solutions
- CargoSmart Ltd.
- 3Gtms Inc.
- Alpega Group
- KUEBIX LLC
- WiseTech Global Limited
第7章 市場機會與未來展望
According to Mordor Intelligence, the transportation management system market size is USD 9.71 billion in 2026 and is projected to reach USD 14.89 billion by 2031, advancing at an 8.93% CAGR.
This report is Segmented by Mode of Transportation (Roadways, and More), Deployment (On-Premise, Cloud, Hybrid), Enterprise Size (Large Enterprises, Micro Enterprises, and More), End-User Industry (Manufacturing, Automotive, and More), Component (Software, and Services), Application (Order Management, and More), and Geography. The Market Forecasts are Provided in Terms of Value (USD).
Global Transportation Management System Market Trends and Insights
Cloud-Based TMS Adoption Accelerates Cost-to-Serve Savings
Multi-tenant cloud platforms deliver 15-25% freight-cost reductions by pooling shipper demand, automating carrier selection through real-time rate shopping, and scaling compute elastically during peak seasons. The Transportation Management System market benefits from subscription pricing, which eliminates capital expenditure and aligns vendor incentives with on-time, cost-efficient execution. Oracle and SAP migrated their routing engines to in-memory architectures in 2024, cutting plan-to-execute latency from minutes to seconds, while Blue Yonder fused demand sensing with routing decisions to proactively shift inventory, reducing stockout risk. The ability to launch new features monthly rather than annually keeps functionality current as regulations evolve. Enterprises also avoid hardware refresh cycles, channeling savings toward data-science talent and continuous improvement programs.
E-Commerce and Omnichannel Retail Demand Real-Time, Last-Mile Optimisation
Same-day delivery promises shorten planning windows from days to hours, forcing retailers to embed advanced route-resequencing logic into their Transportation Management System workflows. Amazon's expansion of its Delivery Service Partner network to 4,500 contractors in 2024 heightened demand for light mobile interfaces that sync with consumer-facing tracking pages. Route-density algorithms trimmed per-package urban delivery cost by 30-40% for high-volume shippers, a saving impossible without cloud elasticity and granular telemetry. Crowdsourced delivery models require dynamic capacity matching and real-time bidding, capabilities that legacy on-premise platforms cannot meet. Micro-fulfillment centers, typically placed within 16 km of dense population clusters, amplify the need for systems that co-optimize inventory positioning and dispatch decisions every 15-30 minutes.
High Integration Cost with Legacy ERP/WMS Stacks
Enterprises running SAP ECC or Oracle E-Business Suite incur integration bills of USD 500,000 to USD 3 million when layering a cloud TMS, as legacy systems lack modern APIs. Each additional ERP instance increases complexity, as customer, product, and location master data must be bidirectionally mapped. Manhattan Associates reported an 18% year-over-year increase in professional services revenue from integration projects in 2024, underscoring this friction. Some manufacturers postpone adoption of the Transportation Management System market until broader digital transformations are complete, stretching deployment timelines by several years. The burden falls hardest on capital-intensive verticals, leaving digitally native retailers free to implement a cloud TMS in weeks.
Other drivers and restraints analyzed in the detailed report include:
- AI-Driven Predictive ETA Tools Cut Detention/SLA Penalties
- Regulatory Push for ELD and Greenhouse Gas Reporting Digitalises Freight
- Data-Security and Privacy Concerns for Cloud Deployments
For complete list of drivers and restraints, kindly check the Table Of Contents.
Segment Analysis
Road freight dominated in 2025, with a 56.91% share of the Transportation Management System market, underscoring the continued primacy of truckload and less-than-truckload services for domestic distribution. Air freight, however, is recording the fastest 9.83% CAGR because pharmaceutical manufacturers have pivoted high-value biologics onto flights that cut door-to-door transit to below 48 hours, thereby curbing temperature-excursion risk. The Transportation Management System market size for air-centric workflows is expanding further as the International Air Transport Association ONE Record standard enables airlines and forwarders to expose booking and status APIs in real time. Intermodal modules that synchronize container transfers between rail and truck help sustain rail competitiveness on 1,600 km lanes, yet growth lags air because schedule rigidity limits rapid response to demand spikes. Ocean freight users rely on specialized container-tracking extensions that map vessel schedules, port congestion, and drayage appointments within a single control tower.
Air-freight technology adoption accelerated when Amazon Air grew its fleet to 110 aircraft in 2025, prompting retailers to demand minute-level status feeds for cross-border e-commerce packages. Berlin-based marketplace Cargo.one integrated with 100 airlines to create a one-click booking portal linked directly to leading TMS vendors, collapsing the traditional three-day quote cycle to seconds. Regulatory pressure intensifies uptake: the International Civil Aviation Organization CORSIA framework obliges airlines to allocate carbon emissions to shipments, so TMS modules that present emissions data alongside costs now influence carrier selection. As small shippers access instant spot capacity, network density rises, improving load factors and further enhancing the Transportation Management System market value proposition.
Cloud solutions captured 61.23% revenue in 2025 and are outpacing alternatives at a 9.61% CAGR because pay-as-you-go billing scales with shipment counts, a decisive factor for seasonally volatile retailers. TMS customers also value monthly feature releases that deliver rapid regulatory updates and AI upgrades without downtime, a flexibility unavailable in legacy on-premise architectures. Hybrid models retain master data locally but process execution in the cloud, appealing to regulated industries that must prove data residency, yet overall growth remains slower. Vendors have begun sunsetting on-premise roadmaps; Oracle issued its final major on-premise feature pack in 2025, redirecting engineering capacity to its SaaS edition.
Blue Yonder rebuilt its Luminate suite on Microsoft Azure in 2024, stating that customers cut planning cycles by 40% and improved load consolidation by 12% within six months. Microenterprises are now viable buyers because freemium offerings from Kuebix and 3Gtms unlock entry-level functionality, with premium analytics sold a la carte. AI and machine-learning workloads leverage GPU-accelerated clusters in cloud data centers, enabling shipment-type-specific models that predict lead-time variability and carbon footprint. Security concerns continue to diminish as cloud providers pass stringent audits and as breach headlines increasingly implicate poorly patched on-premise servers. Consequently, the Transportation Management System market is tilting irreversibly toward SaaS.
Complete Report Scope:
- By Mode of Transportation
- Roadways
- Railways
- Airways
- Maritime
- By Deployment
- On-Premise
- Cloud
- Hybrid
- By Enterprise Size
- Large Enterprises
- Small and Medium Enterprises
- Micro Enterprises
- By End-User Industry
- Manufacturing
- Retail and E-Commerce
- Food and Beverage
- Healthcare and Pharmaceuticals
- Automotive
- 3PL and Logistics Service Providers
- By Component
- Software
- Services
- Consulting
- Integration and Implementation
- Support and Maintenance
- By Application
- Order Management
- Route Planning and Optimization
- Freight Audit and Payment
- Real-Time Visibility and Tracking
- Inventory and Warehouse Integration
- By Geography
- North America
- United States
- Canada
- Mexico
- Europe
- Germany
- United Kingdom
- France
- Russia
- Rest of Europe
- Asia-Pacific
- China
- Japan
- India
- South Korea
- Australia
- Rest of Asia-Pacific
- Middle East and Africa
- Middle East
- Saudi Arabia
- United Arab Emirates
- Rest of Middle East
- Africa
- South Africa
- Egypt
- Rest of Africa
- Middle East
- South America
- Brazil
- Argentina
- Rest of South America
- North America
Geography Analysis
North America held the largest regional share in 2025 at 42.67% of the Transportation Management System market, thanks to mature e-commerce penetration, stringent enforcement of electronic logging devices, and a fragmented carrier base that intensifies orchestration complexity. Growth steadies as adoption reaches saturation, yet revenue expands from premium AI features, autonomous-vehicle integrations, and carbon-optimization modules. Asia-Pacific advances at a 9.91% CAGR through 2031, led by China's mandate to trim logistics costs by 10% and India's e-way bill system that compels digital freight paperwork. Provincial subsidies in China reimburse up to 30% of software costs for carriers adopting certified TMS, while India's fragmented fleet of 12 million small truckers finds value in marketplace integrations that lower empty-mile ratios from 40% to 25%.
Europe holds a substantial slice, with Germany, France, and the United Kingdom embracing TMS to address cross-border customs complexity and the Fit for 55 carbon-reporting mandates. Vendors with native multilingual interfaces and VAT-compliant invoicing gain an edge. The Middle East and Africa region, particularly the United Arab Emirates and Saudi Arabia, invests in customs-clearance automation to diversify economies; DP World's 2024 rollout of Oracle Transportation Management across global terminals cut container dwell times by 18%. South America confronts integration cost headwinds and currency volatility, yet Brazilian and Argentine carriers adopt lightweight route-optimization apps to offset diesel inflation. Japan's aging driver workforce is pushing fleets toward AI-assisted dispatching to reduce overtime, reinforcing local demand.
Venture capital inflows add fuel: Asia-Pacific logistics-tech startups raised USD 4.2 billion in 2024, ensuring a pipeline of localized innovations. Government blueprints, such as Malaysia's National Logistics Plan and Australia's Freight and Supply Chain Strategy, layer grants and tax deductions on top of venture backing, accelerating small-enterprise adoption.
- SAP SE
- Oracle Corporation
- Blue Yonder Group, Inc.
- Descartes Systems Group
- Manhattan Associates
- MercuryGate International
- Trimble Transportation
- E2open LLC
- Project44, Inc.
- Transplace, LLC
- Infor Nexus
- Kinaxis Inc.
- C.H. Robinson
- BluJay Solutions
- CargoSmart Ltd.
- 3Gtms Inc.
- Alpega Group
- KUEBIX LLC
- WiseTech Global Limited
Additional Benefits:
- The market estimate (ME) sheet in Excel format
- 3 months of analyst support
TABLE OF CONTENTS
1 INTRODUCTION
- 1.1 Study Assumptions and Market Definition
- 1.2 Scope of the Study
2 RESEARCH METHODOLOGY
3 EXECUTIVE SUMMARY
4 MARKET LANDSCAPE
- 4.1 Market Overview
- 4.2 Market Drivers
- 4.2.1 Cloud-Based TMS Adoption Accelerates Cost-to-Serve Savings
- 4.2.2 E-Commerce and Omnichannel Retail Demand Real-Time, Last-Mile Optimisation
- 4.2.3 Regulatory Push for ELD and Greenhouse Gas Reporting Digitalises Freight
- 4.2.4 Freight-Marketplace Convergence Enables Dynamic Capacity Procurement
- 4.2.5 AI-Driven Predictive ETA Tools Cut Detention/SLA Penalties
- 4.2.6 Open-Source Telemetry APIs and Micro-Services Unlock Modular TMS for SMEs
- 4.3 Market Restraints
- 4.3.1 High Integration Cost with Legacy ERP/WMS Stacks
- 4.3.2 Data-Security and Privacy Concerns for Cloud Deployments
- 4.3.3 Shortage of In-House Data-Science Talent to Exploit Analytics Modules
- 4.3.4 Fragmented Carrier-Telematics Standards Hinder Multimodal Visibility
- 4.4 Industry Value Chain Analysis
- 4.5 Regulatory Landscape
- 4.6 Technological Outlook
- 4.7 Impact of Macroeconomic Factors on the Market
- 4.8 Porter's Five Forces Analysis
- 4.8.1 Threat of New Entrants
- 4.8.2 Bargaining Power of Buyers
- 4.8.3 Bargaining Power of Suppliers
- 4.8.4 Threat of Substitutes
- 4.8.5 Competitive Rivalry
5 MARKET SIZE AND GROWTH FORECASTS (VALUE)
- 5.1 By Mode of Transportation
- 5.1.1 Roadways
- 5.1.2 Railways
- 5.1.3 Airways
- 5.1.4 Maritime
- 5.2 By Deployment
- 5.2.1 On-Premise
- 5.2.2 Cloud
- 5.2.3 Hybrid
- 5.3 By Enterprise Size
- 5.3.1 Large Enterprises
- 5.3.2 Small and Medium Enterprises
- 5.3.3 Micro Enterprises
- 5.4 By End-User Industry
- 5.4.1 Manufacturing
- 5.4.2 Retail and E-Commerce
- 5.4.3 Food and Beverage
- 5.4.4 Healthcare and Pharmaceuticals
- 5.4.5 Automotive
- 5.4.6 3PL and Logistics Service Providers
- 5.5 By Component
- 5.5.1 Software
- 5.5.2 Services
- 5.5.2.1 Consulting
- 5.5.2.2 Integration and Implementation
- 5.5.2.3 Support and Maintenance
- 5.6 By Application
- 5.6.1 Order Management
- 5.6.2 Route Planning and Optimization
- 5.6.3 Freight Audit and Payment
- 5.6.4 Real-Time Visibility and Tracking
- 5.6.5 Inventory and Warehouse Integration
- 5.7 By Geography
- 5.7.1 North America
- 5.7.1.1 United States
- 5.7.1.2 Canada
- 5.7.1.3 Mexico
- 5.7.2 Europe
- 5.7.2.1 Germany
- 5.7.2.2 United Kingdom
- 5.7.2.3 France
- 5.7.2.4 Russia
- 5.7.2.5 Rest of Europe
- 5.7.3 Asia-Pacific
- 5.7.3.1 China
- 5.7.3.2 Japan
- 5.7.3.3 India
- 5.7.3.4 South Korea
- 5.7.3.5 Australia
- 5.7.3.6 Rest of Asia-Pacific
- 5.7.4 Middle East and Africa
- 5.7.4.1 Middle East
- 5.7.4.1.1 Saudi Arabia
- 5.7.4.1.2 United Arab Emirates
- 5.7.4.1.3 Rest of Middle East
- 5.7.4.2 Africa
- 5.7.4.2.1 South Africa
- 5.7.4.2.2 Egypt
- 5.7.4.2.3 Rest of Africa
- 5.7.4.1 Middle East
- 5.7.5 South America
- 5.7.5.1 Brazil
- 5.7.5.2 Argentina
- 5.7.5.3 Rest of South America
- 5.7.1 North America
6 COMPETITIVE LANDSCAPE
- 6.1 Market Concentration
- 6.2 Strategic Moves
- 6.3 Market Share Analysis
- 6.4 Company Profiles {(includes Global level Overview, Market level overview, Core Segments, Financials as available, Strategic Information, Market Rank/Share for key companies, Products and Services, and Recent Developments)}
- 6.4.1 SAP SE
- 6.4.2 Oracle Corporation
- 6.4.3 Blue Yonder Group, Inc.
- 6.4.4 Descartes Systems Group
- 6.4.5 Manhattan Associates
- 6.4.6 MercuryGate International
- 6.4.7 Trimble Transportation
- 6.4.8 E2open LLC
- 6.4.9 Project44, Inc.
- 6.4.10 Transplace, LLC
- 6.4.11 Infor Nexus
- 6.4.12 Kinaxis Inc.
- 6.4.13 C.H. Robinson
- 6.4.14 BluJay Solutions
- 6.4.15 CargoSmart Ltd.
- 6.4.16 3Gtms Inc.
- 6.4.17 Alpega Group
- 6.4.18 KUEBIX LLC
- 6.4.19 WiseTech Global Limited
7 MARKET OPPORTUNITIES AND FUTURE OUTLOOK
- 7.1 White-Space and Unmet-Need Assessment

 運輸管理系統市場:按組件、運輸方式、部署類型、應用程式、最終用戶和企業規模分類-2026-2032年全球市場預測
 2026年全球倉庫穿梭車軟體市場報告
 運輸管理系統市場分析及預測(至2035年):類型、產品、服務、技術、組件、應用、部署模式、最終用戶、模組、解決方案
 運輸管理系統 (TMS) 市場預測至 2034 年—按組件、部署模式、運輸方式、功能、應用、最終用戶和地區分類的全球分析
 運輸管理系統市場報告:按運輸方式、產品/服務、部署類型、應用和地區分類(2026-2034 年)
 全球運輸管理市場規模、佔有率、趨勢和成長分析報告(2026-2034年)2026年全球接駁車調度軟體市場報告2026年全球運輸管理系統市場報告
 2026-2030年全球交流運輸管理系統市場
 短途運輸管理市場規模、佔有率和成長分析:按產品類型、應用和地區分類-產業預測(2026-2033 年)