


 |
市場調查報告書
商品編碼
1892821
運輸管理系統市場機會、成長促進因素、產業趨勢分析及預測(2026-2035年)Transportation Management System Market Opportunity, Growth Drivers, Industry Trend Analysis, and Forecast 2026 -2035 |
||||||
2025 年全球運輸管理系統市場價值為 150 億美元,預計到 2035 年將以 10.6% 的複合年成長率成長至 403 億美元。
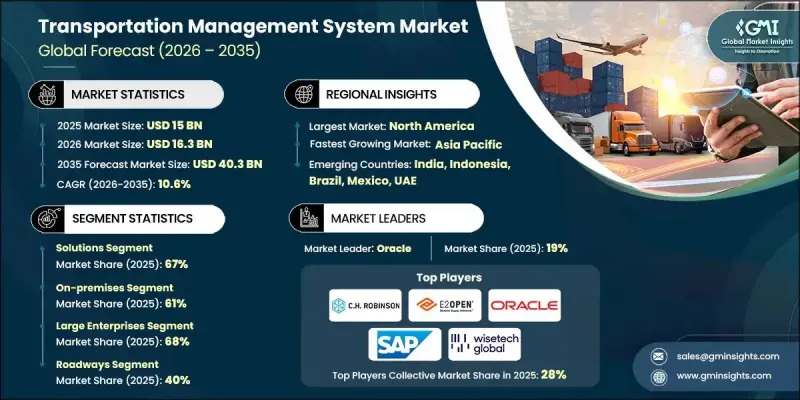
電子商務的快速成長顯著增加了包裹和零擔貨運量,同時也縮短了交貨預期,導致人工路線規劃和問題解決成本更高、效率更低。隨著雲端原生平台降低前期投資並縮短部署週期,各種規模的企業都在轉向運輸管理系統 (TMS) 以簡化營運。供應商正在利用微服務、更廣泛的 API 存取和嵌入式人工智慧重新設計其平台,以改善預計到達時間 (ETA) 的預測、實現定價自動化並最佳化運力利用率。因此,TMS 平台現在被視為建立可靠、可擴展運輸營運的關鍵工具,而不僅僅是降低成本的途徑。隨著全球供應鏈日益互聯互通和多模式,企業需要能夠協調承運商、實現文件數位化、支援合規性並增強跨境可視性的系統。 TMS 平台現在結合了 GPS資料、遠端資訊處理和物聯網訊號,提供即時追蹤,從而增強物流團隊和終端客戶的透明度。
| 市場範圍 | |
|---|---|
| 起始年份 | 2025 |
| 預測年份 | 2026-2035 |
| 起始值 | 150億美元 |
| 預測值 | 403億美元 |
| 複合年成長率 | 10.6% |
解決方案領域在2025年佔據67%的市場佔有率,預計2025年至2035年間將以10%的複合年成長率成長。核心運輸管理系統(TMS)平台負責管理計畫、執行、路線規劃、貨運資源調配、發票處理、物流視覺化和分析。其自動化工作流程和提供即時洞察的能力推動了其強勁的市場普及。未來,人工智慧賦能的路線最佳化、預測分析和物聯網增強的物流視覺化等新興功能將進一步推動其成長。
到2025年,本地部署市場佔有率將達到61%,預計到2035年將以9.2%的複合年成長率成長。儘管由於客製化和資料控制方面的要求,本地部署解決方案仍保持著較高的收入佔有率,但隨著企業採用模組化平台、更快的實施週期和基於使用量的定價模式,雲端部署的成長速度仍在持續加快。混合架構正日益受到青睞,因為企業需要在滿足監管要求的同時兼顧現代分析和工作流程自動化。
預計2025年,美國運輸管理系統市場規模將達52億美元。美國在採用人工智慧驅動的雲端運輸管理系統平台方面仍處於領先地位,這得益於其複雜的國內貨運格局以及不斷成長的服務品質提升壓力。由於公路、貨運、包裹和最後一公里配送等運輸網路面臨勞動力短缺和需求波動,預測規劃工具、自動化和即時資料整合至關重要。
目錄
第1章:方法論
第2章:執行概要
第3章:行業洞察
- 產業生態系分析
- 供應商格局
- 利潤率
- 成本結構
- 每個階段的價值增加
- 影響價值鏈的因素
- 中斷
- 產業影響因素
- 成長促進因素
- 電子商務和線上零售需求不斷成長
- 供應鏈全球化
- 需要即時貨運可見性
- 越來越重視成本最佳化
- 產業陷阱與挑戰
- 初始實施成本高
- 資料安全和合規性挑戰
- 市場機遇
- 新興市場的擴張
- 中小企業成長
- 車隊電氣化與綠色物流
- 與第三方物流和物流供應商建立合作關係
- 成長促進因素
- 成長潛力分析
- 監管環境
- 北美洲
- FMCSA電子記錄設備(ELD)強制命令
- 服務時間(HOS)規定
- 美國交通部安全法規(CFR 第 300-399 部分)
- 歐洲
- 貨運資料符合GDPR規定
- C-ITS(合作式智慧交通系統)
- 跨境運輸法規
- 亞太地區
- 中國投資與標準
- 印度商品及服務稅對物流的影響
- 東協跨境運輸便利化
- 拉丁美洲
- 中東和非洲
- 北美洲
- 波特的分析
- PESTEL 分析
- 技術與創新格局
- 當前技術趨勢
- 雲端原生微服務架構
- 人工智慧與機器學習的融合
- 新興技術
- 用於網路建模的數位孿生技術
- 自動駕駛汽車整合準備情況
- 當前技術趨勢
- 定價分析
- SaaS訂閱定價模式
- 永久授權定價
- 按交易量定價(每次出貨)
- 基於使用者的定價模式
- 成本細分分析
- 專利分析
- TMS技術的美國專利商標局專利分類
- 主要專利持有者和創新領導者
- 新興專利趨勢(人工智慧、區塊鏈、物聯網)
- 永續性和環境方面
- 永續實踐
- 減少廢棄物策略
- 生產中的能源效率
- 環保舉措
- 碳足跡考量
- 用例
- 零售與電子商務應用案例經濟學
- 醫療保健和製藥應用案例經濟學
- 食品飲料應用案例經濟學
- 第三方物流和貨運代理的應用案例經濟學
- 功能採用率和利用率分析
- 核心功能採用率
- 進階功能採用率
- 新興功能採用率
- 各行業垂直領域的功能採用情況
- 遷移模式和轉換趨勢
- TMS遷移促進因素
- 按部署類型分類的遷移模式
- 供應商轉換趨勢
- 遷移時間表及複雜性
第4章:競爭格局
- 介紹
- 公司市佔率分析
- 北美洲
- 歐洲
- 亞太地區
- 拉丁美洲
- MEA
- 主要市場參與者的競爭分析
- 競爭定位矩陣
- 戰略展望矩陣
- 關鍵進展
- 併購
- 合作夥伴關係與合作
- 新產品發布
- 擴張計劃和資金
- 對TMS新創公司的創投
- 物流技術領域的私募股權活動
- 政府基礎設施投資(世界銀行資訊科技服務報告)
- 主要供應商的企業研發支出
- 供應商選擇標準
- 市場進入策略
第5章:市場估算與預測:依平台分類,2021-2034年
- 解決方案
- 出貨計劃
- 訂單管理
- 審計與付款
- 分析與報告
- 路線規劃與追蹤
- 其他
- 服務
- 諮詢
- 實施與整合
- 支援與維護
第6章:市場估計與預測:依運輸方式分類,2021-2034年
- 道路
- 鐵路
- 航空
- 水道
第7章:市場估算與預測:依部署模式分類,2021-2034年
- 現場
- 雲
第8章:市場估算與預測:依企業規模分類,2021-2034年
- 大型企業
- 中小企業
第9章:市場估計與預測:依產業垂直領域分類,2021-2034年
- 零售與電子商務
- 醫療保健與製藥
- 分銷與物流
- 製造業
- 政府
- 其他
第10章:市場估計與預測:依地區分類,2021-2034年
- 北美洲
- 美國
- 加拿大
- 歐洲
- 德國
- 英國
- 法國
- 義大利
- 西班牙
- 北歐
- 俄羅斯
- 波蘭
- 羅馬尼亞
- 亞太地區
- 中國
- 印度
- 日本
- 韓國
- 澳新銀行
- 越南
- 印尼
- 拉丁美洲
- 巴西
- 墨西哥
- 阿根廷
- MEA
- 南非
- 沙烏地阿拉伯
- 阿拉伯聯合大公國
第11章:公司簡介
- 全球公司
- Blue Yonder
- CH Robinson
- Descartes
- E2 open
- Infor
- Manhattan Associates
- Oracle
- SAP
- Trimble
- Wise Tech Global
- 區域玩家
- 11.2.1. Gtms
- Alpega
- Blujay Solutions
- CTSI-Global
- Korber
- Kuebix
- Logility
- MercuryGate
- Shippeo
- Transporeon
- 新興玩家
- Arrive Logistics
- FourKites
- Loadsmart
- Locus
- Motive
- Parade
- project44
- Samsara
- Shipsy
- Transfix
The Global Transportation Management System Market was valued at USD 15 billion in 2025 and is estimated to grow at a CAGR of 10.6% to reach USD 40.3 billion by 2035.
Rapid growth in e-commerce has significantly increased parcel and LTL activity while shortening delivery expectations, making manual routing and issue resolution more expensive and less effective. As cloud-native platforms reduce upfront investment and shorten deployment timelines, organizations of all sizes are turning to Transportation Management Systems to streamline operations. Vendors are redesigning their platforms with microservices, broader API access, and embedded AI to improve predictive ETAs, automate pricing, and optimize capacity utilization. As a result, TMS platforms are now viewed as essential tools for building reliable, scalable transportation operations rather than solely an avenue for cost reduction. With global supply chains growing more interconnected and multimodal, businesses need systems that coordinate carriers, digitize documentation, support compliance, and enhance cross-border visibility. TMS platforms now combine GPS data, telematics, and IoT signals to offer real-time tracking, strengthening transparency for both logistics teams and end customers.
| Market Scope | |
|---|---|
| Start Year | 2025 |
| Forecast Year | 2026-2035 |
| Start Value | $15 Billion |
| Forecast Value | $40.3 Billion |
| CAGR | 10.6% |
The solutions segment held a 67% share in 2025 and is expected to grow at a CAGR of 10% from 2025 to 2035. Core TMS platforms manage planning, execution, routing, freight sourcing, invoicing, visibility, and analytics. Their ability to automate workflows and deliver real-time insights drives their strong adoption curve. Future growth will be supported by emerging capabilities such as AI-enabled route optimization, predictive analytics, and IoT-enhanced visibility.
The on-premises segment held a 61% share in 2025 and is projected to grow at a CAGR of 9.2% through 2035. While on-premises solutions maintain a larger revenue share due to customization and data control requirements, cloud deployments continue to grow more quickly as organizations adopt modular platforms, faster implementation cycles, and usage-based pricing models. Hybrid architectures are gaining traction as companies balance regulatory needs with modern analytics and workflow automation.
US Transportation Management System Market generated USD 5.2 billion in 2025. The country remains a leader in adopting AI-driven and cloud-based TMS platforms, supported by a complex domestic freight landscape and rising pressure to enhance service quality. Predictive planning tools, automation, and real-time data integration are essential as transportation networks across road, freight, parcel, and last-mile delivery face labor shortages and fluctuating demand.
Major players in the Global Transportation Management System Market include SAP, Oracle, CH Robinson, Trimble, Manhattan Associates, Blue Yonder, MercuryGate International, E2open, Descartes, and Wise Tech Global. Companies operating in the Transportation Management System Market strengthen their competitive position by investing heavily in AI automation, modular platform designs, and advanced analytics that enhance forecasting accuracy and shipment visibility. Many organizations expand through strategic integrations with telematics providers, freight platforms, and warehouse management systems, creating unified logistics ecosystems for their customers. Vendors also focus on cloud-native architectures that deliver continuous updates and scalable deployments, enabling clients to adopt new features without operational disruption. Customized solutions for different transportation modes, along with flexible pricing based on shipment volume or usage, help broaden customer reach. Partnerships with carriers and 3PLs further enhance network data quality, ensuring TMS platforms deliver more reliable insights and measurable efficiency gains.
Table of Contents
Chapter 1 Methodology
- 1.1 Market scope and definition
- 1.2 Research design
- 1.2.1 Research approach
- 1.2.2 Data collection methods
- 1.3 Data mining sources
- 1.3.1 Global
- 1.3.2 Regional/Country
- 1.4 Base estimates and calculations
- 1.4.1 Base year calculation
- 1.4.2 Key trends for market estimation
- 1.5 Primary research and validation
- 1.5.1 Primary sources
- 1.6 Forecast model
- 1.7 Research assumptions and limitations
Chapter 2 Executive Summary
- 2.1 Industry 360° synopsis
- 2.2 Key market trends
- 2.2.1 Regional
- 2.2.2 Platform
- 2.2.3 Transportation mode
- 2.2.4 Deployment mode
- 2.2.5 Enterprise size
- 2.2.6 Industry vertical
- 2.3 TAM analysis, 2025-2034
- 2.4 CXO perspectives: Strategic imperatives
- 2.4.1 Executive decision points
- 2.4.2 Critical success factors
- 2.5 Future outlook
- 2.6 Strategic recommendations
Chapter 3 Industry Insights
- 3.1 Industry ecosystem analysis
- 3.1.1 Supplier landscape
- 3.1.2 Profit margin
- 3.1.3 Cost structure
- 3.1.4 Value addition at each stage
- 3.1.5 Factor affecting the value chain
- 3.1.6 Disruptions
- 3.2 Industry impact forces
- 3.2.1 Growth drivers
- 3.2.1.1 Rising e-commerce and online retail demand
- 3.2.1.2 Globalization of supply chains
- 3.2.1.3 Need for real-time shipment visibility
- 3.2.1.4 Increasing focus on cost optimization
- 3.2.2 Industry pitfalls and challenges
- 3.2.2.1 High initial implementation cost
- 3.2.2.2 Data security and compliance challenges
- 3.2.3 Market opportunities
- 3.2.3.1 Expansion in emerging markets
- 3.2.3.2 Growth in small and medium-sized enterprises (SMEs)
- 3.2.3.3 Fleet electrification and green logistics
- 3.2.3.4 Partnerships with 3PL and logistics providers
- 3.2.1 Growth drivers
- 3.3 Growth potential analysis
- 3.4 Regulatory landscape
- 3.4.1 North America
- 3.4.1.1 FMCSA Electronic Logging Device (ELD) mandate
- 3.4.1.2 Hours-of-Service (HOS) regulations
- 3.4.1.3 DOT safety regulations (CFR Parts 300-399)
- 3.4.2 Europe
- 3.4.2.1 GDPR compliance for shipment data
- 3.4.2.2 C-ITS (Cooperative Intelligent Transport Systems)
- 3.4.2.3 Cross-border transportation regulations
- 3.4.3 Asia Pacific
- 3.4.3.1 China ITS investment & standards
- 3.4.3.2 India GST impact on logistics
- 3.4.3.3 ASEAN cross-border transport facilitation
- 3.4.4 Latin America
- 3.4.5 Middle East & Africa
- 3.4.1 North America
- 3.5 Porter's analysis
- 3.6 PESTEL analysis
- 3.7 Technology and innovation landscape
- 3.7.1 Current technological trends
- 3.7.1.1 Cloud-native microservices architecture
- 3.7.1.2 Artificial Intelligence & Machine Learning integration
- 3.7.2 Emerging technologies
- 3.7.2.1 Digital twin technology for network modeling
- 3.7.2.2 Autonomous vehicle integration readiness
- 3.7.1 Current technological trends
- 3.8 Pricing analysis
- 3.8.1 SaaS subscription pricing models
- 3.8.2 Perpetual license pricing
- 3.8.3 Transaction-based pricing (per shipment)
- 3.8.4 User-based pricing models
- 3.9 Cost breakdown analysis
- 3.10 Patent analysis
- 3.10.1 USPTO patent classification for TMS technologies
- 3.10.2 Key patent holders & innovation leaders
- 3.10.3 Emerging patent trends (AI, Blockchain, IoT)
- 3.11 Sustainability and environmental aspects
- 3.11.1 Sustainable practices
- 3.11.2 Waste reduction strategies
- 3.11.3 Energy efficiency in production
- 3.11.4 Eco-friendly initiatives
- 3.11.5 Carbon footprint considerations
- 3.12 Use cases
- 3.12.1 Retail & e-commerce use case economics
- 3.12.2 Healthcare & pharmaceuticals use case economics
- 3.12.3 Food & beverage use case economics
- 3.12.4. 3 PL & freight forwarders use case economics
- 3.13 Feature adoption rates & utilization analysis
- 3.13.1 Core feature adoption rates
- 3.13.2 Advanced feature adoption rates
- 3.13.3 Emerging feature adoption rates
- 3.13.4 Feature adoption by industry vertical
- 3.14 Migration patterns & switching trends
- 3.14.1 TMS migration drivers
- 3.14.2 Migration patterns by deployment type
- 3.14.3 Vendor switching trends
- 3.14.4 Migration timeline & complexity
Chapter 4 Competitive Landscape, 2025
- 4.1 Introduction
- 4.2 Company market share analysis
- 4.2.1 North America
- 4.2.2 Europe
- 4.2.3 Asia Pacific
- 4.2.4 LATAM
- 4.2.5 MEA
- 4.3 Competitive analysis of major market players
- 4.4 Competitive positioning matrix
- 4.5 Strategic outlook matrix
- 4.6 Key developments
- 4.6.1 Mergers & acquisitions
- 4.6.2 Partnerships & collaborations
- 4.6.3 New product launches
- 4.6.4 Expansion plans and funding
- 4.6.4.1 Venture capital investment in TMS startups
- 4.6.4.2 Private equity activity in logistics technology
- 4.6.4.3 Government infrastructure investment (World Bank ITS report)
- 4.6.4.4 Corporate R&D spending by major vendors
- 4.7 Vendor selection criteria
- 4.8 Go-to-Market Strategies
Chapter 5 Market Estimates & Forecast, By Platform, 2021 - 2034 ($Mn)
- 5.1 Key trends
- 5.2 Solutions
- 5.2.1 Shipment planning
- 5.2.2 Order management
- 5.2.3 Audit & payments
- 5.2.4 Analytics & reporting
- 5.2.5 Routing & Tracking
- 5.2.6 Others
- 5.3 Services
- 5.3.1 Consulting
- 5.3.2 Implementation & integration
- 5.3.3 Support & maintenance
Chapter 6 Market Estimates & Forecast, By Transportation Mode, 2021 - 2034 ($Mn)
- 6.1 Key trends
- 6.2 Roadways
- 6.3 Railways
- 6.4 Airways
- 6.5 Waterways
Chapter 7 Market Estimates & Forecast, By Deployment model, 2021 - 2034 ($Mn)
- 7.1 Key trends
- 7.2 On-premises
- 7.3 Cloud
Chapter 8 Market Estimates & Forecast, By Enterprise size, 2021 - 2034 ($Mn)
- 8.1 Key trends
- 8.2 Large enterprises
- 8.3 SMEs
Chapter 9 Market Estimates & Forecast, By Industry vertical, 2021 - 2034 ($Mn)
- 9.1 Key trends
- 9.2 Retail & e-commerce
- 9.3 Healthcare & pharmaceuticals
- 9.4 Distribution & logistics
- 9.5 Manufacturing
- 9.6 Government
- 9.7 Others
Chapter 10 Market Estimates & Forecast, By Region, 2021 - 2034 ($Mn)
- 10.1 Key trends
- 10.2 North America
- 10.2.1 US
- 10.2.2 Canada
- 10.3 Europe
- 10.3.1 Germany
- 10.3.2 UK
- 10.3.3 France
- 10.3.4 Italy
- 10.3.5 Spain
- 10.3.6 Nordics
- 10.3.7 Russia
- 10.3.8 Poland
- 10.3.9 Romania
- 10.4 Asia Pacific
- 10.4.1 China
- 10.4.2 India
- 10.4.3 Japan
- 10.4.4 South Korea
- 10.4.5 ANZ
- 10.4.6 Vietnam
- 10.4.7 Indonesia
- 10.5 Latin America
- 10.5.1 Brazil
- 10.5.2 Mexico
- 10.5.3 Argentina
- 10.6 MEA
- 10.6.1 South Africa
- 10.6.2 Saudi Arabia
- 10.6.3 UAE
Chapter 11 Company Profiles
- 11.1 Global companies
- 11.1.1 Blue Yonder
- 11.1.2 C.H. Robinson
- 11.1.3 Descartes
- 11.1.4. E2 open
- 11.1.5 Infor
- 11.1.6 Manhattan Associates
- 11.1.7 Oracle
- 11.1.8 SAP
- 11.1.9 Trimble
- 11.1.10 Wise Tech Global
- 11.2 Regional players
- 11.2.1. Gtms
- 11.2.2 Alpega
- 11.2.3 Blujay Solutions
- 11.2.4 CTSI-Global
- 11.2.5 Korber
- 11.2.6 Kuebix
- 11.2.7 Logility
- 11.2.8 MercuryGate
- 11.2.9 Shippeo
- 11.2.10 Transporeon
- 11.3 Emerging players
- 11.3.1 Arrive Logistics
- 11.3.2 FourKites
- 11.3.3 Loadsmart
- 11.3.4 Locus
- 11.3.5 Motive
- 11.3.6 Parade
- 11.3.7 project44
- 11.3.8 Samsara
- 11.3.9 Shipsy
- 11.3.10 Transfix
 短途運輸管理市場規模、佔有率和成長分析:按產品類型、應用和地區分類-產業預測(2026-2033 年)
 全球運輸管理系統市場規模、佔有率、趨勢和成長分析報告(2026-2034年)
 運輸管理系統市場 - 全球產業規模、佔有率、趨勢、機會及預測(按解決方案、運輸方式、最終用戶、地區和競爭格局分類,2021-2031年)
 日本運輸管理系統市場報告:按運輸方式、交付類型、實施類型、應用和地區分類,2026-2034年
 運輸管理系統市場規模、佔有率和成長分析(按組件、部署類型、組織規模、運輸方式、最終用戶產業和地區分類)-2026-2033年產業預測
 運輸管理系統市場規模、佔有率和趨勢分析報告:按解決方案、部署類型、運輸方式、最終用途、地區和細分市場預測(2026-2033 年)
 運輸管理系統市場按組件、運輸方式、部署類型、應用程式、最終用戶和公司規模分類 - 全球預測 2025-2032
 運輸管理系統 (TMS) 市場 - 第四版
 全球運輸管理系統 (TMS) 市場(至 2030 年)按解決方案(規劃與執行、訂單管理、分析與報告、路線與追蹤)、運輸方式(公路、鐵路、空運、海運)和最終用戶分類2025 年至 2033 年交通管理系統市場報告(按交通方式、產品、部署類型、應用和地區)