

 |
市場調查報告書
商品編碼
2064082
功率元件分析儀市場:按類型、市場規模、最終用途和地區分類-預測至2031年Power Device Analyzer Market by Type, Current, End User, and Region - Global Forecast to 2031 |
||||||
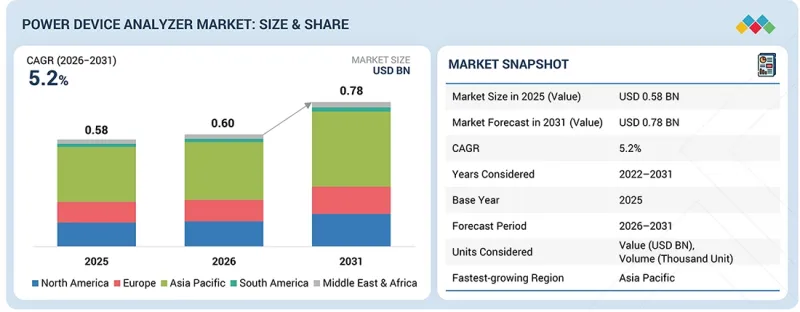
預計到 2026 年,功率元件分析儀市場規模將達到 6 億美元,到 2031 年將達到 7.8 億美元,預測期內複合年成長率為 5.2%。
電動車 (EV)、可再生能源系統、半導體製造和先進工業電子產品的快速發展,正在推動全球市場對高精度功率元件分析儀的需求大幅成長。
| 調查範圍 | |
|---|---|
| 調查期 | 2022-2031 |
| 基準年 | 2025 |
| 預測期 | 2026-2031 |
| 計算單位 | 10億美元 |
| 部分 | 按類型、按電流、依最終用途、按地區 |
| 目標區域 | 北美洲、亞太地區、歐洲、中東和非洲、南美洲 |
現代電力電子系統日益複雜,運行電壓、頻率和開關速度也越來越高,這要求製造商開發先進的測試解決方案,以便在實際運行條件下精確表徵裝置、檢驗效率並評估可靠性。功率元件分析儀正被擴大應用於半導體製造工廠、汽車電子實驗室、電池測試環境、工業自動化系統、通訊基礎設施和研究機構,用於對IGBT、MOSFET、SiC和GaN等功率半導體元件進行詳細分析。這些應用需要精確評估開關損耗、熱特性、漏電流、電容、閘極電荷和功率轉換效率,以確保裝置的最佳性能和長期運作穩定性。
隨著寬能隙半導體、電動車快速充電系統、高效率馬達驅動裝置、可再生能源逆變器和智慧電源管理系統等新一代技術的日益普及,整合自動化測試、高速波形擷取、人工智慧診斷和即時分析軟體的先進分析儀平台的需求也日益成長。製造商越來越注重提高功率密度、降低能量損耗和增強溫度控管,這使得先進的功率裝置分析解決方案在產品開發和品質保證流程中變得更加關鍵。此外,資料中心、航太電子、5G基礎設施和醫療電源系統等領域的投資增加,也推動了對可靠且節能的半導體元件的需求,為功率元件分析儀市場創造了巨大的機會。隨著半導體設計技術的不斷進步,以及對電氣化、能源效率和系統可靠性的日益重視,預計在預測期內,市場將保持持續成長。
“按類型分類,涵蓋交流和直流的細分市場預計將在預測期內成為功率裝置分析儀市場中最大的細分市場。”
在預測期內,涵蓋交流和直流兩用測試的功率元件分析儀預計將佔據功率元件分析儀市場的最大佔有率。這主要得益於現代電力電子應用整體對多功能測試解決方案日益成長的需求。電動車 (EV)、可再生能源、工業自動化、通訊、航太和家用電子電器等行業對能夠在單一整合平台上評估交流 (AC) 和直流 (DC) 功率元件的分析儀的需求日益成長。支援交流和直流測量的功率元件分析儀在測試各種半導體元件、逆變器、轉換器、馬達驅動器、電池系統和充電基礎設施方面具有高度柔軟性。這些系統能夠在各種工作條件下精確分析開關效率、諧波失真、功率損耗、漏電流、電壓穩定性、熱性能和波形特性等關鍵參數。支援多域測試的能力顯著降低了製造商和研究機構的測試複雜性、設備成本和運作。混合動力架構、雙向充電系統、可再生能源併網和先進儲能技術的日益普及,進一步推動了對能夠處理交流和直流環境的分析儀的需求。在電動車和電池製造領域,這些分析儀廣泛應用於逆變器檢驗、電池效率測試、車用充電器分析和功率模組特性分析。同樣,在太陽能逆變器和儲能平台等可再生能源系統中,也需要進行整合式交直流分析,以確保高效的功率轉換和電網相容性。
“按最終用戶分類,預計在預測期內,汽車行業將成為功率裝置分析儀市場成長最快的領域。”
在預測期內,受電動車 (EV)、高級駕駛輔助系統 (ADAS)、汽車電力電子和下一代電池技術的快速發展推動,汽車領域預計將成為功率元件分析儀市場成長最快的領域。汽車製造商和零件供應商正擴大採用先進的功率裝置分析儀,以確保電動車動力動力傳動系統、充電系統、電池管理系統 (BMS)、逆變器、轉換器和馬達控制單元等關鍵功率半導體裝置的性能、效率和可靠性。現代電動和混合動力汽車高度依賴高效功率半導體裝置,例如 IGBT、MOSFET、碳化矽 (SiC) 和氮化鎵 (GaN),這些元件需要在動態運行條件下進行高精度測試和表徵。透過利用功率元件分析儀,汽車製造商可以評估關鍵的電氣參數,例如開關損耗、熱行為、功率效率、漏電流、電壓穩定性和波形性能,從而最佳化車輛能量管理和系統可靠性。快速充電基礎設施、高壓電池平台、再生煞車系統和自動駕駛技術的日益普及,進一步推動了汽車產業對先進測試和檢驗解決方案的需求。這些分析儀支援精確的即時測量、自動化測試工作流程、高速資料擷取和詳細的波形分析,幫助製造商縮短開發週期、提高安全標準並提升車輛整體性能。
“按地區分類,預計北美在預測期內將佔據第二大市場佔有率。”
預計在預測期內,北美將佔據功率裝置分析儀市場第二大佔有率,這主要得益於美國和加拿大半導體製造技術的顯著進步、電動汽車 (EV) 的發展、可再生能源的整合以及高性能工業電子產品的普及。該地區擁有完善的半導體公司、汽車原始設備製造商 (OEM)、實驗室和功率電子產品製造商生態系統,這些企業持續投資於先進的測試和測量技術,以提高裝置的性能、可靠性和能源效率。電動車、快速充電基礎設施、電池能源儲存系統和智慧功率轉換技術的日益普及,正顯著推動北美對高精度功率元件分析儀的需求。這些分析儀廣泛用於評估汽車動力傳動系統、工業馬達驅動器、可再生能源逆變器、航太系統和通訊基礎設施中使用的關鍵半導體裝置,例如 IGBT、MOSFET、SiC 和 GaN。政府支持國內半導體生產、清潔能源發展和工業現代化的各項舉措,也促進了該地區的市場成長。半導體製造領域的擴張計劃、電動車供應鏈的發展以及對可再生能源基礎設施項目的投資,都對先進的裝置表徵和功率分析解決方案產生了顯著的需求。此外,隨著降低功率損耗、提高開關效率和增強溫度控管的重要性日益凸顯,製造商正轉向採用配備自動化測試、人工智慧診斷和即時波形分析功能的先進分析儀平台。
Keysight Technologies(美國)、橫河電機株式會社(日本)、福祿克株式會社(美國)、日置電子株式會社(日本)和Chroma ATE Inc.(台灣)是功率元件分析儀市場的主要參與者。本研究對這些主要參與者進行了詳細的競爭分析,包括公司簡介、近期發展和關鍵市場策略。
調查範圍:
本報告按類型、電流、最終用途和地區對全球功率元件分析儀市場進行定義、描述和預測,並提供詳細的市場定性和定量分析。報告全面檢驗了關鍵的市場促進因素、限制因素、機會和挑戰,並涵蓋了市場的各個重要方面,包括競爭格局分析、市場動態、以以金額為準計價的市場規模估算以及功率元件分析儀市場的未來趨勢。
購買本報告的主要好處
- 本報告分析了影響功率元件分析儀市場成長的因素,包括主要促進因素(由於電動車 (EV) 的日益普及和電動車充電基礎設施的建設,對高精度功率測試和阻礙因素的需求不斷成長,對先進的 AC/DC功率檢驗的需求不斷成長;工業自動化和智慧製造的擴展需要對馬達、驅動器、轉換器和逆變器進行精確測試;以及太陽能、風能和能源儲存系統等可再生能源系統的部署不斷增加)、限制因素(能夠操作先進的多通道、先進的功率測量和波形分析系統的熟練專業人員短缺)、機會(全球半導體製造和電力電子測試應用的擴展,以及對智慧電網、高壓直流輸電基礎設施和全球電力公用事業現代化項目的投資不斷增加)和挑戰(由於技術的快速進步和持續的研發投資,產品生命週期縮短)。
- 市場趨勢:盈利市場的全面資訊-本報告分析了各個地區的功率元件分析儀市場。
- 市場多元化:全面介紹功率元件分析儀市場的新產品和服務、未開發的市場、近期趨勢和產品發布資訊。
- 競爭對手分析:Keysight Technologies(美國)、橫河電機株式會社(日本)、HIOKI EE CORPORATION(日本)、Fluke Corporation(美國)、Rohde & Schwarz(德國)、IWATSU ELECTRIC(日本)、Carlo Gavazzi(瑞士)、Vitrek(美國)、CIRCUTOR.(日本)、Carltrus)( Incorporated(德國)、Extech(美國)、DEWETRON GmbH(奧地利)、Magtrol(美國)、Dewesoft doo(斯洛維尼亞)、Janitza electronics GmbH(德國)、Arbiter Systems(美國)、Valhalla Scientific(美國)、TEKTRON. Inc.(台灣)、ADVANTEST CORPORATION(日本)、NATIONAL INSTRUMENTS CORP.(美國)艾諾儀器(中國)等是功率元件分析儀市場的主要參與者。
- 產品創新與發展:產品創新和技術進步在加速功率元件分析儀市場成長方面發揮著至關重要的作用,尤其是在對高效半導體測試和先進功率電子元件檢驗的需求不斷成長的推動下。製造商不斷推出採用高速採樣架構、自動化特性分析軟體、人工智慧診斷功能和即時波形視覺化的新一代分析儀,以提高測試精度和運作效率。碳化矽 (SiC) 和氮化鎵 (GaN) 等半導體技術的日益普及,進一步推動了能夠處理更高開關頻率、更高電壓和複雜熱性能分析的分析儀的發展。先進的功率元件分析儀擴大整合自動化測試序列、雲端分析平台、遠端監控功能和智慧數據處理工具,有助於縮短半導體開發週期並提高產品可靠性。這些解決方案廣泛應用於需要精確測量開關損耗、效率、漏電流、閘極電荷和熱穩定性的領域,包括電動車 (EV)、可再生能源系統、工業自動化、航太電子、通訊基礎設施和電池測試環境。此外,各公司正致力於開發緊湊、模組化且擴充性的分析儀平台,這些平台支援交流和直流測試環境,從而能夠無縫檢驗功率模組、逆變器、轉換器、充電系統和儲能設備。先進通訊協定、數位控制介面和自動化報告系統的整合,增強了與現代半導體實驗室和智慧製造環境的兼容性。此外,即時模擬、故障預測分析和高精度測量技術的創新,正在推動裝置最佳化、降低測試複雜性,並加速下一代電力電子系統的部署。
目錄
第1章:引言
第2章執行摘要
第3章重要考察
第4章 市場概覽
- 市場動態
- 促進因素
- 抑制因子
- 機會
- 任務
- 未滿足的需求和未開發的領域
- 相互關聯的市場與跨產業機遇
- 一級/二級/三級公司的策略性舉措
第5章 產業趨勢
- 波特五力分析
- 宏觀經濟展望
- 價值鏈分析
- 生態系分析
- 價格分析
- 貿易分析
- 2026-2027 年主要會議和活動
- 影響客戶業務的趨勢/顛覆性因素
- 投資和資金籌措場景
- 案例研究分析
- 美國關稅對2025年功率元件分析儀市場的影響
第6章:技術進步、人工智慧的影響、專利、創新與未來應用
- 主要技術
- 互補技術
- 技術/產品藍圖
- 專利分析
- 未來應用
- 人工智慧/生成式人工智慧對功率元件分析儀市場的影響
- 成功案例和實際應用
第7章:監理情勢與永續性舉措
- 當地法規和合規性
- 對永續性的承諾
- 監理政策對永續性舉措的影響
- 認證、標籤檢視、環境標準
第8章:顧客趨勢與購買行為
- 決策流程
- 採購過程中的關鍵相關人員及其評估標準
- 實施障礙和內部挑戰
- 來自不同最終用戶的未滿足需求
- 市場盈利
第9章:功率元件分析儀市場(按類型分類)
- 交流電和直流電
- AC
- DC
第10章:功率元件分析儀市場(按電流)
- 1000A 或更小
- 1000A 或以上
第11章:功率元件分析儀市場(依最終用途分類)
- 車
- 能源與電力電子
- 電訊
- 家用電器
- 醫療保健
- 其他
第12章 功率元件分析儀市場(依地區分類)
- 北美洲
- 美國
- 加拿大
- 墨西哥
- 歐洲
- 德國
- 英國
- 義大利
- 法國
- 西班牙
- 俄羅斯
- 其他
- 亞太地區
- 中國
- 印度
- 日本
- 韓國
- 澳洲
- 其他
- 中東和非洲
- GCC
- 南非
- 其他
- 南美洲
- 巴西
- 阿根廷
- 智利
- 其他
第13章 競爭格局
- 概述
- 2021-2026年主要參與企業的競爭策略/優勢
- 2025年市佔率分析
- 2021-2025年收入分析
- 產品對比
- 企業估值矩陣:主要公司,2025 年
- 公司估值矩陣:新創企業/中小企業,2025 年
- 企業估值和財務指標
- 競爭格局
第14章:公司簡介
- 主要參與企業
- KEYSIGHT TECHNOLOGIES
- YOKOGAWA ELECTRIC CORPORATION
- FLUKE CORPORATION
- HIOKI EE CORPORATION
- CHROMA ATE INC.
- DELTA ELECTRONICS, INC.
- ADVANTEST CORPORATION
- CARLO GAVAZZI
- TEXAS INSTRUMENTS INCORPORATED
- ROHDE & SCHWARZ
- IWATSU ELECTRIC CO., LTD.
- VITREK CORPORATION
- PCE INSTRUMENTS
- DEWETRON GMBH
- JANITZA ELECTRONICS GMBH
- 其他公司
- CIRCUTOR.COM
- EXTECH
- MAGTROL
- DEWESOFT DOO
- ARBITER SYSTEMS
- VALHALLA SCIENTIFIC
- TEKTRONIX, INC.
- B&K PRECISION CORPORATION
- NATIONAL INSTRUMENTS CORP.
- AINUO INSTRUMENT CO., LTD.
第15章:調查方法
第16章附錄
The power device analyzer market is estimated to grow from USD 0.60 billion in 2026 to USD 0.78 billion by 2031, at a CAGR of 5.2% during the forecast period. The rapid expansion of electric vehicles (EVs), renewable energy systems, semiconductor manufacturing, and advanced industrial electronics is significantly increasing the demand for high-precision power device analyzers across global markets.
| Scope of the Report | |
|---|---|
| Years Considered for the Study | 2022-2031 |
| Base Year | 2025 |
| Forecast Period | 2026-2031 |
| Units Considered | USD Billion |
| Segments | By Type, by Current, by End User |
| Regions covered | North America, Asia Pacific, Europe, the Middle East & Africa, South America |
As modern power electronic systems become more complex and operate at higher voltages, frequencies, and switching speeds, manufacturers require advanced testing solutions capable of delivering accurate device characterization, efficiency validation, and reliability assessment under real-world operating conditions. Power device analyzers are increasingly being deployed across semiconductor fabrication facilities, automotive electronics laboratories, battery testing environments, industrial automation systems, telecommunications infrastructure, and research institutions for detailed analysis of power semiconductor components such as IGBTs, MOSFETs, SiC, and GaN devices. These applications require precise evaluation of switching losses, thermal behavior, leakage current, capacitance, gate charge, and power conversion efficiency to ensure optimal device performance and long-term operational stability.
The growing adoption of next-generation technologies, including wide bandgap semiconductors, fast EV charging systems, high-efficiency motor drives, renewable energy inverters, and smart power management systems, is accelerating the need for advanced analyzer platforms integrated with automated testing, high-speed waveform capture, AI-assisted diagnostics, and real-time analytical software. Manufacturers are increasingly focusing on improving power density, reducing energy losses, and enhancing thermal management, which further strengthens the role of sophisticated power device analysis solutions in product development and quality assurance processes. Additionally, increasing investments in data centers, aerospace electronics, 5G infrastructure, and medical power systems are driving demand for highly reliable and energy-efficient semiconductor devices, creating substantial opportunities for the power device analyzer market. Continuous technological advancements in semiconductor design, coupled with rising emphasis on electrification, energy efficiency, and system reliability, are expected to support sustained market growth during the forecast period.
"By type, the both AC & DC segment is expected to be the largest segment in the power device analyzer market during the forecast period."
The both AC and DC segment is expected to account for the largest share of the power device analyzer market during the forecast period, primarily driven by the growing demand for versatile testing solutions across modern power electronics applications. Industries such as electric vehicles (EVs), renewable energy, industrial automation, telecommunications, aerospace, and consumer electronics increasingly require analyzers capable of evaluating both alternating current (AC) and direct current (DC) power devices within a single integrated platform. Power device analyzers supporting both AC and DC measurements provide enhanced flexibility for testing a wide range of semiconductor components, inverters, converters, motor drives, battery systems, and charging infrastructure. These systems enable accurate analysis of critical parameters, including switching efficiency, harmonic distortion, power loss, leakage current, voltage stability, thermal performance, and waveform characteristics, under varying operating conditions. Their ability to support multi-domain testing significantly reduces testing complexity, equipment costs, and operational downtime for manufacturers and research facilities. The increasing adoption of hybrid power architectures, bi-directional charging systems, renewable energy integration, and advanced energy storage technologies is further accelerating the demand for analyzers capable of handling both AC and DC environments. In electric vehicle and battery manufacturing applications, these analyzers are extensively used for inverter validation, battery efficiency testing, onboard charger analysis, and power module characterization. Similarly, renewable energy systems such as solar inverters and energy storage platforms require combined AC/DC analysis to ensure efficient power conversion and grid compatibility.
"By end user, the automotive segment is projected to register the fastest growth in the power device analyzer market during the forecast period."
The automotive segment is expected to witness the fastest growth in the power device analyzer market during the forecast period, driven by the rapid expansion of electric vehicles (EVs), advanced driver-assistance systems (ADAS), onboard power electronics, and next-generation battery technologies. Automotive manufacturers and component suppliers are increasingly adopting advanced power device analyzers to ensure the performance, efficiency, and reliability of critical power semiconductor components used in EV powertrains, charging systems, battery management systems (BMS), inverters, converters, and motor control units. Modern electric and hybrid vehicles rely heavily on high-efficiency power semiconductor devices such as IGBTs, MOSFETs, silicon carbide (SiC), and gallium nitride (GaN) components, which require highly accurate testing and characterization under dynamic operating conditions. Power device analyzers enable automotive manufacturers to evaluate key electrical parameters, including switching losses, thermal behavior, power efficiency, leakage current, voltage stability, and waveform performance, to optimize vehicle energy management and system reliability. The growing deployment of fast-charging infrastructure, high-voltage battery platforms, regenerative braking systems, and autonomous driving technologies is further increasing the demand for sophisticated testing and validation solutions in the automotive sector. These analyzers support precise real-time measurements, automated testing workflows, high-speed data acquisition, and detailed waveform analysis, helping manufacturers reduce development time, improve safety standards, and enhance overall vehicle performance.
"By region, North America is estimated to account for the second-largest market share during the forecast period."
North America is expected to account for the second-largest share of the power device analyzer market during the forecast period, driven by strong advancements in semiconductor manufacturing, electric vehicle (EV) development, renewable energy integration, and high-performance industrial electronics across the US and Canada. The region has a well-established ecosystem of semiconductor companies, automotive OEMs, research laboratories, and power electronics manufacturers that continuously invest in advanced testing and measurement technologies to improve device performance, reliability, and energy efficiency. The increasing adoption of electric vehicles, fast-charging infrastructure, battery energy storage systems, and smart power conversion technologies is significantly accelerating the demand for high-precision power device analyzers in North America. These analyzers are extensively used for evaluating critical semiconductor devices such as IGBTs, MOSFETs, SiC, and GaN components used in automotive powertrains, industrial motor drives, renewable energy inverters, aerospace systems, and telecommunications infrastructure. Government initiatives supporting domestic semiconductor production, clean energy development, and industrial modernization are further contributing to market growth in the region. Investments under semiconductor manufacturing expansion programs, EV supply chain development, and renewable energy infrastructure projects are creating substantial demand for advanced device characterization and power analysis solutions. In addition, the growing focus on reducing power losses, improving switching efficiency, and enhancing thermal management is encouraging manufacturers to adopt sophisticated analyzer platforms with automated testing, AI-assisted diagnostics, and real-time waveform analysis capabilities.
In-depth interviews have been conducted with key industry participants, subject-matter experts, C-level executives of leading market players, and industry consultants, among others, to obtain and verify critical qualitative and quantitative information and to assess future market prospects. The distribution of primary interviews is as follows:
By Company Type: Tier 1 - 45%, Tier 2 - 30%, and Tier 3 - 25%
By Designation: C-level Executives - 35%, Directors - 25%, and Others - 40%
By Region: Asia Pacific - 60%, Europe - 15%, North America - 10%, Middle East & Africa - 10%, and South America - 5%
Notes: The tiers of the companies are defined based on their total revenues as of 2025. Tier 1: > USD 1 billion, Tier 2: USD 500 million to USD 1 billion, and Tier 3: < USD 500 million.
Other designations include sales managers, engineers, and regional managers.
Keysight Technologies (US), Yokogawa Electric Corporation (Japan), Fluke Corporation (US), Hioki E.E. Corporation (Japan), and Chroma ATE Inc. (Taiwan) are some of the major players in the power device analyzer market. The study includes an in-depth competitive analysis of these key players, including their company profiles, recent developments, and key market strategies.
Research Coverage:
The report defines, describes, and forecasts the global power device analyzer market by type, current, end use, and region. It also offers a detailed qualitative and quantitative analysis of the market. The report comprehensively reviews the major market drivers, restraints, opportunities, and challenges. It also covers various important aspects of the market. These include an analysis of the competitive landscape, market dynamics, market estimates in terms of value, and future trends in the power device analyzer market.
Key Benefits of Buying the Report
- It provides an analysis of key drivers (Rising adoption of electric vehicles and EV charging infrastructure requiring high-precision power testing and validation, Expansion of industrial automation and smart manufacturing requiring accurate testing of motors, drives, converters, and inverters, Increasing deployment of renewable energy systems such as solar PV, wind power, and energy storage systems driving demand for advanced AC/DC power analyzers), restraints (High equipment cost associated with advanced multi-channel, Shortage of skilled professionals capable of handling advanced power measurement and waveform analysis systems), opportunities (Expansion of semiconductor manufacturing and power electronics testing applications worldwide, Growing investments in smart grids, HVDC infrastructure, and utility modernization projects globally), challenges (Rapid technological advancements leading to shorter product life cycles and continuous R&D investments) influencing the growth of the power device analyzer market.
- Market Development: Comprehensive information about lucrative markets - the report analyses the power device analyzer market across varied regions.
- Market Diversification: Exhaustive information about new products and services, untapped geographies, recent developments, and product launches in the power device analyzer market
- Competitive Assessment: In-depth assessment of market shares, growth strategies, and service offerings of leading players like Keysight Technologies (US), Yokogawa Electric Corporation (Japan), HIOKI E.E. CORPORATION (Japan), Fluke Corporation (US), Rohde & Schwarz (Germany), IWATSU ELECTRIC CO., LTD. (Japan), Carlo Gavazzi (Switzerland), Vitrek (US), CIRCUTOR.COM (Spain), Texas Instruments Incorporated (US), PCE Instruments Incorporated (Germany), Extech (US), DEWETRON GmbH (Austria), Magtrol (US), Dewesoft d.o.o. (Slovenia), Janitza electronics GmbH (Germany), Arbiter Systems (US), Valhalla Scientific (US), TEKTRONIX, INC. (US), Chroma ATE Inc. (Taiwan), B&k Precision Corporation (US), Delta Electronics, Inc. (Taiwan), ADVANTEST CORPORATION (Japan), NATIONAL INSTRUMENTS CORP. (US), Ainuo Instrument Co., Ltd. (China) among others, in the power device analyzer market
- Product Innovation/Development: Product innovation and technological advancement are playing a major role in accelerating the growth of the power device analyzer market, particularly with the increasing demand for high-efficiency semiconductor testing and advanced power electronics validation. Manufacturers are continuously introducing next-generation analyzers equipped with high-speed sampling architectures, automated characterization software, AI-assisted diagnostics, and real-time waveform visualization capabilities to improve testing precision and operational efficiency. The growing adoption of silicon carbide (SiC) and gallium nitride (GaN) semiconductor technologies is further driving the development of analyzers capable of handling higher switching frequencies, elevated voltages, and complex thermal performance analysis. Advanced power device analyzers are increasingly integrating automated test sequences, cloud-enabled analytical platforms, remote monitoring capabilities, and intelligent data processing tools to support faster semiconductor development cycles and improved product reliability. These solutions are finding widespread applications across electric vehicles (EVs), renewable energy systems, industrial automation, aerospace electronics, telecommunications infrastructure, and battery testing environments, where accurate measurement of switching losses, efficiency, leakage current, gate charge, and thermal stability is critical. In addition, companies are focusing on compact, modular, and scalable analyzer platforms that support both AC and DC testing environments, enabling seamless validation of power modules, inverters, converters, charging systems, and energy storage devices. The integration of advanced communication protocols, digital control interfaces, and automated reporting systems is enhancing compatibility with modern semiconductor laboratories and smart manufacturing environments. Furthermore, innovations in real-time simulation, predictive failure analysis, and high-precision measurement technologies are improving device optimization, reducing testing complexity, and enabling faster deployment of next-generation power electronic systems.
TABLE OF CONTENTS
1 INTRODUCTION
- 1.1 STUDY OBJECTIVES
- 1.2 MARKET DEFINITION
- 1.3 STUDY SCOPE
- 1.3.1 MARKETS COVERED AND REGIONAL SCOPE
- 1.3.2 INCLUSIONS AND EXCLUSIONS
- 1.3.3 YEARS CONSIDERED
- 1.4 CURRENCY CONSIDERED
- 1.5 UNIT CONSIDERED
- 1.6 LIMITATIONS
- 1.7 STAKEHOLDERS
- 1.8 SUMMARY OF CHANGES
2 EXECUTIVE SUMMARY
- 2.1 MARKET HIGHLIGHTS AND KEY INSIGHTS
- 2.2 KEY MARKET PARTICIPANTS: MAPPING OF STRATEGIC DEVELOPMENTS
- 2.3 DISRUPTIVE TRENDS IN POWER DEVICE ANALYZER MARKET
- 2.4 HIGH-GROWTH SEGMENTS
- 2.5 REGIONAL SNAPSHOT: MARKET SIZE, GROWTH RATE, AND FORECAST
3 PREMIUM INSIGHTS
- 3.1 ATTRACTIVE OPPORTUNITIES FOR PLAYERS IN POWER DEVICE ANALYZER MARKET
- 3.2 POWER DEVICE ANALYZER MARKET, BY TYPE AND REGION
- 3.3 POWER DEVICE ANALYZER MARKET, BY TYPE
- 3.4 POWER DEVICE ANALYZER MARKET, BY CURRENT
- 3.5 POWER DEVICE ANALYZER MARKET, BY END USE
- 3.6 POWER DEVICE ANALYZER MARKET, BY COUNTRY
4 MARKET OVERVIEW
- 4.1 INTRODUCTION
- 4.2 MARKET DYNAMICS
- 4.2.1 DRIVERS
- 4.2.1.1 Rising adoption of EVs and EV charging infrastructure
- 4.2.1.2 Expansion of industrial automation and smart manufacturing
- 4.2.1.3 Increasing deployment of renewable energy systems
- 4.2.2 RESTRAINTS
- 4.2.2.1 High equipment cost of advanced multi-channel and high-frequency power analyzers
- 4.2.2.2 Shortage of skilled professionals to handle advanced power measurement and waveform analysis systems
- 4.2.3 OPPORTUNITIES
- 4.2.3.1 Expansion of semiconductor manufacturing and power electronics testing applications
- 4.2.3.2 Growing investments in smart grids, HVDC infrastructure, and utility modernization projects
- 4.2.4 CHALLENGES
- 4.2.4.1 Rapid technological advancements, shorter product life cycles, and continuous R&D investments
- 4.2.1 DRIVERS
- 4.3 UNMET NEEDS AND WHITE SPACES
- 4.3.1 UNMET NEEDS IN POWER DEVICE ANALYZER MARKET
- 4.3.2 WHITE SPACE OPPORTUNITIES
- 4.4 INTERCONNECTED MARKETS AND CROSS-SECTOR OPPORTUNITIES
- 4.4.1 INTERCONNECTED MARKETS
- 4.4.2 CROSS-SECTOR OPPORTUNITIES
- 4.5 STRATEGIC MOVES BY TIER-1/2/3 PLAYERS
- 4.5.1 KEY MOVES AND STRATEGIC FOCUS
5 INDUSTRY TRENDS
- 5.1 PORTER'S FIVE FORCES ANALYSIS
- 5.1.1 THREAT OF NEW ENTRANTS
- 5.1.2 THREAT OF SUBSTITUTES
- 5.1.3 BARGAINING POWER OF SUPPLIERS
- 5.1.4 BARGAINING POWER OF BUYERS
- 5.1.5 INTENSITY OF COMPETITIVE RIVALRY
- 5.2 MACROECONOMIC OUTLOOK
- 5.2.1 INTRODUCTION
- 5.2.2 GDP TRENDS AND FORECAST
- 5.2.3 TRENDS IN GLOBAL AUTOMOTIVE
- 5.2.4 TRENDS IN GLOBAL TELECOMMUNICATION SECTOR
- 5.3 VALUE CHAIN ANALYSIS
- 5.4 ECOSYSTEM ANALYSIS
- 5.5 PRICING ANALYSIS
- 5.5.1 AVERAGE SELLING PRICE TREND OF POWER DEVICE ANALYZER SYSTEMS OFFERED BY KEY PLAYERS, BY TYPE, 2022-2025
- 5.5.2 AVERAGE SELLING PRICE TREND OF POWER DEVICE ANALYZER SYSTEMS, BY REGION, 2022-2025
- 5.6 TRADE ANALYSIS
- 5.6.1 IMPORT SCENARIO (HS CODE 903082)
- 5.6.2 EXPORT SCENARIO (HS CODE 903082)
- 5.7 KEY CONFERENCES AND EVENTS, 2026-2027
- 5.8 TRENDS/DISRUPTIONS IMPACTING CUSTOMER BUSINESS
- 5.9 INVESTMENT AND FUNDING SCENARIO
- 5.10 CASE STUDY ANALYSIS
- 5.10.1 HIGH-FREQUENCY SIC/GAN POWER DEVICE VALIDATION FOR LEADING EV MANUFACTURER
- 5.10.2 HIGH-FREQUENCY POWER VALIDATION AND THERMAL OPTIMIZATION IN HYPERSCALE DATA CENTER
- 5.10.3 INDUSTRIAL POWER DEVICE VALIDATION AND PREDICTIVE MAINTENANCE IN LARGE MANUFACTURING PLANT
- 5.11 IMPACT OF 2025 US TARIFF - POWER DEVICE ANALYZER MARKET
- 5.11.1 INTRODUCTION
- 5.11.2 KEY TARIFF RATES
- 5.11.3 PRICE IMPACT ANALYSIS
- 5.11.4 IMPACT ON COUNTRIES/REGIONS
- 5.11.4.1 US
- 5.11.4.2 Europe
- 5.11.4.3 Asia Pacific
- 5.11.5 IMPACT ON END-USE INDUSTRIES
6 TECHNOLOGICAL ADVANCEMENTS, AI-DRIVEN IMPACT, PATENTS, INNOVATIONS, AND FUTURE APPLICATIONS
- 6.1 KEY TECHNOLOGIES
- 6.1.1 WIDE BANDGAP SEMICONDUCTOR TESTING
- 6.1.2 HIGH-SPEED DIGITAL SIGNAL PROCESSING
- 6.2 COMPLEMENTARY TECHNOLOGIES
- 6.2.1 ADVANCED CURRENT SENSORS & PROBES
- 6.3 TECHNOLOGY/PRODUCT ROADMAP
- 6.3.1 SHORT-TERM (2025-2027) | FOUNDATION & EARLY COMMERCIALIZATION
- 6.3.2 MID-TERM (2027-2030) | EXPANSION & STANDARDIZATION
- 6.3.3 LONG-TERM (2030+) | MASS COMMERCIALIZATION & DISRUPTION
- 6.4 PATENT ANALYSIS
- 6.5 FUTURE APPLICATIONS
- 6.6 IMPACT OF AI/GEN AI ON POWER DEVICE ANALYZER MARKET
- 6.6.1 TOP USE CASES AND MARKET POTENTIAL
- 6.6.2 BEST PRACTICES FOLLOWED BY OEMS IN POWER DEVICE ANALYZER MARKET
- 6.6.3 CASE STUDIES RELATED TO AI/GEN AI IMPLEMENTATION IN POWER DEVICE ANALYZER MARKET
- 6.6.4 INTERCONNECTED ECOSYSTEM AND IMPACT ON MARKET PLAYERS
- 6.6.5 CLIENTS' READINESS TO ADOPT AI/GEN AI-INTEGRATED POWER DEVICE ANALYZERS
- 6.7 SUCCESS STORIES AND REAL-WORLD APPLICATIONS
- 6.7.1 KEYSIGHT TECHNOLOGIES: HIGH-VOLUME WIDE-BANDGAP DEVICE CHARACTERIZATION WITH AI-DRIVEN PREDICTIVE ANALYTICS
- 6.7.2 YOKOGAWA ELECTRIC: INDUSTRIAL POWER ELECTRONICS VALIDATION AND AUTONOMOUS TEST OPTIMIZATION
- 6.7.3 ROHDE & SCHWARZ: COMMERCIAL HIGH-POWER SYSTEM TESTING WITH AI-ENHANCED COMPLIANCE
7 REGULATORY LANDSCAPE AND SUSTAINABILITY INITIATIVES
- 7.1 REGIONAL REGULATIONS AND COMPLIANCE
- 7.1.1 REGULATORY BODIES, GOVERNMENT AGENCIES, AND OTHER ORGANIZATIONS
- 7.1.2 INDUSTRY STANDARDS
- 7.2 SUSTAINABILITY INITIATIVES
- 7.2.1 CARBON IMPACT AND ECO-APPLICATIONS OF POWER DEVICE ANALYZERS
- 7.3 IMPACT OF REGULATORY POLICIES ON SUSTAINABILITY INITIATIVES
- 7.4 CERTIFICATIONS, LABELING, ECO-STANDARDS
8 CUSTOMER LANDSCAPE AND BUYER BEHAVIOR
- 8.1 DECISION-MAKING PROCESS
- 8.2 KEY STAKEHOLDERS INVOLVED IN BUYING PROCESS AND THEIR EVALUATION CRITERIA
- 8.2.1 KEY STAKEHOLDERS IN BUYING PROCESS
- 8.2.2 BUYING CRITERIA
- 8.3 ADOPTION BARRIERS AND INTERNAL CHALLENGES
- 8.4 UNMET NEEDS FROM VARIOUS END USERS
- 8.5 MARKET PROFITABILITY
- 8.5.1 REVENUE POTENTIAL
- 8.5.2 COST DYNAMICS
- 8.5.3 MARGIN OPPORTUNITIES BY END USE
9 POWER DEVICE ANALYZER MARKET, BY TYPE
- 9.1 INTRODUCTION
- 9.2 BOTH AC & DC
- 9.2.1 RISING DEPLOYMENT OF EV POWERTRAINS, ENERGY STORAGE SYSTEMS, AND RENEWABLE ENERGY INVERTERS TO ACCELERATE SEGMENT DEMAND
- 9.3 AC
- 9.3.1 EXPANDING INDUSTRIAL AUTOMATION AND RENEWABLE ENERGY INFRASTRUCTURE TO DRIVE SEGMENT GROWTH
- 9.4 DC
- 9.4.1 INCREASING DEPLOYMENT OF BATTERY ENERGY STORAGE SYSTEMS AND DC POWER ARCHITECTURES TO BOOST SEGMENT DEMAND
10 POWER DEVICE ANALYZER MARKET, BY CURRENT
- 10.1 INTRODUCTION
- 10.2 BELOW 1000 A
- 10.2.1 INCREASING ADOPTION OF COMPACT POWER ELECTRONICS AND ELECTRIC VEHICLE SYSTEMS TO BOOST SEGMENT GROWTH
- 10.3 ABOVE 1000 A
- 10.3.1 INCREASING DEPLOYMENT OF HIGH-POWER ELECTRIFICATION SYSTEMS AND GRID-SCALE ENERGY INFRASTRUCTURE TO DRIVE SEGMENT GROWTH
11 POWER DEVICE ANALYZER MARKET, BY END USE
- 11.1 INTRODUCTION
- 11.2 AUTOMOTIVE
- 11.2.1 INCREASING VEHICLE ELECTRIFICATION, FAST-CHARGING INFRASTRUCTURE, AND ADVANCED POWERTRAIN SYSTEMS TO BOOST SEGMENT GROWTH
- 11.3 ENERGY & POWER ELECTRONICS
- 11.3.1 INCREASING DEPLOYMENT OF HIGH-EFFICIENCY POWER CONVERSION SYSTEMS AND RENEWABLE ENERGY INFRASTRUCTURE TO ACCELERATE SEGMENT GROWTH
- 11.4 TELECOMMUNICATION
- 11.4.1 EXPANSION OF 5G INFRASTRUCTURE, DATA TRANSMISSION NETWORKS, AND HIGH-EFFICIENCY POWER SYSTEMS TO ACCELERATE SEGMENT GROWTH
- 11.5 CONSUMER ELECTRONICS & APPLIANCES
- 11.5.1 DEMAND FOR ENERGY-EFFICIENT ELECTRONIC DEVICES AND ADVANCED POWER MANAGEMENT SYSTEMS TO ACCELERATE SEGMENT GROWTH
- 11.6 MEDICAL
- 11.6.1 DEPLOYMENT OF ADVANCED MEDICAL ELECTRONICS AND REQUIREMENT FOR HIGHLY RELIABLE POWER SYSTEMS TO ACCELERATE SEGMENT GROWTH
- 11.7 OTHERS
12 POWER DEVICE ANALYZER MARKET, BY REGION
- 12.1 INTRODUCTION
- 12.2 NORTH AMERICA
- 12.2.1 US
- 12.2.1.1 Rapid expansion of semiconductor fabrication, electric vehicle ecosystems, and advanced power electronics to drive market
- 12.2.2 CANADA
- 12.2.2.1 Growing investments in clean energy, battery manufacturing, and semiconductor research to accelerate market growth
- 12.2.3 MEXICO
- 12.2.3.1 Expanding automotive electrification, electronics manufacturing, and industrial modernization to fuel market
- 12.2.1 US
- 12.3 EUROPE
- 12.3.1 GERMANY
- 12.3.1.1 Advanced power testing solutions across renewable and battery storage projects to accelerate market growth
- 12.3.2 UK
- 12.3.2.1 SiC/GaN characterization programs with semiconductor innovation fund partnerships to drive market
- 12.3.3 ITALY
- 12.3.3.1 Growing investments in renewable energy, industrial automation, electric mobility, and advanced power electronics to drive market
- 12.3.4 FRANCE
- 12.3.4.1 Increasing focus on renewable energy expansion, electric mobility, and aerospace electronics to drive market
- 12.3.5 SPAIN
- 12.3.5.1 Accelerating investments in electric mobility, renewable energy infrastructure, and advanced power electronics to drive market
- 12.3.6 RUSSIA
- 12.3.6.1 Rising focus on domestic semiconductor manufacturing, power electronics development, and renewable energy projects to drive market
- 12.3.7 REST OF EUROPE
- 12.3.1 GERMANY
- 12.4 ASIA PACIFIC
- 12.4.1 CHINA
- 12.4.1.1 Rapid expansion of semiconductor manufacturing and electric vehicle ecosystem to accelerate market growth
- 12.4.2 INDIA
- 12.4.2.1 Expanding semiconductor manufacturing, electric vehicle adoption, and electronics production to accelerate market growth
- 12.4.3 JAPAN
- 12.4.3.1 Strong leadership in power semiconductor innovation and electric vehicle technologies to drive market
- 12.4.4 SOUTH KOREA
- 12.4.4.1 Expanding semiconductor manufacturing, electric vehicle production, and advanced power electronics development to drive market
- 12.4.5 AUSTRALIA
- 12.4.5.1 Growing investments in renewable energy, battery storage projects, and electric vehicle infrastructure to drive market
- 12.4.6 REST OF ASIA PACIFIC
- 12.4.1 CHINA
- 12.5 MIDDLE EAST & AFRICA
- 12.5.1 GCC
- 12.5.1.1 Saudi Arabia
- 12.5.1.1.1 Procurement of high-precision power device analyzers for renewable projects to drive market
- 12.5.1.2 UAE
- 12.5.1.2.1 Fast-track deployment of precision AC/DC analyzers for renewable projects to drive market
- 12.5.1.3 Rest of GCC
- 12.5.1.1 Saudi Arabia
- 12.5.2 SOUTH AFRICA
- 12.5.2.1 Procurement of high-precision power device analyzers for REIPPPP projects to drive market
- 12.5.3 REST OF MIDDLE EAST & AFRICA
- 12.5.1 GCC
- 12.6 SOUTH AMERICA
- 12.6.1 BRAZIL
- 12.6.1.1 Expanding renewable energy capacity, industrial automation, and electric vehicle investments to accelerate market growth
- 12.6.2 ARGENTINA
- 12.6.2.1 Expanding renewable energy projects, lithium industry investments, and industrial electrification to drive market
- 12.6.3 CHILE
- 12.6.3.1 Expanding energy storage investments and mining electrification to accelerate market growth
- 12.6.4 REST OF SOUTH AMERICA
- 12.6.1 BRAZIL
13 COMPETITIVE LANDSCAPE
- 13.1 OVERVIEW
- 13.2 KEY PLAYER COMPETITIVE STRATEGIES/RIGHT TO WIN, 2021-2026
- 13.3 MARKET SHARE ANALYSIS, 2025
- 13.4 REVENUE ANALYSIS, 2021-2025
- 13.5 PRODUCT COMPARISON
- 13.6 COMPANY EVALUATION MATRIX: KEY PLAYERS, 2025
- 13.6.1 STARS
- 13.6.2 EMERGING LEADERS
- 13.6.3 PERVASIVE PLAYERS
- 13.6.4 PARTICIPANTS
- 13.6.5 COMPANY FOOTPRINT: KEY PLAYERS, 2025
- 13.6.5.1 Company footprint
- 13.6.5.2 Region footprint
- 13.6.5.3 Type footprint
- 13.6.5.4 Current footprint
- 13.6.5.5 End use footprint
- 13.7 COMPANY EVALUATION MATRIX: STARTUPS/SMES, 2025
- 13.7.1 PROGRESSIVE COMPANIES
- 13.7.2 RESPONSIVE COMPANIES
- 13.7.3 DYNAMIC COMPANIES
- 13.7.4 STARTING BLOCKS
- 13.7.5 COMPETITIVE BENCHMARKING: STARTUPS/SMES, 2025
- 13.7.5.1 Detailed list of key startups/SMEs
- 13.7.5.2 Competitive benchmarking of key startups/SMEs
- 13.8 COMPANY VALUATION AND FINANCIAL METRICS
- 13.9 COMPETITIVE SCENARIO
- 13.9.1 PRODUCT LAUNCHES
- 13.9.2 DEALS
- 13.9.3 EXPANSIONS
14 COMPANY PROFILES
- 14.1 KEY PLAYERS
- 14.1.1 KEYSIGHT TECHNOLOGIES
- 14.1.1.1 Business overview
- 14.1.1.2 Products/Solutions/Services offered
- 14.1.1.3 Recent developments
- 14.1.1.3.1 Product launches
- 14.1.1.3.2 Deals
- 14.1.1.4 MnM view
- 14.1.1.4.1 Key strengths
- 14.1.1.4.2 Strategic choices
- 14.1.1.4.3 Weaknesses/Competitive threats
- 14.1.2 YOKOGAWA ELECTRIC CORPORATION
- 14.1.2.1 Business overview
- 14.1.2.2 Products/Solutions/Services offered
- 14.1.2.3 Recent developments
- 14.1.2.3.1 Product launches
- 14.1.2.4 MnM view
- 14.1.2.4.1 Key strengths
- 14.1.2.4.2 Strategic choices
- 14.1.2.4.3 Weaknesses/Competitive threats
- 14.1.3 FLUKE CORPORATION
- 14.1.3.1 Business overview
- 14.1.3.2 Products/Solutions/Services offered
- 14.1.3.3 Recent developments
- 14.1.3.3.1 Deals
- 14.1.3.4 MnM view
- 14.1.3.4.1 Key strengths
- 14.1.3.4.2 Strategic choices
- 14.1.3.4.3 Weaknesses/Competitive threats
- 14.1.4 HIOKI E.E. CORPORATION
- 14.1.4.1 Business overview
- 14.1.4.2 Products/Solutions/Services offered
- 14.1.4.3 Recent developments
- 14.1.4.3.1 Product launches
- 14.1.4.4 MnM view
- 14.1.4.4.1 Key strengths
- 14.1.4.4.2 Strategic choices
- 14.1.4.4.3 Weaknesses/Competitive threats
- 14.1.5 CHROMA ATE INC.
- 14.1.5.1 Business overview
- 14.1.5.2 Products/Solutions/Services offered
- 14.1.5.3 MnM view
- 14.1.5.3.1 Key strengths
- 14.1.5.3.2 Strategic choices
- 14.1.5.3.3 Weaknesses/Competitive threats
- 14.1.6 DELTA ELECTRONICS, INC.
- 14.1.6.1 Business overview
- 14.1.6.2 Products/Solutions/Services offered
- 14.1.6.3 Recent developments
- 14.1.6.3.1 Product launches
- 14.1.6.3.2 Deals
- 14.1.7 ADVANTEST CORPORATION
- 14.1.7.1 Business overview
- 14.1.7.2 Products/Solutions/Services offered
- 14.1.7.3 Recent developments
- 14.1.7.3.1 Deals
- 14.1.7.3.2 Expansions
- 14.1.8 CARLO GAVAZZI
- 14.1.8.1 Business overview
- 14.1.8.2 Products/Solutions/Services offered
- 14.1.8.3 Recent developments
- 14.1.8.3.1 Product launches
- 14.1.9 TEXAS INSTRUMENTS INCORPORATED
- 14.1.9.1 Business overview
- 14.1.9.2 Products/Solutions/Services offered
- 14.1.10 ROHDE & SCHWARZ
- 14.1.10.1 Business overview
- 14.1.10.2 Products/Solutions/Services offered
- 14.1.10.3 Recent developments
- 14.1.10.3.1 Product launches
- 14.1.10.3.2 Deals
- 14.1.11 IWATSU ELECTRIC CO., LTD.
- 14.1.11.1 Business overview
- 14.1.11.2 Products/Solutions/Services offered
- 14.1.12 VITREK CORPORATION
- 14.1.12.1 Business overview
- 14.1.12.2 Products/Solutions/Services offered
- 14.1.13 PCE INSTRUMENTS
- 14.1.13.1 Business overview
- 14.1.13.2 Products/Solutions/Services offered
- 14.1.14 DEWETRON GMBH
- 14.1.14.1 Business overview
- 14.1.14.2 Products/Solutions/Services offered
- 14.1.14.3 Recent developments
- 14.1.14.3.1 Product launches
- 14.1.14.3.2 Deals
- 14.1.14.3.3 Expansions
- 14.1.15 JANITZA ELECTRONICS GMBH
- 14.1.15.1 Business overview
- 14.1.15.2 Products/Solutions/Services offered
- 14.1.1 KEYSIGHT TECHNOLOGIES
- 14.2 OTHER PLAYERS
- 14.2.1 CIRCUTOR.COM
- 14.2.2 EXTECH
- 14.2.3 MAGTROL
- 14.2.4 DEWESOFT D.O.O.
- 14.2.5 ARBITER SYSTEMS
- 14.2.6 VALHALLA SCIENTIFIC
- 14.2.7 TEKTRONIX, INC.
- 14.2.8 B&K PRECISION CORPORATION
- 14.2.9 NATIONAL INSTRUMENTS CORP.
- 14.2.10 AINUO INSTRUMENT CO., LTD.
15 RESEARCH METHODOLOGY
- 15.1 RESEARCH DATA
- 15.2 SECONDARY AND PRIMARY RESEARCH
- 15.2.1 SECONDARY DATA
- 15.2.1.1 List of key secondary sources
- 15.2.1.2 Key data from secondary sources
- 15.2.2 PRIMARY DATA
- 15.2.2.1 List of primary interview participants
- 15.2.2.2 Key industry insights
- 15.2.2.3 Breakdown of primaries
- 15.2.2.4 Key data from primary sources
- 15.2.1 SECONDARY DATA
- 15.3 MARKET SIZE ESTIMATION
- 15.3.1 BOTTOM-UP APPROACH
- 15.3.2 TOP-DOWN APPROACH
- 15.4 MARKET FORECAST APPROACH
- 15.4.1 DEMAND-SIDE
- 15.4.1.1 Demand-side assumptions
- 15.4.1.2 Demand-side calculations
- 15.4.2 SUPPLY-SIDE
- 15.4.2.1 Supply-side assumptions
- 15.4.2.2 Supply-side calculations
- 15.4.1 DEMAND-SIDE
- 15.5 FORECAST
- 15.6 DATA TRIANGULATION
- 15.7 RESEARCH LIMITATIONS
- 15.8 RISK ANALYSIS
16 APPENDIX
- 16.1 DISCUSSION GUIDE
- 16.2 KNOWLEDGESTORE: MARKETSANDMARKETS' SUBSCRIPTION PORTAL
- 16.3 CUSTOMIZATION OPTIONS
- 16.4 RELATED REPORTS
- 16.5 AUTHOR DETAILS
List of Tables
- TABLE 1 POWER DEVICE ANALYZER MARKET: INCLUSIONS AND EXCLUSIONS
- TABLE 2 IMPACT OF PORTER'S FIVE FORCES ON POWER DEVICE ANALYZER MARKET
- TABLE 3 GDP PERCENTAGE CHANGE, BY KEY COUNTRY, 2021-2029
- TABLE 4 ROLES OF COMPANIES IN POWER DEVICE ANALYZER MARKET ECOSYSTEM
- TABLE 5 AVERAGE SELLING PRICE TREND OF POWER DEVICE ANALYZER SYSTEMS, BY TYPE, 2022-2025 (USD/UNIT)
- TABLE 6 AVERAGE SELLING PRICE TREND OF POWER DEVICE ANALYZER SYSTEMS, BY REGION, 2022-2025 (USD/UNIT)
- TABLE 7 IMPORT DATA FOR HS CODE 903082 INSTRUMENTS AND APPARATUS FOR MEASURING OR CHECKING SEMICONDUCTOR WAFERS OR DEVICES, INCL. INTEGRATED CIRCUITS, BY COUNTRY, 2021-2025 (USD THOUSAND)
- TABLE 8 EXPORT DATA FOR HS CODE 903082 INSTRUMENTS AND APPARATUS FOR MEASURING OR CHECKING SEMICONDUCTOR WAFERS OR DEVICES, INCL. INTEGRATED CIRCUITS, BY COUNTRY, 2021-2025 (USD THOUSAND)
- TABLE 9 POWER DEVICE ANALYZER MARKET: LIST OF KEY CONFERENCES AND EVENTS, 2026-2027
- TABLE 10 US-ADJUSTED RECIPROCAL TARIFF RATES
- TABLE 11 EXPECTED CHANGE IN PRICES AND IMPACT ON END-USE MARKET DUE TO TARIFFS
- TABLE 12 LIST OF PATENTS, BY KEYSIGHT TECHNOLOGIES INC.
- TABLE 13 LIST OF PATENTS, BY QUALCOMM INCORPORATED
- TABLE 14 WIDE BANDGAP SEMICONDUCTOR R&D AND MANUFACTURING
- TABLE 15 ELECTRIC VEHICLE POWERTRAINS & BATTERY SYSTEMS
- TABLE 16 RENEWABLE ENERGY CONVERTERS & ENERGY STORAGE
- TABLE 17 DATA CENTERS & AI POWER INFRASTRUCTURE
- TABLE 18 AEROSPACE, DEFENSE, & MISSION-CRITICAL SYSTEMS
- TABLE 19 TOP USE CASES AND POWER DEVICE ANALYZER MARKET POTENTIAL
- TABLE 20 BEST PRACTICES: USE CASES OF POWER DEVICE ANALYZERS, BY COMPANY
- TABLE 21 CASE STUDIES RELATED TO AI/GEN AI IMPLEMENTATION
- TABLE 22 INTERCONNECTED ECOSYSTEM AND IMPACT ON POWER DEVICE ANALYZER MARKET PLAYERS
- TABLE 23 NORTH AMERICA: LIST OF REGULATORY BODIES, GOVERNMENT AGENCIES, AND OTHER ORGANIZATIONS
- TABLE 24 EUROPE: LIST OF REGULATORY BODIES, GOVERNMENT AGENCIES, AND OTHER ORGANIZATIONS
- TABLE 25 ASIA PACIFIC: LIST OF REGULATORY BODIES, GOVERNMENT AGENCIES, AND OTHER ORGANIZATIONS
- TABLE 26 SOUTH AMERICA: LIST OF REGULATORY BODIES, GOVERNMENT AGENCIES, AND OTHER ORGANIZATIONS
- TABLE 27 MIDDLE EAST & AFRICA: LIST OF REGULATORY BODIES, GOVERNMENT AGENCIES, AND OTHER ORGANIZATIONS
- TABLE 28 GLOBAL INDUSTRY STANDARDS IN POWER DEVICE ANALYZER MARKET
- TABLE 29 CERTIFICATIONS, LABELING, ECO-STANDARDS IN POWER DEVICE ANALYZER MARKET
- TABLE 30 INFLUENCE OF STAKEHOLDERS ON BUYING PROCESS, BY END USE (%)
- TABLE 31 KEY BUYING CRITERIA, BY END USE
- TABLE 32 UNMET NEEDS IN POWER DEVICE ANALYZER MARKET BY END USE
- TABLE 33 POWER DEVICE ANALYZER MARKET, BY TYPE, 2022-2025 (USD MILLION)
- TABLE 34 POWER DEVICE ANALYZER MARKET, BY TYPE, 2026-2031 (USD MILLION)
- TABLE 35 BOTH AC & DC: POWER DEVICE ANALYZER MARKET, BY REGION, 2022-2025 (USD MILLION)
- TABLE 36 BOTH AC & DC: POWER DEVICE ANALYZER MARKET, BY REGION, 2026-2031 (USD MILLION)
- TABLE 37 AC: POWER DEVICE ANALYZER MARKET, BY REGION, 2022-2025 (USD MILLION)
- TABLE 38 AC: POWER DEVICE ANALYZER MARKET, BY REGION, 2026-2031 (USD MILLION)
- TABLE 39 DC: POWER DEVICE ANALYZER MARKET, BY REGION, 2022-2025 (USD MILLION)
- TABLE 40 DC: POWER DEVICE ANALYZER MARKET, BY REGION, 2026-2031 (USD MILLION)
- TABLE 41 POWER DEVICE ANALYZER MARKET, BY CURRENT, 2022-2025 (USD MILLION)
- TABLE 42 POWER DEVICE ANALYZER MARKET, BY CURRENT, 2026-2031 (USD MILLION)
- TABLE 43 BELOW 1000 A: POWER DEVICE ANALYZER MARKET, BY REGION, 2022-2025 (USD MILLION)
- TABLE 44 BELOW 1000 A: POWER DEVICE ANALYZER MARKET, BY REGION, 2026-2031 (USD MILLION)
- TABLE 45 ABOVE 1000 A: POWER DEVICE ANALYZER MARKET, BY REGION, 2022-2025 (USD MILLION)
- TABLE 46 ABOVE 1000 A: POWER DEVICE ANALYZER MARKET, BY REGION, 2026-2031 (USD MILLION)
- TABLE 47 POWER DEVICE ANALYZER MARKET, BY END USE, 2022-2025 (USD MILLION)
- TABLE 48 POWER DEVICE ANALYZER MARKET, BY END USE, 2026-2031 (USD MILLION)
- TABLE 49 AUTOMOTIVE: POWER DEVICE ANALYZER MARKET, BY REGION, 2022-2025 (USD MILLION)
- TABLE 50 AUTOMOTIVE: POWER DEVICE ANALYZER MARKET, BY REGION, 2026-2031 (USD MILLION)
- TABLE 51 ENERGY & POWER ELECTRONICS: POWER DEVICE ANALYZER MARKET, BY REGION, 2022-2025 (USD MILLION)
- TABLE 52 ENERGY & POWER ELECTRONICS: POWER DEVICE ANALYZER MARKET, BY REGION, 2026-2031 (USD MILLION)
- TABLE 53 TELECOMMUNICATION: POWER DEVICE ANALYZER MARKET, BY REGION, 2022-2025 (USD MILLION)
- TABLE 54 TELECOMMUNICATION: POWER DEVICE ANALYZER MARKET, BY REGION, 2026-2031 (USD MILLION)
- TABLE 55 CONSUMER ELECTRONICS & APPLIANCES: POWER DEVICE ANALYZER MARKET, BY REGION, 2022-2025 (USD MILLION)
- TABLE 56 CONSUMER ELECTRONICS & APPLIANCES: POWER DEVICE ANALYZER MARKET, BY REGION, 2026-2031 (USD MILLION)
- TABLE 57 MEDICAL: POWER DEVICE ANALYZER MARKET, BY REGION, 2022-2025 (USD MILLION)
- TABLE 58 MEDICAL: POWER DEVICE ANALYZER MARKET, BY REGION, 2026-2031 (USD MILLION)
- TABLE 59 OTHERS: POWER DEVICE ANALYZER MARKET, BY REGION, 2022-2025 (USD MILLION)
- TABLE 60 OTHERS: POWER DEVICE ANALYZER MARKET, BY REGION, 2026-2031 (USD MILLION)
- TABLE 61 POWER DEVICE ANALYZER MARKET, BY REGION, 2022-2025 (USD MILLION)
- TABLE 62 POWER DEVICE ANALYZER MARKET, BY REGION, 2026-2031 (USD MILLION)
- TABLE 63 POWER DEVICE ANALYZER MARKET, BY REGION, 2022-2025 (UNITS)
- TABLE 64 POWER DEVICE ANALYZER MARKET, BY REGION, 2026-2031 (UNITS)
- TABLE 65 NORTH AMERICA: POWER DEVICE ANALYZER MARKET, BY TYPE, 2022-2025 (USD MILLION)
- TABLE 66 NORTH AMERICA: POWER DEVICE ANALYZER MARKET, BY TYPE, 2026-2031 (USD MILLION)
- TABLE 67 NORTH AMERICA: POWER DEVICE ANALYZER MARKET, BY CURRENT, 2022-2025 (USD MILLION)
- TABLE 68 NORTH AMERICA: POWER DEVICE ANALYZER MARKET, BY CURRENT, 2026-2031 (USD MILLION)
- TABLE 69 NORTH AMERICA: POWER DEVICE ANALYZER MARKET, BY END USE, 2022-2025 (USD MILLION)
- TABLE 70 NORTH AMERICA: POWER DEVICE ANALYZER MARKET, BY END USE, 2026-2031 (USD MILLION)
- TABLE 71 NORTH AMERICA: POWER DEVICE ANALYZER MARKET, BY COUNTRY, 2022-2025 (USD MILLION)
- TABLE 72 NORTH AMERICA: POWER DEVICE ANALYZER MARKET, BY COUNTRY, 2026-2031 (USD MILLION)
- TABLE 73 US: POWER DEVICE ANALYZER MARKET, BY END USE, 2022-2025 (USD MILLION)
- TABLE 74 US: POWER DEVICE ANALYZER MARKET, BY END USE, 2026-2031 (USD MILLION)
- TABLE 75 CANADA: POWER DEVICE ANALYZER MARKET, BY END USE, 2022-2025 (USD MILLION)
- TABLE 76 CANADA: POWER DEVICE ANALYZER MARKET, BY END USE, 2026-2031 (USD MILLION)
- TABLE 77 MEXICO: POWER DEVICE ANALYZER MARKET, BY END USE, 2022-2025 (USD MILLION)
- TABLE 78 MEXICO: POWER DEVICE ANALYZER MARKET, BY END USE, 2026-2031 (USD MILLION)
- TABLE 79 EUROPE: POWER DEVICE ANALYZER MARKET, BY TYPE, 2022-2025 (USD MILLION)
- TABLE 80 EUROPE: POWER DEVICE ANALYZER MARKET, BY TYPE, 2026-2031 (USD MILLION)
- TABLE 81 EUROPE: POWER DEVICE ANALYZER MARKET, BY CURRENT, 2022-2025 (USD MILLION)
- TABLE 82 EUROPE: POWER DEVICE ANALYZER MARKET, BY CURRENT, 2026-2031 (USD MILLION)
- TABLE 83 EUROPE: POWER DEVICE ANALYZER MARKET, BY END USE, 2022-2025 (USD MILLION)
- TABLE 84 EUROPE: POWER DEVICE ANALYZER MARKET, BY END USE, 2026-2031 (USD MILLION)
- TABLE 85 EUROPE: POWER DEVICE ANALYZER MARKET, BY COUNTRY, 2022-2025 (USD MILLION)
- TABLE 86 EUROPE: POWER DEVICE ANALYZER MARKET, BY COUNTRY, 2026-2031 (USD MILLION)
- TABLE 87 GERMANY: POWER DEVICE ANALYZER MARKET, BY END USE, 2022-2025 (USD MILLION)
- TABLE 88 GERMANY: POWER DEVICE ANALYZER MARKET, BY END USE, 2026-2031 (USD MILLION)
- TABLE 89 UK: POWER DEVICE ANALYZER MARKET, BY END USE, 2022-2025 (USD MILLION)
- TABLE 90 UK: POWER DEVICE ANALYZER MARKET, BY END USE, 2026-2031 (USD MILLION)
- TABLE 91 ITALY: POWER DEVICE ANALYZER MARKET, BY END USE, 2022-2025 (USD MILLION)
- TABLE 92 ITALY: POWER DEVICE ANALYZER MARKET, BY END USE, 2026-2031 (USD MILLION)
- TABLE 93 FRANCE: POWER DEVICE ANALYZER MARKET, BY END USE, 2022-2025 (USD MILLION)
- TABLE 94 FRANCE: POWER DEVICE ANALYZER MARKET, BY END USE, 2026-2031 (USD MILLION)
- TABLE 95 SPAIN: POWER DEVICE ANALYZER MARKET, BY END USE, 2022-2025 (USD MILLION)
- TABLE 96 SPAIN: POWER DEVICE ANALYZER MARKET, BY END USE, 2026-2031 (USD MILLION)
- TABLE 97 RUSSIA: POWER DEVICE ANALYZER MARKET, BY END USE, 2022-2025 (USD MILLION)
- TABLE 98 RUSSIA: POWER DEVICE ANALYZER MARKET, BY END USE, 2026-2031 (USD MILLION)
- TABLE 99 REST OF EUROPE: POWER DEVICE ANALYZER MARKET, BY END USE, 2022-2025 (USD MILLION)
- TABLE 100 REST OF EUROPE: POWER DEVICE ANALYZER MARKET, BY END USE, 2026-2031 (USD MILLION)
- TABLE 101 ASIA PACIFIC: POWER DEVICE ANALYZER MARKET, BY TYPE, 2022-2025 (USD MILLION)
- TABLE 102 ASIA PACIFIC: POWER DEVICE ANALYZER MARKET, BY TYPE, 2026-2031 (USD MILLION)
- TABLE 103 ASIA PACIFIC: POWER DEVICE ANALYZER MARKET, BY CURRENT, 2022-2025 (USD MILLION)
- TABLE 104 ASIA PACIFIC: POWER DEVICE ANALYZER MARKET, BY CURRENT, 2026-2031 (USD MILLION)
- TABLE 105 ASIA PACIFIC: POWER DEVICE ANALYZER MARKET, BY END USE, 2022-2025 (USD MILLION)
- TABLE 106 ASIA PACIFIC: POWER DEVICE ANALYZER MARKET, BY END USE, 2026-2031 (USD MILLION)
- TABLE 107 ASIA PACIFIC: POWER DEVICE ANALYZER MARKET, BY COUNTRY, 2022-2025 (USD MILLION)
- TABLE 108 ASIA PACIFIC: POWER DEVICE ANALYZER MARKET, BY COUNTRY, 2026-2031 (USD MILLION)
- TABLE 109 CHINA: POWER DEVICE ANALYZER MARKET, BY END USE, 2022-2025 (USD MILLION)
- TABLE 110 CHINA: POWER DEVICE ANALYZER MARKET, BY END USE, 2026-2031 (USD MILLION)
- TABLE 111 INDIA: POWER DEVICE ANALYZER MARKET, BY END USE, 2022-2025 (USD MILLION)
- TABLE 112 INDIA: POWER DEVICE ANALYZER MARKET, BY END USE, 2026-2031 (USD MILLION)
- TABLE 113 JAPAN: POWER DEVICE ANALYZER MARKET, BY END USE, 2022-2025 (USD MILLION)
- TABLE 114 JAPAN: POWER DEVICE ANALYZER MARKET, BY END USE, 2026-2031 (USD MILLION)
- TABLE 115 SOUTH KOREA: POWER DEVICE ANALYZER MARKET, BY END USE, 2022-2025 (USD MILLION)
- TABLE 116 SOUTH KOREA: POWER DEVICE ANALYZER MARKET, BY END USE, 2026-2031 (USD MILLION)
- TABLE 117 AUSTRALIA: POWER DEVICE ANALYZER MARKET, BY END USE, 2022-2025 (USD MILLION)
- TABLE 118 AUSTRALIA: POWER DEVICE ANALYZER MARKET, BY END USE, 2026-2031 (USD MILLION)
- TABLE 119 REST OF ASIA PACIFIC: POWER DEVICE ANALYZER MARKET, BY END USE, 2022-2025 (USD MILLION)
- TABLE 120 REST OF ASIA PACIFIC: POWER DEVICE ANALYZER MARKET, BY END USE, 2026-2031 (USD MILLION)
- TABLE 121 MIDDLE EAST & AFRICA: POWER DEVICE ANALYZER MARKET, BY TYPE, 2022-2025 (USD MILLION)
- TABLE 122 MIDDLE EAST & AFRICA: POWER DEVICE ANALYZER MARKET, BY TYPE, 2026-2031 (USD MILLION)
- TABLE 123 MIDDLE EAST & AFRICA: POWER DEVICE ANALYZER MARKET, BY CURRENT, 2022-2025 (USD MILLION)
- TABLE 124 MIDDLE EAST & AFRICA: POWER DEVICE ANALYZER MARKET, BY CURRENT, 2026-2031 (USD MILLION)
- TABLE 125 MIDDLE EAST & AFRICA: POWER DEVICE ANALYZER MARKET, BY END USE, 2022-2025 (USD MILLION)
- TABLE 126 MIDDLE EAST & AFRICA: POWER DEVICE ANALYZER MARKET, BY END USE, 2026-2031 (USD MILLION)
- TABLE 127 MIDDLE EAST & AFRICA: POWER DEVICE ANALYZER MARKET, BY COUNTRY, 2022-2025 (USD MILLION)
- TABLE 128 MIDDLE EAST & AFRICA: POWER DEVICE ANALYZER MARKET, BY COUNTRY, 2026-2031 (USD MILLION)
- TABLE 129 GCC: POWER DEVICE ANALYZER MARKET, BY COUNTRY, 2022-2025 (USD MILLION)
- TABLE 130 GCC: POWER DEVICE ANALYZER MARKET, BY COUNTRY, 2026-2031 (USD MILLION)
- TABLE 131 GCC: POWER DEVICE ANALYZER MARKET, BY END USE, 2022-2025 (USD MILLION)
- TABLE 132 GCC: POWER DEVICE ANALYZER MARKET, BY END USE, 2026-2031 (USD MILLION)
- TABLE 133 SAUDI ARABIA: POWER DEVICE ANALYZER MARKET, BY END USE, 2022-2025 (USD MILLION)
- TABLE 134 SAUDI ARABIA: POWER DEVICE ANALYZER MARKET, BY END USE, 2026-2031 (USD MILLION)
- TABLE 135 UAE: POWER DEVICE ANALYZER MARKET, BY END USE, 2022-2025 (USD MILLION)
- TABLE 136 UAE: POWER DEVICE ANALYZER MARKET, BY END USE, 2026-2031 (USD MILLION)
- TABLE 137 REST OF GCC: POWER DEVICE ANALYZER MARKET, BY END USE, 2022-2025 (USD MILLION)
- TABLE 138 REST OF GCC: POWER DEVICE ANALYZER MARKET, BY END USE, 2026-2031 (USD MILLION)
- TABLE 139 SOUTH AFRICA: POWER DEVICE ANALYZER MARKET, BY END USE, 2022-2025 (USD MILLION)
- TABLE 140 SOUTH AFRICA: POWER DEVICE ANALYZER MARKET, BY END USE, 2026-2031 (USD MILLION)
- TABLE 141 REST OF MIDDLE EAST & AFRICA: POWER DEVICE ANALYZER MARKET, BY END USE, 2022-2025 (USD MILLION)
- TABLE 142 REST OF MIDDLE EAST & AFRICA: POWER DEVICE ANALYZER MARKET, BY END USE, 2026-2031 (USD MILLION)
- TABLE 143 SOUTH AMERICA: POWER DEVICE ANALYZER MARKET, BY TYPE, 2022-2025 (USD MILLION)
- TABLE 144 SOUTH AMERICA: POWER DEVICE ANALYZER MARKET, BY TYPE, 2026-2031 (USD MILLION)
- TABLE 145 SOUTH AMERICA: POWER DEVICE ANALYZER MARKET, BY CURRENT, 2022-2025 (USD MILLION)
- TABLE 146 SOUTH AMERICA: POWER DEVICE ANALYZER MARKET, BY CURRENT, 2026-2031 (USD MILLION)
- TABLE 147 SOUTH AMERICA: POWER DEVICE ANALYZER MARKET, BY END USE, 2022-2025 (USD MILLION)
- TABLE 148 SOUTH AMERICA: POWER DEVICE ANALYZER MARKET, BY END USE, 2026-2031 (USD MILLION)
- TABLE 149 SOUTH AMERICA: POWER DEVICE ANALYZER MARKET, BY COUNTRY, 2022-2025 (USD MILLION)
- TABLE 150 SOUTH AMERICA: POWER DEVICE ANALYZER MARKET, BY COUNTRY, 2026-2031 (USD MILLION)
- TABLE 151 BRAZIL: POWER DEVICE ANALYZER MARKET, BY END USE, 2022-2025 (USD MILLION)
- TABLE 152 BRAZIL: POWER DEVICE ANALYZER MARKET, BY END USE, 2026-2031 (USD MILLION)
- TABLE 153 ARGENTINA: POWER DEVICE ANALYZER MARKET, BY END USE, 2022-2025 (USD MILLION)
- TABLE 154 ARGENTINA: POWER DEVICE ANALYZER MARKET, BY END USE, 2026-2031 (USD MILLION)
- TABLE 155 CHILE: POWER DEVICE ANALYZER MARKET, BY END USE, 2022-2025 (USD MILLION)
- TABLE 156 CHILE: POWER DEVICE ANALYZER MARKET, BY END USE, 2026-2031 (USD MILLION)
- TABLE 157 REST OF SOUTH AMERICA: POWER DEVICE ANALYZER MARKET, BY END USE, 2022-2025 (USD MILLION)
- TABLE 158 REST OF SOUTH AMERICA: POWER DEVICE ANALYZER MARKET, BY END USE, 2026-2031 (USD MILLION)
- TABLE 159 POWER DEVICE ANALYZER MARKET: OVERVIEW OF STRATEGIES ADOPTED BY KEY PLAYERS, JANUARY 2021-MAY 2026
- TABLE 160 POWER DEVICE ANALYZER MARKET: DEGREE OF COMPETITION, 2025
- TABLE 161 POWER DEVICE ANALYZER MARKET: REGION FOOTPRINT
- TABLE 162 POWER DEVICE ANALYZER MARKET: TYPE FOOTPRINT
- TABLE 163 POWER DEVICE ANALYZER MARKET: CURRENT FOOTPRINT
- TABLE 164 POWER DEVICE ANALYZER MARKET: END USE FOOTPRINT
- TABLE 165 POWER DEVICE ANALYZER MARKET: DETAILED LIST OF KEY STARTUPS/SMES
- TABLE 166 POWER DEVICE ANALYZER MARKET: COMPETITIVE BENCHMARKING OF KEY STARTUPS/SMES
- TABLE 167 POWER DEVICE ANALYZER MARKET: PRODUCT LAUNCHES, JANUARY 2021-MAY 2026
- TABLE 168 POWER DEVICE ANALYZER MARKET: DEALS, JANUARY 2021-MAY 2026
- TABLE 169 POWER DEVICE ANALYZER MARKET: EXPANSIONS, JANUARY 2021-MAY 2026
- TABLE 170 KEYSIGHT TECHNOLOGIES: COMPANY OVERVIEW
- TABLE 171 KEYSIGHT TECHNOLOGIES: PRODUCTS/SOLUTIONS/SERVICES OFFERED
- TABLE 172 KEYSIGHT TECHNOLOGIES: PRODUCT LAUNCHES
- TABLE 173 KEYSIGHT TECHNOLOGIES: DEALS
- TABLE 174 YOKOGAWA ELECTRIC CORPORATION: COMPANY OVERVIEW
- TABLE 175 YOKOGAWA ELECTRIC CORPORATION: PRODUCTS/SOLUTIONS/ SERVICES OFFERED
- TABLE 176 YOKOGAWA ELECTRIC CORPORATION: PRODUCT LAUNCHES
- TABLE 177 FLUKE CORPORATION: COMPANY OVERVIEW
- TABLE 178 FLUKE CORPORATION: PRODUCTS/SOLUTIONS/SERVICES OFFERED
- TABLE 179 FLUKE CORPORATION: DEALS
- TABLE 180 HIOKI E.E. CORPORATION: COMPANY OVERVIEW
- TABLE 181 HIOKI E.E. CORPORATION: PRODUCTS/SOLUTIONS/SERVICES OFFERED
- TABLE 182 HIOKI E.E. CORPORATION: PRODUCT LAUNCHES
- TABLE 183 CHROMA ATE INC.: COMPANY OVERVIEW
- TABLE 184 CHROMA ATE INC.: PRODUCTS/SOLUTIONS/SERVICES OFFERED
- TABLE 185 DELTA ELECTRONICS, INC.: COMPANY OVERVIEW
- TABLE 186 DELTA ELECTRONICS, INC.: PRODUCTS/SOLUTIONS/SERVICES OFFERED
- TABLE 187 DELTA ELECTRONICS, INC.: PRODUCT LAUNCHES
- TABLE 188 DELTA ELECTRONICS, INC.: DEALS
- TABLE 189 ADVANTEST CORPORATION: COMPANY OVERVIEW
- TABLE 190 ADVANTEST CORPORATION: PRODUCTS/SOLUTIONS/SERVICES OFFERED
- TABLE 191 ADVANTEST CORPORATION: DEALS
- TABLE 192 ADVANTEST CORPORATION: EXPANSIONS
- TABLE 193 CARLO GAVAZZI: COMPANY OVERVIEW
- TABLE 194 CARLO GAVAZZI: PRODUCTS/SOLUTIONS/SERVICES OFFERED
- TABLE 195 CARLO GAVAZZI: PRODUCT LAUNCHES
- TABLE 196 TEXAS INSTRUMENTS INCORPORATED: COMPANY OVERVIEW
- TABLE 197 TEXAS INSTRUMENTS INCORPORATED: PRODUCTS/SOLUTIONS/ SERVICES OFFERED
- TABLE 198 ROHDE & SCHWARZ: COMPANY OVERVIEW
- TABLE 199 ROHDE & SCHWARZ: PRODUCTS/SOLUTIONS/SERVICES OFFERED
- TABLE 200 ROHDE & SCHWARZ: PRODUCT LAUNCHES
- TABLE 201 ROHDE & SCHWARZ: DEALS
- TABLE 202 IWATSU ELECTRIC CO., LTD.: COMPANY OVERVIEW
- TABLE 203 IWATSU ELECTRIC CO., LTD.: PRODUCTS/SOLUTIONS/SERVICES OFFERED
- TABLE 204 VITREK CORPORATION: COMPANY OVERVIEW
- TABLE 205 VITREK CORPORATION: PRODUCTS/SOLUTIONS/SERVICES OFFERED
- TABLE 206 PCE INSTRUMENTS: COMPANY OVERVIEW
- TABLE 207 PCE INSTRUMENTS: PRODUCTS/SOLUTIONS/SERVICES OFFERED
- TABLE 208 DEWETRON GMBH: COMPANY OVERVIEW
- TABLE 209 DEWETRON GMBH: PRODUCTS/SOLUTIONS/SERVICES OFFERED
- TABLE 210 DEWETRON GMBH: PRODUCT LAUNCHES
- TABLE 211 DEWETRON GMBH: DEALS
- TABLE 212 DEWETRON GMBH: EXPANSIONS
- TABLE 213 JANITZA ELECTRONICS GMBH: COMPANY OVERVIEW
- TABLE 214 JANITZA ELECTRONICS GMBH: PRODUCTS/SOLUTIONS/SERVICES OFFERED
- TABLE 215 CIRCUTOR.COM: COMPANY OVERVIEW
- TABLE 216 EXTECH: COMPANY OVERVIEW
- TABLE 217 MAGTROL: COMPANY OVERVIEW
- TABLE 218 DEWESOFT D.O.O.: COMPANY OVERVIEW
- TABLE 219 ARBITER SYSTEMS: COMPANY OVERVIEW
- TABLE 220 VALHALLA SCIENTIFIC: COMPANY OVERVIEW
- TABLE 221 TEKTRONIX, INC.: COMPANY OVERVIEW
- TABLE 222 B&K PRECISION CORPORATION: COMPANY OVERVIEW
- TABLE 223 NATIONAL INSTRUMENTS CORP.: COMPANY OVERVIEW
- TABLE 224 AINUO INSTRUMENT CO., LTD.: COMPANY OVERVIEW
- TABLE 225 MAJOR SECONDARY SOURCES
- TABLE 226 PRIMARY INTERVIEW PARTICIPANTS
- TABLE 227 DATA CAPTURED FROM PRIMARY SOURCES
- TABLE 228 POWER DEVICE ANALYZER MARKET: RISK ANALYSIS
List of Figures
- FIGURE 1 POWER DEVICE ANALYZER MARKET SEGMENTATION AND REGIONAL SCOPE
- FIGURE 2 POWER DEVICE ANALYZER MARKET: DURATION CONSIDERED
- FIGURE 3 POWER DEVICE ANALYZER MARKET SCENARIO
- FIGURE 4 POWER DEVICE ANALYZER MARKET, 2022-2031
- FIGURE 5 MAJOR STRATEGIES ADOPTED BY KEY PLAYERS IN POWER DEVICE ANALYZER MARKET, 2021-2026
- FIGURE 6 DISRUPTIONS INFLUENCING GROWTH OF POWER DEVICE ANALYZER MARKET
- FIGURE 7 HIGH-GROWTH SEGMENTS IN POWER DEVICE ANALYZER MARKET, 2026-2031
- FIGURE 8 ASIA PACIFIC TO REGISTER HIGHEST CAGR DURING FORECAST PERIOD
- FIGURE 9 INCREASING ADOPTION OF WIDE-BANDGAP SEMICONDUCTORS, ELECTRIC VEHICLES, AND RENEWABLE ENERGY SYSTEMS TO FUEL MARKET GROWTH
- FIGURE 10 BOTH AC & DC SEGMENT AND ASIA PACIFIC ACCOUNTED FOR LARGEST MARKET SHARES IN 2025
- FIGURE 11 BOTH AC & DC SEGMENT TO DOMINATE MARKET FROM 2026 TO 2031
- FIGURE 12 BELOW 1000 A SEGMENT TO LEAD MARKET FROM 2026 TO 2031
- FIGURE 13 AUTOMOTIVE SEGMENT TO EXHIBIT HIGHEST CAGR BETWEEN 2026 AND 2031
- FIGURE 14 ARGENTINA TO REGISTER HIGHEST CAGR DURING FORECAST PERIOD
- FIGURE 15 POWER DEVICE ANALYZER MARKET: DRIVERS, RESTRAINTS, OPPORTUNITIES, AND CHALLENGES
- FIGURE 16 GLOBAL EV SALES, 2025
- FIGURE 17 RENEWABLE POWER CAPACITY GROWTH, 2020-2025 (GW)
- FIGURE 18 GLOBAL SEMICONDUCTOR MARKET, YOY GROWTH, 2015-2025 (%)
- FIGURE 19 POWER DEVICE ANALYZER MARKET: PORTER'S FIVE FORCES ANALYSIS
- FIGURE 20 POWER DEVICE ANALYZER MARKET: VALUE CHAIN ANALYSIS
- FIGURE 21 KEY PARTICIPANTS IN POWER DEVICE ANALYZER ECOSYSTEM
- FIGURE 22 POWER DEVICE ANALYZER MARKET: ECOSYSTEM ANALYSIS
- FIGURE 23 AVERAGE SELLING PRICE TREND OF POWER DEVICE ANALYZER SYSTEMS PROVIDED BY KEY PLAYERS, BY TYPE, 2022-2025
- FIGURE 24 REGION-WISE AVERAGE SELLING PRICE TREND OF POWER DEVICE ANALYZER SYSTEMS, 2022-2025
- FIGURE 25 IMPORT DATA FOR HS CODE 903082 INSTRUMENTS AND APPARATUS FOR MEASURING OR CHECKING SEMICONDUCTOR WAFERS OR DEVICES, INCL. INTEGRATED CIRCUITS, BY KEY COUNTRIES, 2021-2025 (USD THOUSAND)
- FIGURE 26 EXPORT DATA FOR HS CODE 903082 INSTRUMENTS AND APPARATUS FOR MEASURING OR CHECKING SEMICONDUCTOR WAFERS OR DEVICES, INCL. INTEGRATED CIRCUITS, BY KEY COUNTRIES, 2021-2025 (USD THOUSAND)
- FIGURE 27 TRENDS/DISRUPTIONS INFLUENCING CUSTOMER BUSINESS
- FIGURE 28 POWER DEVICE ANALYZER MARKET: INVESTMENT AND FUNDING SCENARIO OF MAJOR PLAYERS, 2025 (USD BILLION)
- FIGURE 29 NUMBER OF APPLIED AND GRANTED PATENTS, JANUARY 2015-DECEMBER 2025
- FIGURE 30 PATENT ANALYSIS, BY DOCUMENT TYPE, JANUARY 2015-DECEMBER 2025
- FIGURE 31 LEGAL STATUS OF PATENTS, JANUARY 2015-DECEMBER 2025
- FIGURE 32 JURISDICTION OF US-REGISTERED HIGHEST PERCENTAGE OF PATENTS, 2015-2025
- FIGURE 33 FUTURE APPLICATIONS OF POWER DEVICE ANALYZERS
- FIGURE 34 REAL-WORLD APPLICATIONS
- FIGURE 35 POWER DEVICE ANALYZER MARKET: DECISION-MAKING FACTORS
- FIGURE 36 INFLUENCE OF STAKEHOLDERS ON BUYING PROCESS, BY END USE
- FIGURE 37 KEY BUYING CRITERIA, BY END USE
- FIGURE 38 ADOPTION BARRIERS AND INTERNAL CHALLENGES
- FIGURE 39 POWER DEVICE ANALYZER MARKET, BY TYPE, 2025
- FIGURE 40 POWER DEVICE ANALYZER MARKET, BY CURRENT, 2025
- FIGURE 41 POWER DEVICE ANALYZER MARKET, BY END USE, 2025
- FIGURE 42 ARGENTINA TO REGISTER HIGHEST CAGR IN POWER DEVICE ANALYZER MARKET DURING FORECAST PERIOD
- FIGURE 43 POWER DEVICE ANALYZER MARKET SHARE, BY REGION, 2025
- FIGURE 44 NORTH AMERICA: POWER DEVICE ANALYZER MARKET SNAPSHOT
- FIGURE 45 ASIA PACIFIC: POWER DEVICE ANALYZER MARKET SNAPSHOT
- FIGURE 46 MARKET SHARE ANALYSIS OF COMPANIES OFFERING POWER DEVICE ANALYZERS, 2025
- FIGURE 47 POWER DEVICE ANALYZER MARKET: REVENUE ANALYSIS OF KEY PLAYERS, 2021-2025
- FIGURE 48 PRODUCT COMPARISON
- FIGURE 49 POWER DEVICE ANALYZER MARKET: COMPANY EVALUATION MATRIX (KEY PLAYERS), 2025
- FIGURE 50 POWER DEVICE ANALYZER MARKET: COMPANY FOOTPRINT
- FIGURE 51 POWER DEVICE ANALYZER MARKET: COMPANY EVALUATION MATRIX (STARTUPS/SMES), 2025
- FIGURE 52 COMPANY VALUATION
- FIGURE 53 FINANCIAL METRICS (EV/EBITDA)
- FIGURE 54 KEYSIGHT TECHNOLOGIES: COMPANY SNAPSHOT
- FIGURE 55 YOKOGAWA ELECTRIC CORPORATION: COMPANY SNAPSHOT
- FIGURE 56 HIOKI E.E. CORPORATION: COMPANY SNAPSHOT
- FIGURE 57 CHROMA ATE INC.: COMPANY SNAPSHOT
- FIGURE 58 DELTA ELECTRONICS, INC.: COMPANY SNAPSHOT
- FIGURE 59 ADVANTEST CORPORATION: COMPANY SNAPSHOT
- FIGURE 60 CARLO GAVAZZI: COMPANY SNAPSHOT
- FIGURE 61 TEXAS INSTRUMENTS INCORPORATED: COMPANY SNAPSHOT
- FIGURE 62 POWER DEVICE ANALYZER MARKET: RESEARCH DESIGN
- FIGURE 63 DATA CAPTURED FROM SECONDARY SOURCES
- FIGURE 64 CORE FINDINGS FROM INDUSTRY EXPERTS
- FIGURE 65 BREAKDOWN OF PRIMARY INTERVIEWS, BY COMPANY TYPE, DESIGNATION, AND REGION
- FIGURE 66 POWER DEVICE ANALYZER MARKET: BOTTOM-UP APPROACH
- FIGURE 67 POWER DEVICE ANALYZER MARKET: TOP-DOWN APPROACH
- FIGURE 68 KEY METRICS CONSIDERED TO ANALYZE DEMAND FOR POWER DEVICE ANALYZERS
- FIGURE 69 KEY METRICS CONSIDERED TO ASSESS SUPPLY OF POWER DEVICE ANALYZERS
- FIGURE 70 POWER DEVICE ANALYZER MARKET: SUPPLY-SIDE ANALYSIS
- FIGURE 71 INDUSTRY CONCENTRATION, 2025
- FIGURE 72 POWER DEVICE ANALYZER MARKET: DATA TRIANGULATION
- FIGURE 73 POWER DEVICE ANALYZER MARKET: RESEARCH LIMITATIONS
 功率元件分析儀市場:依類別、電流、類型、功率類型、最終用戶、應用、通路和產業分類-2026-2032年全球市場預測
 功率元件分析儀市場分析及預測(至2035年):依類型、產品類型、服務、技術、組件、應用、最終用戶、功能、安裝類型分類
 功率元件分析儀市場-全球產業規模、佔有率、趨勢、機會和預測,按產品類型、按當前情況、按應用、按地區、按競爭情況細分,2020-2030 年
 全球功率元件分析儀市場機會與策略(至 2034 年)
 功率元件分析儀市場機會、成長動力、產業趨勢分析及 2025 - 2034 年預測
 三相電力設備分析儀市場,按類型、按功能、按應用、按垂直行業、按國家和地區 - 2025 年至 2032 年全球行業分析、市場規模、市場佔有率和預測功率元件分析儀市場,按產品類型、電流、最終用戶、國家和地區 - 2024-2032 年行業分析、市場規模、市場佔有率和預測
 全球功率元件分析儀市場 2024-2031