


 |
市場調查報告書
商品編碼
1993563
全球數位電子看板市場:依產品類型、顯示尺寸、安裝位置、應用、最終用途、企業規模和地區分類-預測至2030年Digital Signage Market by Product (Video Walls, Kiosks, Billboards, Menu Boards, System-on-chip Displays), Resolution (4K, 8K, FHD, HD), Installation Location (Indoor, Outdoor), Software, Display Size, Application, and Region - Global Forecast to 2030 |
||||||
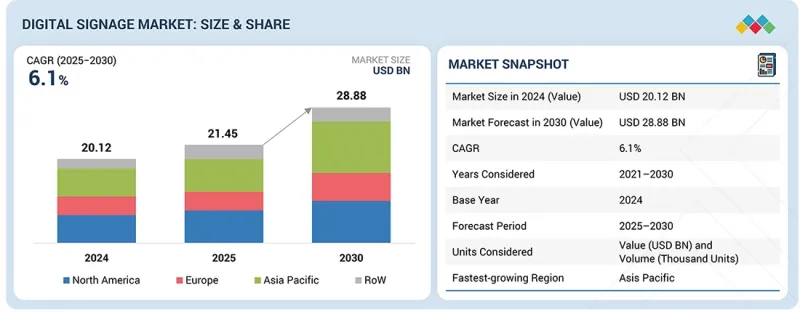
全球數位電子看板市場預計將從 2025 年的 214.5 億美元成長到 2030 年的 288.8 億美元,預測期內複合年成長率為 6.1%。
這一成長是由商業設施中數位電子看板的日益普及、基礎設施應用中對數位顯示器的需求不斷成長以及對高解析度 4K 和 8K 螢幕的需求不斷增加所推動的。
| 調查範圍 | |
|---|---|
| 調查期 | 2021-2030 |
| 基準年 | 2024 |
| 預測期 | 2025-2030 |
| 目標單元 | 金額(10億美元) |
| 部分 | 依產品類型、顯示尺寸、安裝位置、應用、最終用途、公司規模、地區 |
| 目標區域 | 北美、歐洲、亞太地區及其他地區 |
顯示技術的不斷進步也透過提高數位電子看板解決方案的整體性能、效率和圖像質量,促進了市場成長。
對即時內容傳送的需求、技術的進步以及智慧指示牌解決方案的日益普及,正在推動數位電子看板軟體解決方案的需求成長。軟體升級和相關的許可購買預計也將促進該領域的成長。同時,對互動式數位電子看板的需求持續成長,催生了對支援觸控功能、手勢姿態辨識和其他互動功能的高級軟體的需求。這些功能增強了用戶參與度,並提供了更沉浸式的觀看體驗。現代數位電子看板軟體通常包含一個強大的內容管理系統 (CMS),使用戶能夠輕鬆地安排、管理和更新內容。這種柔軟性對於保持顯示內容的及時性、相關性和吸引力至關重要。此外,內建分析工具的軟體平台使企業能夠監控數位電子看板宣傳活動的表現、評估受眾參與度並衡量內容的有效性。
預計2025年至2030年間,52吋以上顯示器市場將實現最快成長。這一成長主要得益於數位電子看板顯示技術的持續創新,以及室內外大尺寸螢幕需求的不斷成長。亞太地區的快速都市化也推動了戶外數位電子看板在各種應用領域的普及。此外,零售和基礎設施領域對大型OLED顯示器的日益廣泛應用,也對整體市場擴張起到了重要的支撐作用。
預計亞太市場在預測期內將保持最高的成長率。這主要得益於物聯網 (IoT) 和數位轉型 (DX) 等技術在商業、公共、基礎設施和工業領域的廣泛應用。這些因素正在推動該地區對數位電子看板的需求。此外,城市發展、消費者購買力的提升以及對更佳用戶體驗日益成長的需求,預計也將推動亞太地區數位電子看板市場在各種商業和公共領域應用方面的成長。
本報告將數位電子看板市場細分,並按產品類型、顯示尺寸、安裝位置、應用領域、公司規模和地區(北美、歐洲、亞太及其他地區)預測市場規模(以金額為準)。該報告還對數位電子看板市場的促進因素和挑戰進行了全面分析,並涵蓋了市場的定量和定性兩方面。
本報告為市場領導和新參與企業提供數位電子看板市場及其相關細分領域最準確的整體收入資訊。它透過提供有價值的洞察,幫助相關人員了解競爭格局、鞏固市場地位並制定有效的打入市場策略。此外,它還提供有關關鍵市場促進因素、限制、機會和挑戰的信息,幫助相關人員了解市場趨勢。
本報告深入分析了以下幾點:
- 本報告分析了關鍵促進因素(商業應用中數位電子看板的日益普及、基礎設施應用中對數位電子看板的需求不斷成長、對 4K 和 8K解析度顯示器的需求不斷成長以及顯示技術的持續進步)、阻礙因素(數位電子看板的高成本)、機會(新興國家基礎設施的快速發展、公共設施中數位電子看板的日益普及以及工業領域中數位電子看板的日益普及)和挑戰(與數位電子看板數位電子看板相關的安全問題、與數位電子看板看板解決方案安裝相關的基礎設施以及電力消耗和影響
- 產品開發/創新:深入了解數位電子看板市場的未來技術趨勢、研發活動和策略,例如新產品發布、業務擴張、合約、合作關係和收購。
- 市場發展:盈利市場的全面資訊-本報告分析了各個地區的數位電子看板市場。
- 市場多元化:數位電子看板市場新產品、未開發地區、近期趨勢和投資的全面訊息
- 競爭分析:對三星(韓國)、LG電子(韓國)、夏普(日本)、利亞德(中國)和SONY集團(日本)等主要企業的市場佔有率、成長策略和產品陣容進行詳細評估。
目錄
第1章:引言
第2章執行摘要
第3章重要考察
第4章 市場概覽
- 市場動態
- 促進因素
- 抑制因子
- 機會
- 任務
- 未滿足的需求和未開發的領域
- 相互關聯的市場與跨產業機遇
- 一級/二級/三級公司的策略性舉措
第5章 產業趨勢
- 波特五力分析
- 總體經濟指標
- 價值鏈分析
- 生態系分析
- 價格分析
- 貿易分析
- 2026-2027 年主要會議和活動
- 影響客戶業務的趨勢/顛覆性因素
- 2021-2024年投資與資金籌措方案
- 案例研究分析
- 美國關稅對2025年數位電子看板市場的影響
第6章:技術進步、人工智慧的影響、專利、創新與未來應用
- 主要新興技術
- 互補技術
- 鄰近技術
- 技術/產品藍圖
- 專利分析
- 人工智慧對數位電子看板市場的影響
第7章 監理情勢
- 當地法規和合規性
- 監管機構、政府機構和其他組織
- 標準
第8章:顧客趨勢與購買行為
- 決策流程
- 採購過程中的關鍵相關人員及其評估標準
- 實施障礙和內部挑戰
- 終端用戶的各種未滿足需求
第9章:數位電子看板市場(依產品/服務分類)
- 硬體
- 軟體
- 服務
第10章:數位電子看板市場(依產品類型分類)
- 電視牆
- 獨立顯示器
第11章:數位電子看板市場(依顯示尺寸分類)
- 小於 32 英寸
- 32-52英寸
- 超過 52 英寸
第12章:數位電子看板市場(依安裝地點分類)
- 室內的
- 戶外的
第13章:數位電子看板市場(按應用領域分類)
- 資訊與通訊
- 方向
- 廣告與促銷
- 交易啟用
- 娛樂
- 企業溝通與流程管理
第14章:數位電子看板市場(按應用領域分類)
- 商業的
- 基礎設施
- 機構
- 產業
第15章:數位電子看板市場(依公司規模分類)
- 小規模辦公室/家庭辦公室
- 小型企業
- 主要企業
第16章:數位電子看板市場(按地區分類)
- 北美洲
- 北美宏觀經濟展望
- 美國
- 加拿大
- 墨西哥
- 歐洲
- 歐洲宏觀經濟展望
- 德國
- 英國
- 法國
- 西班牙
- 義大利
- 荷蘭
- 比利時
- 北歐國家
- 其他
- 亞太地區
- 亞太地區宏觀經濟展望
- 中國
- 澳洲
- 日本
- 印度
- 韓國
- 東南亞
- 其他
- 其他地區
- 宏觀經濟展望
- 中東
- 非洲
- 南美洲
第17章 競爭格局
- 概述
- 主要參與企業的策略/優勢,2021-2025年
- 2025年市佔率分析
- 品牌/產品對比
- 企業估值矩陣:主要企業,2025 年
- 公司估值矩陣:Start-Ups/中小企業,2025 年
- 企業估值和財務指標
- 競爭格局
第18章:公司簡介
- 主要參與企業
- SAMSUNG
- LG ELECTRONICS
- SHARP CORPORATION
- LEYARD
- SONY GROUP CORPORATION
- BARCO
- PANASONIC HOLDINGS CORPORATION
- AUO CORPORATION
- DAKTRONICS
- BRIGHTSIGN LLC
- 其他公司
- STRATACACHE
- BENQ
- INTUIFACE
- DELTA ELECTRONICS, INC.
- BROADSIGN INTERNATIONAL, LLC
- CHRISTIE DIGITAL SYSTEMS USA, INC.
- CISCO SYSTEMS, INC.
- AESYS SPA
- TATTILE SRL
- PPDS
- NAVORI LABS
- VIEWSONIC
- 22 MILES
- FLIPNODE LLC
- SPECTRIO LLC
第19章:調查方法
第20章附錄
The global digital signage market is forecast to expand from USD 21.45 billion in 2025 to USD 28.88 billion by 2030, reflecting a CAGR of 6.1% over the forecast period. This growth is driven by the growing adoption of digital signage across commercial spaces, increasing requirements for digital displays in infrastructure-related applications, and increasing demand for high-resolution 4K and 8K screens.
| Scope of the Report | |
|---|---|
| Years Considered for the Study | 2021-2030 |
| Base Year | 2024 |
| Forecast Period | 2025-2030 |
| Units Considered | Value (USD Billion) |
| Segments | By Offering, Product Type, Application and Region |
| Regions covered | North America, Europe, APAC, RoW |
Ongoing advancements in display technologies are also contributing to market growth by improving performance, efficiency, and visual quality across digital signage solutions.
"By offering, the software segment is expected to register the highest CAGR between 2025 and 2030."
The requirements for real-time content delivery, advances in technology, as well as the increasing adoption of intelligent signage solutions, are fostering demand for digital signage software solutions. Upgrades for the software and subsequent licensed purchases are also anticipated to boost the growth of this segment. At the same time, demand for interactive digital signage continues to rise, creating a need for advanced software that supports touch functionality, gesture recognition, and other interactive features. These capabilities improve user engagement and deliver a more immersive viewing experience. Modern digital signage software typically includes robust content management systems (CMS) that make it easy for users to schedule, manage, and update content. This flexibility is essential for keeping displays timely, relevant, and engaging. In addition, software platforms with built-in analytics tools allow businesses to monitor the performance of their digital signage campaigns, assess audience engagement, and measure content effectiveness.
"Based on display size, the above 52 inches segment is projected to account for the largest market share in 2030."
The segment for displays above 52 inches is expected to see the fastest growth between 2025 and 2030. This growth is being driven by ongoing innovation in digital signage display technologies, along with an increasing preference for large screens in both indoor and outdoor settings. Rapid urbanization across the Asia Pacific region is also driving increased usage of outdoor digital signage for a wide range of applications. In addition, the increasing use of large-format OLED displays in retail and infrastructure settings is playing a key role in supporting overall market expansion.
"The Asia Pacific region is projected to exhibit the highest CAGR from 2025 to 2030."
The Asia Pacific market is predicted to register the highest growth rate during the forecast period. This is primarily driven by the adoption of technologies such as the internet of things (IoT) and digital transformation initiatives in the commercial, institutional, infrastructure, and industrial segments. These factors have led to a high demand for digital signage in the region. Further, the growth of cities, rising consumer purchasing power, increased need for enhanced user experience are anticipated to drive the digital signage market in Asia Pacific across various commercial and institutional applications.
The break-up of the profile of primary participants in the digital signage market-
- By Company Type: Tier 1 - 30%, Tier 2 - 50%, Tier 3 - 20%
- By Designation: C-level Executives - 25%, Directors - 35%, Others - 40%
- By Region: North America - 35%, Europe - 30%, Asia Pacific - 25% , RoW - 10%
Note: Other designations include sales, marketing, and product managers. The three tiers of the companies are based on their total revenues as of 2024: Tier 1: >USD 1 billion, Tier 2: USD 500 million-1 billion, and Tier 3: USD 500 million.
The major companies in the digital signage market are SAMSUNG (South Korea), LG Electronics (South Korea), Sharp Corporation (Japan), LEYARD (China), and Sony Group Corporation (Japan) among others.
Research Coverage
The report segments the digital signage market and forecasts its size, by value, based on offering, display size, product type, installation location, application, enterprise size, and region (North America, Europe, Asia Pacific, and the Rest of the World). The report also comprehensively reviews market drivers, restraints, opportunities, and challenges in the digital signage market. The report also covers qualitative aspects in addition to the quantitative aspects of these markets.
Reasons to Buy the Report:
The report will help the market leaders/new entrants with information on the closest approximate revenues for the overall digital signage market and related segments. This report will help stakeholders understand the competitive landscape and gain valuable insights to strengthen their market position and develop effective go-to-market strategies. The report also helps stakeholders understand the pulse of the market, providing them with information on key market drivers, restraints, opportunities, and challenges.
The report provides insights into the following pointers:
- Analysis of key drivers (growing adoption of digital signage in commercial applications, rising demand of demand signage in infrastructural applications, increasing demand for 4K and 8K resolution displays, and continuous technological advancements in displays), restraints (high cost of digital signage), opportunities (burgeoning infrastructure advancements in emerging economies, increasing popularity of digital signage in institutional settings, and rising adoption of digital signage in industrial sector), and challenges (security concerns linked with digital signage, infrastructure-related issues associated with installation of digital signage solutions, and power consumption and environmental impact) influencing the growth of the digital signage market.
- Product Development/Innovation: Detailed insights on upcoming technologies, research & development activities, and strategies such as new product launches, expansions, contracts, partnerships, and acquisitions in the digital signage market
- Market Development: Comprehensive information about lucrative markets-the report analyses the digital signage market across varied regions
- Market Diversification: Exhaustive information about new products, untapped geographies, recent developments, and investments in the digital signage market
- Competitive Assessment: In-depth assessment of market shares, growth strategies and product offerings of leading players like SAMSUNG (South Korea), LG Electronics (South Korea), Sharp Corporation (Japan), LEYARD (China), and Sony Group Corporation (Japan), among others.
TABLE OF CONTENTS
1 INTRODUCTION
- 1.1 STUDY OBJECTIVES
- 1.2 MARKET DEFINITION
- 1.3 STUDY SCOPE
- 1.3.1 MARKETS COVERED AND REGIONAL SCOPE
- 1.3.2 INCLUSIONS AND EXCLUSIONS
- 1.3.3 YEARS CONSIDERED
- 1.3.4 CURRENCY CONSIDERED
- 1.3.5 UNIT CONSIDERED
- 1.4 STAKEHOLDERS
2 EXECUTIVE SUMMARY
- 2.1 KEY INSIGHTS AND MARKET HIGHLIGHTS
- 2.2 KEY MARKET PARTICIPANTS: MAPPING OF STRATEGIC DEVELOPMENTS
- 2.3 DISRUPTIVE TRENDS SHAPING DIGITAL SIGNAGE MARKET
- 2.4 HIGH-GROWTH SEGMENTS
- 2.5 SNAPSHOT: GLOBAL MARKET SIZE, GROWTH RATE, AND FORECAST
3 PREMIUM INSIGHTS
- 3.1 ATTRACTIVE OPPORTUNITIES FOR PLAYERS IN DIGITAL SIGNAGE MARKET
- 3.2 DIGITAL SIGNAGE MARKET, BY OFFERING
- 3.3 DIGITAL SIGNAGE MARKET, BY PRODUCT TYPE
- 3.4 DIGITAL SIGNAGE MARKET, BY INSTALLATION LOCATION
- 3.5 DIGITAL SIGNAGE MARKET, BY END USE
- 3.6 DIGITAL SIGNAGE MARKET, BY REGION
- 3.7 DIGITAL SIGNAGE MARKET, BY COUNTRY
4 MARKET OVERVIEW
- 4.1 INTRODUCTION
- 4.2 MARKET DYNAMICS
- 4.2.1 DRIVERS
- 4.2.1.1 Growing adoption of digital signage solutions in commercial applications
- 4.2.1.2 Rising deployment of digital signage solutions in infrastructural applications
- 4.2.1.3 Surging demand for 4K and 8K resolution displays
- 4.2.1.4 Increasing focus on launching technologically advanced displays
- 4.2.2 RESTRAINTS
- 4.2.2.1 High ownership cost of digital signage solutions
- 4.2.3 OPPORTUNITIES
- 4.2.3.1 Ongoing infrastructure improvements in emerging economies
- 4.2.3.2 Rising adoption of digital signage in industrial sector
- 4.2.4 CHALLENGES
- 4.2.4.1 Security concerns associated with digital signage solutions
- 4.2.4.2 Infrastructure-related issues with digital signage installation
- 4.2.1 DRIVERS
- 4.3 UNMET NEEDS AND WHITE SPACES
- 4.4 INTERCONNECTED MARKETS AND CROSS-SECTOR OPPORTUNITIES
- 4.5 STRATEGIC MOVES BY TIER 1/2/3/ PLAYERS
5 INDUSTRY TRENDS
- 5.1 INTRODUCTION
- 5.2 PORTER'S FIVE FORCES ANALYSIS
- 5.2.1 THREAT OF NEW ENTRANTS
- 5.2.2 THREAT OF SUBSTITUTES
- 5.2.3 BARGAINING POWER OF SUPPLIERS
- 5.2.4 BARGAINING POWER OF BUYERS
- 5.2.5 INTENSITY OF COMPETITIVE RIVALRY
- 5.3 MACROECONOMIC INDICATORS
- 5.3.1 INTRODUCTION
- 5.3.2 GDP TRENDS AND FORECAST
- 5.3.3 TRENDS IN GLOBAL TRANSPORTATION INDUSTRY
- 5.3.4 TRENDS IN GLOBAL RETAIL INDUSTRY
- 5.4 VALUE CHAIN ANALYSIS
- 5.5 ECOSYSTEM ANALYSIS
- 5.6 PRICING ANALYSIS
- 5.6.1 AVERAGE SELLING PRICE OF DIGITAL SIGNAGE SOLUTIONS OFFERED BY KEY PLAYERS, BY PRODUCT TYPE, 2024
- 5.6.2 AVERAGE SELLING PRICE TREND OF DIGITAL SIGNAGE SOLUTIONS, BY REGION, 2021-2024
- 5.7 TRADE ANALYSIS
- 5.7.1 IMPORT SCENARIO (HS CODE 852859)
- 5.7.2 EXPORT DATA (HS CODE 852859)
- 5.8 KEY CONFERENCES AND EVENTS, 2026-2027
- 5.9 TRENDS/DISRUPTIONS IMPACTING CUSTOMER BUSINESS
- 5.10 INVESTMENT AND FUNDING SCENARIO, 2021-2024
- 5.11 CASE STUDY ANALYSIS
- 5.11.1 GLOBAL QUICK-SERVICE RESTAURANT (QSR) CHAIN IMPLEMENTS CLOUD-BASED DIGITAL MENU BOARDS TO IMPROVE SALES AGILITY AND OPERATIONAL EFFICIENCY
- 5.11.2 INTERNATIONAL AIRPORT DEPLOYS LED VIDEO WALLS AND SMART WAYFINDING SIGNAGE TO ENHANCE PASSENGER EXPERIENCE
- 5.11.3 RETAIL CHAIN ADOPTS AI-DRIVEN DIGITAL SIGNAGE TO ENABLE OMNICHANNEL PERSONALIZATION
- 5.11.4 MULTI-LOCATION BANKING NETWORK IMPLEMENTS INTERACTIVE DIGITAL SIGNAGE TO ENHANCE CUSTOMER ENGAGEMENT AND CROSS-SELLING
- 5.12 IMPACT OF 2025 US TARIFF - DIGITAL SIGNAGE MARKET
- 5.12.1 INTRODUCTION
- 5.12.2 KEY TARIFF RATES
- 5.12.3 PRICE IMPACT ANALYSIS
- 5.12.4 IMPACT ON COUNTRY/REGION
- 5.12.4.1 US
- 5.12.4.2 Europe
- 5.12.4.3 Asia Pacific
- 5.12.5 IMPACT ON INDUSTRIES
6 TECHNOLOGICAL ADVANCEMENTS, AI-DRIVEN IMPACT, PATENTS, INNOVATIONS, AND FUTURE APPLICATIONS
- 6.1 KEY EMERGING TECHNOLOGIES
- 6.1.1 SYSTEM-ON-CHIP DISPLAYS
- 6.1.2 INTERACTIVE DISPLAYS
- 6.2 COMPLEMENTARY TECHNOLOGIES
- 6.2.1 CLOUD AND SAAS INFRASTRUCTURE
- 6.2.2 DATA & ANALYTICS PLATFORMS FOR DIGITAL SIGNAGE
- 6.3 ADJACENT TECHNOLOGIES
- 6.3.1 MOBILE & OMNI-CHANNEL TECHNOLOGIES
- 6.3.2 AR/XR & IMMERSIVE TECHNOLOGIES
- 6.4 TECHNOLOGY/PRODUCT ROADMAP
- 6.4.1 SHORT-TERM (2025-2027): SYSTEM OPTIMIZATION AND DIGITAL INTEGRATION
- 6.4.2 MID-TERM (2027-2030): INTELLIGENT AUTOMATION AND ECOSYSTEM EXPANSION
- 6.5 PATENT ANALYSIS
- 6.6 IMPACT OF AI ON DIGITAL SIGNAGE MARKET
- 6.6.1 TOP USE CASES AND MARKET POTENTIAL
- 6.6.2 BEST PRACTICES IN DIGITAL SIGNAGE MARKET
- 6.6.3 CASE STUDIES RELATED TO AI IMPLEMENTATION IN DIGITAL SIGNAGE MARKET
- 6.6.4 INTERCONNECTED ECOSYSTEM AND IMPACT ON MARKET PLAYERS
- 6.6.5 CLIENTS' READINESS TO ADOPT AI-INTEGRATED DIGITAL SIGNAGE
7 REGULATORY LANDSCAPE
- 7.1 REGIONAL REGULATIONS AND COMPLIANCE
- 7.1.1 REGULATORY BODIES, GOVERNMENT AGENCIES, AND OTHER ORGANIZATIONS
- 7.1.2 STANDARDS
8 CUSTOMER LANDSCAPE AND BUYER BEHAVIOR
- 8.1 INTRODUCTION
- 8.2 DECISION-MAKING PROCESS
- 8.3 KEY STAKEHOLDERS INVOLVED IN BUYING PROCESS AND THEIR EVALUATION CRITERIA
- 8.3.1 KEY STAKEHOLDERS IN BUYING PROCESS
- 8.3.2 BUYING CRITERIA
- 8.4 ADOPTION BARRIERS AND INTERNAL CHALLENGES
- 8.5 UNMET NEEDS OF VARIOUS END USERS
9 DIGITAL SIGNAGE MARKET, BY OFFERING
- 9.1 INTRODUCTION
- 9.2 HARDWARE
- 9.2.1 ADVANCEMENTS IN DISPLAY TECHNOLOGIES AND EXPANDING VISUAL COMMUNICATION INFRASTRUCTURE TO DRIVE DEMAND
- 9.2.2 DISPLAYS
- 9.2.3 MEDIA PLAYERS
- 9.2.4 PROJECTORS
- 9.2.5 OTHER HARDWARE OFFERINGS
- 9.3 SOFTWARE
- 9.3.1 ADVANCEMENTS IN DISPLAY TECHNOLOGIES AND EXPANDING VISUAL COMMUNICATION INFRASTRUCTURE TO DRIVE DEMAND
- 9.3.2 CONTENT MANAGEMENT SYSTEMS
- 9.3.3 EDGE SERVER SOFTWARE
- 9.3.4 OTHER SOFTWARE OFFERINGS
- 9.4 SERVICES
- 9.4.1 END-TO-END DEPLOYMENT SUPPORT AND LIFECYCLE MANAGEMENT SERVICES TO PROPEL MARKET
- 9.4.2 INSTALLATION
- 9.4.3 CONSULTING & OTHER SERVICES
- 9.4.4 MAINTENANCE & OTHER SERVICES
10 DIGITAL SIGNAGE MARKET, BY PRODUCT TYPE
- 10.1 INTRODUCTION
- 10.2 VIDEO WALLS
- 10.2.1 LARGE-FORMAT IMMERSIVE VISUAL EXPERIENCES AND HIGH-VISIBILITY COMMUNICATION TO DRIVE ADOPTION
- 10.3 STANDALONE DISPLAYS
- 10.3.1 FLEXIBLE DEPLOYMENT AND COST-EFFECTIVE DIGITAL COMMUNICATION TO DRIVE GROWTH
- 10.3.2 KIOSKS
- 10.3.2.1 Self-service kiosks
- 10.3.2.2 Information kiosks
- 10.3.3 INFORMATION DISPLAYS
- 10.3.3.1 Menu boards
- 10.3.3.2 Billboards
- 10.3.3.3 Electronic shelf labels
- 10.3.3.4 Others
11 DIGITAL SIGNAGE MARKET, BY DISPLAY SIZE
- 11.1 INTRODUCTION
- 11.2 SMALLER THAN 32 INCHES
- 11.3 32 TO 52 INCHES
- 11.4 LARGER THAN 52 INCHES
12 DIGITAL SIGNAGE MARKET, BY INSTALLATION LOCATION
- 12.1 INTRODUCTION
- 12.2 INDOOR
- 12.2.1 ENHANCED CUSTOMER ENGAGEMENT AND CONTROLLED ENVIRONMENT DEPLOYMENTS TO DRIVE MARKET
- 12.3 OUTDOOR
- 12.3.1 HIGH-VISIBILITY ADVERTISING AND SMART CITY INFRASTRUCTURE EXPANSION TO PROPEL MARKET
13 DIGITAL SIGNAGE MARKET, BY APPLICATION
- 13.1 INTRODUCTION
- 13.2 INFORMATION & MESSAGING
- 13.2.1 REAL-TIME COMMUNICATION AND CENTRALIZED INFORMATION DELIVERY TO DRIVE GROWTH
- 13.3 WAYFINDING
- 13.3.1 ENHANCED VISITOR NAVIGATION AND SMART FACILITY MANAGEMENT TO DRIVE MARKET
- 13.4 ADVERTISING & PROMOTION
- 13.4.1 NEED FOR TARGETED DIGITAL ADVERTISING AND DYNAMIC CONTENT DELIVERY TO PROPEL MARKET
- 13.5 TRANSACTION ENABLEMENT
- 13.5.1 SELF-SERVICE AUTOMATION AND CONTACTLESS INTERACTIONS TO DRIVE GROWTH
- 13.6 ENTERTAINMENT
- 13.6.1 RISE IN IMMERSIVE VISUAL EXPERIENCES AND AUDIENCE ENGAGEMENT TO PROPEL MARKET
- 13.7 CORPORATE COMMUNICATION & PROCESS MANAGEMENT
- 13.7.1 WORKPLACE DIGITALIZATION AND REAL-TIME OPERATIONAL VISIBILITY TO DRIVE MARKET
14 DIGITAL SIGNAGE MARKET, BY END USE
- 14.1 INTRODUCTION
- 14.2 COMMERCIAL
- 14.2.1 RETAIL
- 14.2.1.1 IN-STORE DIGITAL TRANSFORMATION AND OMNICHANNEL CUSTOMER ENGAGEMENT TO DRIVE GROWTH
- 14.2.2 CORPORATE OFFICES
- 14.2.2.1 WORKPLACE DIGITALIZATION AND ENHANCED INTERNAL COMMUNICATION TO DRIVE GROWTH
- 14.2.3 HEALTHCARE FACILITIES
- 14.2.3.1 PATIENT EXPERIENCE ENHANCEMENT AND OPERATIONAL COMMUNICATION EFFICIENCY TO PROPEL MARKET
- 14.2.4 HOSPITALITY FACILITIES & RESTAURANTS
- 14.2.4.1 DIGITAL DINING EXPERIENCES AND SERVICE AUTOMATION TO DRIVE SEGMENT GROWTH
- 14.2.1 RETAIL
- 14.3 INFRASTRUCTURAL
- 14.3.1 TRANSPORTATION HUBS & PUBLIC PLACES
- 14.3.1.1 Real-time information dissemination and crowd management to drive demand
- 14.3.2 SPORTS & ENTERTAINMENT VENUES
- 14.3.2.1 Enhanced fan engagement and immersive venue experiences to drive market
- 14.3.1 TRANSPORTATION HUBS & PUBLIC PLACES
- 14.4 INSTITUTIONAL
- 14.4.1 GOVERNMENT & PUBLIC SECTOR INSTITUTIONS
- 14.4.1.1 Transparent public information delivery and citizen engagement initiatives to drive growth
- 14.4.2 BFSI INSTITUTIONS
- 14.4.2.1 Enhanced customer engagement and digital branch transformation to drive adoption
- 14.4.3 EDUCATIONAL INSTITUTIONS
- 14.4.3.1 Smart campus communication and real-time information delivery to drive market
- 14.4.1 GOVERNMENT & PUBLIC SECTOR INSTITUTIONS
- 14.5 INDUSTRIAL
15 DIGITAL SIGNAGE MARKET, BY ENTERPRISE SIZE
- 15.1 INTRODUCTION
- 15.2 SMALL OFFICES/ HOME OFFICES
- 15.2.1 COST-EFFECTIVE DIGITAL COMMUNICATION AND EASY DEPLOYMENT TO DRIVE ADOPTION
- 15.3 SMALL & MEDIUM-SIZED ENTERPRISES
- 15.3.1 SCALABLE COMMUNICATION SOLUTIONS AND OPERATIONAL EFFICIENCY TO PROPEL MARKET
- 15.4 LARGE ENTERPRISES
- 15.4.1 ENTERPRISE-WIDE DIGITAL TRANSFORMATION AND CENTRALIZED CONTENT ECOSYSTEMS TO DRIVE MARKET
16 DIGITAL SIGNAGE MARKET, BY REGION
- 16.1 INTRODUCTION
- 16.2 NORTH AMERICA
- 16.2.1 MACROECONOMIC OUTLOOK IN NORTH AMERICA
- 16.2.2 US
- 16.2.2.1 Rising investments in digital transformation and data-driven customer engagement to drive adoption
- 16.2.3 CANADA
- 16.2.3.1 Increasing adoption of digital communication solutions and smart infrastructure modernization to propel market
- 16.2.4 MEXICO
- 16.2.4.1 Expanding retail infrastructure and urban commercial development to support market growth
- 16.3 EUROPE
- 16.3.1 MACROECONOMIC OUTLOOK IN EUROPE
- 16.3.2 GERMANY
- 16.3.2.1 Growing adoption of smart retail, digital workplaces, and intelligent public communication systems to drive market
- 16.3.3 UK
- 16.3.3.1 Expansion of digital advertising and smart infrastructure to drive adoption
- 16.3.4 FRANCE
- 16.3.4.1 Retail modernization and smart public communication to drive market
- 16.3.5 SPAIN
- 16.3.5.1 Growth in tourism and retail digitization to support market expansion
- 16.3.6 ITALY
- 16.3.6.1 Increasing adoption across retail, hospitality, and transportation environments to propel market
- 16.3.7 NETHERLANDS
- 16.3.7.1 Smart city initiatives and advanced retail technologies to drive adoption
- 16.3.8 BELGIUM
- 16.3.8.1 Increasing deployment in public infrastructure and commercial spaces to support market growth
- 16.3.9 NORDIC COUNTRIES
- 16.3.9.1 Strong digital infrastructure and sustainability focus to drive adoption
- 16.3.10 REST OF EUROPE
- 16.4 ASIA PACIFIC
- 16.4.1 MACROECONOMIC OUTLOOK IN ASIA PACIFIC
- 16.4.2 CHINA
- 16.4.2.1 Rapid expansion of smart retail, urban infrastructure, and digital advertising networks to propel market
- 16.4.3 AUSTRALIA
- 16.4.3.1 Rising adoption of digital signage across retail, transportation, and smart public infrastructure to drive market
- 16.4.4 JAPAN
- 16.4.4.1 Advanced display technologies and smart retail innovation to support market growth
- 16.4.5 INDIA
- 16.4.5.1 Rapid retail expansion and smart city initiatives to accelerate adoption
- 16.4.6 SOUTH KOREA
- 16.4.6.1 Leadership in display innovation and smart commercial environments to drive market
- 16.4.7 SOUTHEAST ASIA
- 16.4.7.1 Expanding retail infrastructure and urban digital advertising to drive adoption
- 16.4.8 REST OF ASIA PACIFIC
- 16.5 ROW
- 16.5.1 MACROECONOMIC OUTLOOK IN ROW
- 16.5.2 MIDDLE EAST
- 16.5.2.1 Bahrain
- 16.5.2.1.1 Growing smart infrastructure development and retail modernization to drive adoption
- 16.5.2.2 Kuwait
- 16.5.2.2.1 Expanding retail infrastructure and smart public communication initiatives to drive adoption
- 16.5.2.3 Oman
- 16.5.2.3.1 Tourism development and public infrastructure modernization to drive adoption
- 16.5.2.4 Qatar
- 16.5.2.4.1 Smart infrastructure investments and large-scale event ecosystems to accelerate deployment
- 16.5.2.5 Saudi Arabia
- 16.5.2.5.1 Vision 2030 smart city development and retail expansion to drive growth
- 16.5.2.6 UAE
- 16.5.2.6.1 Smart city innovation and experience-driven retail ecosystems to fuel expansion
- 16.5.2.7 Rest of Middle East
- 16.5.2.1 Bahrain
- 16.5.3 AFRICA
- 16.5.3.1 South Africa
- 16.5.3.1.1 Retail expansion and growing DOOH advertising to drive adoption
- 16.5.3.2 Rest of Africa
- 16.5.3.1 South Africa
- 16.5.4 SOUTH AMERICA
- 16.5.4.1 Expanding retail networks and growing digital out-of-home advertising to propel market
17 COMPETITIVE LANDSCAPE
- 17.1 OVERVIEW
- 17.2 KEY PLAYER STRATEGIES/RIGHT TO WIN, 2021-2025
- 17.3 MARKET SHARE ANALYSIS, 2025
- 17.4 BRAND/PRODUCT COMPARISON
- 17.5 COMPANY EVALUATION MATRIX: KEY PLAYERS, 2025
- 17.5.1 STARS
- 17.5.2 EMERGING LEADERS
- 17.5.3 PERVASIVE PLAYERS
- 17.5.4 PARTICIPANTS
- 17.5.5 COMPANY FOOTPRINT: KEY PLAYERS, 2025
- 17.5.5.1 Company footprint
- 17.5.5.2 Region footprint
- 17.5.5.3 Offering footprint
- 17.5.5.4 Product type footprint
- 17.5.5.5 Installation location footprint
- 17.5.5.6 Application footprint
- 17.5.5.7 End-use footprint
- 17.6 COMPANY EVALUATION MATRIX: STARTUPS/SMES, 2025
- 17.6.1 PROGRESSIVE COMPANIES
- 17.6.2 RESPONSIVE COMPANIES
- 17.6.3 DYNAMIC COMPANIES
- 17.6.4 STARTING BLOCKS
- 17.6.5 COMPETITIVE BENCHMARKING: STARTUPS/SMES, 2025
- 17.6.5.1 Detailed list of key startups/SMEs
- 17.6.5.2 Competitive benchmarking of startups/SMEs
- 17.7 COMPANY VALUATION & FINANCIAL METRICS
- 17.8 COMPETITIVE SCENARIO
- 17.8.1 PRODUCT LAUNCHES
- 17.8.2 DEALS
18 COMPANY PROFILES
- 18.1 INTRODUCTION
- 18.2 KEY PLAYERS
- 18.2.1 SAMSUNG
- 18.2.1.1 Business overview
- 18.2.1.2 Products/Solutions/Services offered
- 18.2.1.3 Recent developments
- 18.2.1.3.1 Product launches
- 18.2.1.3.2 Deals
- 18.2.1.4 MnM view
- 18.2.1.4.1 Key strengths
- 18.2.1.4.2 Strategic choices
- 18.2.1.4.3 Weaknesses & competitive threats
- 18.2.2 LG ELECTRONICS
- 18.2.2.1 Business overview
- 18.2.2.2 Products/Solutions/Services offered
- 18.2.2.3 Recent developments
- 18.2.2.3.1 Product launches
- 18.2.2.3.2 Deals
- 18.2.2.4 MnM view
- 18.2.2.4.1 Key strengths
- 18.2.2.4.2 Strategic choices
- 18.2.2.4.3 Weaknesses & competitive threats
- 18.2.3 SHARP CORPORATION
- 18.2.3.1 Business overview
- 18.2.3.2 Products/Solutions/Services offered
- 18.2.3.3 Recent developments
- 18.2.3.3.1 Product launches
- 18.2.3.3.2 Deals
- 18.2.3.4 MnM view
- 18.2.3.4.1 Key strengths
- 18.2.3.4.2 Strategic choices
- 18.2.3.4.3 Weaknesses & competitive threats
- 18.2.4 LEYARD
- 18.2.4.1 Business overview
- 18.2.4.2 Products/Solutions/Services offered
- 18.2.4.3 Recent developments
- 18.2.4.3.1 Product launches
- 18.2.4.4 MnM view
- 18.2.4.4.1 Key strengths
- 18.2.4.4.2 Strategic choices
- 18.2.4.4.3 Weaknesses & competitive threats
- 18.2.5 SONY GROUP CORPORATION
- 18.2.5.1 Business overview
- 18.2.5.2 Products/Solutions/Services offered
- 18.2.5.3 Recent developments
- 18.2.5.3.1 Product launches
- 18.2.5.3.2 Deals
- 18.2.5.4 MnM view
- 18.2.5.4.1 Key strengths
- 18.2.5.4.2 Strategic choices
- 18.2.5.4.3 Weaknesses & competitive threats
- 18.2.6 BARCO
- 18.2.6.1 Business overview
- 18.2.6.2 Products/Solutions/Services offered
- 18.2.6.3 Recent developments
- 18.2.6.3.1 Product launches
- 18.2.6.3.2 Deals
- 18.2.7 PANASONIC HOLDINGS CORPORATION
- 18.2.7.1 Business overview
- 18.2.7.2 Products/Solutions/Services offered
- 18.2.7.3 Recent developments
- 18.2.7.3.1 Product launches
- 18.2.8 AUO CORPORATION
- 18.2.8.1 Business overview
- 18.2.8.2 Products/Solutions/Services offered
- 18.2.8.3 Recent developments
- 18.2.8.3.1 Product launches
- 18.2.8.3.2 Deals
- 18.2.8.3.3 Others
- 18.2.9 DAKTRONICS
- 18.2.9.1 Business overview
- 18.2.9.2 Products/Solutions/Services offered
- 18.2.9.3 Recent developments
- 18.2.9.3.1 Product launches
- 18.2.9.3.2 Deals
- 18.2.10 BRIGHTSIGN LLC
- 18.2.10.1 Business overview
- 18.2.10.2 Products/Solutions/Services offered
- 18.2.10.3 Recent developments
- 18.2.10.3.1 Product launches
- 18.2.10.3.2 Deals
- 18.2.1 SAMSUNG
- 18.3 OTHER PLAYERS
- 18.3.1 STRATACACHE
- 18.3.2 BENQ
- 18.3.3 INTUIFACE
- 18.3.4 DELTA ELECTRONICS, INC.
- 18.3.5 BROADSIGN INTERNATIONAL, LLC
- 18.3.6 CHRISTIE DIGITAL SYSTEMS USA, INC.
- 18.3.7 CISCO SYSTEMS, INC.
- 18.3.8 AESYS S.P.A.
- 18.3.9 TATTILE S.R.L.
- 18.3.10 PPDS
- 18.3.11 NAVORI LABS
- 18.3.12 VIEWSONIC
- 18.3.13 22 MILES
- 18.3.14 FLIPNODE LLC
- 18.3.15 SPECTRIO LLC
19 RESEARCH METHODOLOGY
- 19.1 RESEARCH DATA
- 19.1.1 SECONDARY DATA
- 19.1.1.1 List of key secondary sources
- 19.1.1.2 Key data from secondary sources
- 19.1.2 PRIMARY DATA
- 19.1.2.1 List of primary interview participants
- 19.1.2.2 Breakdown of primary interviews
- 19.1.2.3 Key data from primary sources
- 19.1.2.4 Key industry insights
- 19.1.3 SECONDARY AND PRIMARY RESEARCH
- 19.1.1 SECONDARY DATA
- 19.2 MARKET SIZE ESTIMATION
- 19.2.1 BOTTOM-UP APPROACH
- 19.2.1.1 Approach to arrive at market size using bottom-up analysis (demand side)
- 19.2.2 TOP-DOWN APPROACH
- 19.2.2.1 Approach to arrive at market size using top-down analysis (supply side)
- 19.2.1 BOTTOM-UP APPROACH
- 19.3 FACTOR ANALYSIS
- 19.3.1 DEMAND-SIDE ANALYSIS
- 19.3.2 SUPPLY-SIDE ANALYSIS
- 19.4 MARKET BREAKDOWN AND DATA TRIANGULATION
- 19.5 RESEARCH ASSUMPTIONS
- 19.6 RISK ASSESSMENT
- 19.7 RESEARCH LIMITATIONS
20 APPENDIX
- 20.1 KNOWLEDGESTORE: MARKETSANDMARKETS' SUBSCRIPTION PORTAL
- 20.2 CUSTOMIZATION OPTIONS
- 20.3 RELATED REPORTS
- 20.4 AUTHOR DETAILS
List of Tables
- TABLE 1 DIGITAL SIGNAGE MARKET: SUMMARY OF CHANGES
- TABLE 2 STRATEGIC MOVES/FOCUS OF TIER 1/2/3 PLAYERS
- TABLE 3 IMPACT OF PORTER'S FIVE FORCES
- TABLE 4 GDP PERCENTAGE CHANGE, BY KEY COUNTRY, 2021-2029
- TABLE 5 ROLE OF COMPANIES IN DIGITAL SIGNAGE ECOSYSTEM
- TABLE 6 AVERAGE SELLING PRICE OF VIDEO WALLS PROVIDED BY KEY PLAYERS, 2024 (USD)
- TABLE 7 AVERAGE SELLING PRICE OF SIGNAGE & INFORMATION DISPLAYS PROVIDED BY KEY PLAYERS, 2024 (USD)
- TABLE 8 AVERAGE SELLING PRICE OF VIDEO WALLS, BY REGION, 2021-2024 (USD)
- TABLE 9 AVERAGE SELLING PRICE OF SIGNAGE & INFORMATION DISPLAYS, BY REGION, 2021-2024 (USD)
- TABLE 10 IMPORT DATA FOR HS CODE 852859-COMPLIANT PRODUCTS, BY COUNTRY, 2021-2024 (USD MILLION)
- TABLE 11 EXPORT DATA FOR HS CODE 852859-COMPLIANT PRODUCTS, BY COUNTRY, 2021-2024 (USD MILLION)
- TABLE 12 LIST OF KEY CONFERENCES AND EVENTS, 2026-2027
- TABLE 13 CLOUD-BASED DIGITAL SIGNAGE PLATFORM ENABLES GLOBAL QSR BRAND TO INCREASE SALES AND REDUCE CONTENT MANAGEMENT COSTS
- TABLE 14 SMART DIGITAL SIGNAGE ECOSYSTEM IMPROVES PASSENGER FLOW AND ADVERTISING REVENUE AT MAJOR INTERNATIONAL AIRPORT
- TABLE 15 AI-ENABLED DIGITAL SIGNAGE PLATFORM DRIVES HIGHER IN-STORE CONVERSION AND DATA-DRIVEN MARKETING
- TABLE 16 CLOUD-MANAGED DIGITAL SIGNAGE PLATFORM ENABLES RETAIL BANK TO IMPROVE CUSTOMER EXPERIENCE AND PRODUCT AWARENESS
- TABLE 17 US-ADJUSTED RECIPROCAL TARIFF RATES
- TABLE 18 LIST OF MAJOR PATENTS, 2023-2024
- TABLE 19 TOP USE CASES OF DIGITAL SIGNAGE AND MARKET POTENTIAL
- TABLE 20 BEST PRACTICES: COMPANIES IMPLEMENTING USE CASES
- TABLE 21 CASE STUDIES RELATED TO AI IMPLEMENTATION IN DIGITAL SIGNAGE
- TABLE 22 INTERCONNECTED ECOSYSTEM AND IMPACT ON DIGITAL SIGNAGE MARKET PLAYERS
- TABLE 23 NORTH AMERICA: REGULATORY BODIES, GOVERNMENT AGENCIES, AND OTHER ORGANIZATIONS
- TABLE 24 EUROPE: REGULATORY BODIES, GOVERNMENT AGENCIES, AND OTHER ORGANIZATIONS
- TABLE 25 ASIA PACIFIC: REGULATORY BODIES, GOVERNMENT AGENCIES, AND OTHER ORGANIZATIONS
- TABLE 26 ROW: REGULATORY BODIES, GOVERNMENT AGENCIES, AND OTHER ORGANIZATIONS
- TABLE 27 INFLUENCE OF STAKEHOLDERS ON BUYING PROCESS FOR TOP THREE END USES (%)
- TABLE 28 KEY BUYING CRITERIA FOR THREE END USES
- TABLE 29 UNMET NEEDS IN DIGITAL SIGNAGE MARKET, BY END USE
- TABLE 30 DIGITAL SIGNAGE MARKET, BY OFFERING, 2022-2025 (USD MILLION)
- TABLE 31 DIGITAL SIGNAGE MARKET, BY OFFERING, 2026-2032 (USD MILLION)
- TABLE 32 HARDWARE: DIGITAL SIGNAGE MARKET, BY TYPE, 2022-2025 (USD MILLION)
- TABLE 33 HARDWARE: DIGITAL SIGNAGE MARKET, BY TYPE, 2026-2032 (USD MILLION)
- TABLE 34 HARDWARE: DIGITAL SIGNAGE MARKET, BY END USE, 2022-2025 (USD MILLION)
- TABLE 35 HARDWARE: DIGITAL SIGNAGE MARKET, BY END USE, 2026-2032 (USD MILLION)
- TABLE 36 HARDWARE: DIGITAL SIGNAGE MARKET FOR COMMERCIAL, BY TYPE, 2022-2025 (USD MILLION)
- TABLE 37 HARDWARE: DIGITAL SIGNAGE MARKET FOR COMMERCIAL, BY TYPE, 2026-2032 (USD MILLION)
- TABLE 38 HARDWARE: DIGITAL SIGNAGE MARKET FOR INFRASTRUCTURAL, BY TYPE, 2022-2025 (USD MILLION)
- TABLE 39 HARDWARE: DIGITAL SIGNAGE MARKET FOR INFRASTRUCTURAL, BY TYPE, 2026-2032 (USD MILLION)
- TABLE 40 HARDWARE: DIGITAL SIGNAGE MARKET FOR INSTITUTIONAL, BY TYPE, 2022-2025 (USD MILLION)
- TABLE 41 HARDWARE: DIGITAL SIGNAGE MARKET FOR INSTITUTIONAL, BY TYPE, 2026-2032 (USD MILLION)
- TABLE 42 HARDWARE: DIGITAL SIGNAGE MARKET, BY REGION, 2022-2025 (USD MILLION)
- TABLE 43 HARDWARE: DIGITAL SIGNAGE MARKET, BY REGION, 2026-2032 (USD MILLION)
- TABLE 44 SOFTWARE: DIGITAL SIGNAGE MARKET, BY TYPE, 2022-2025 (USD MILLION)
- TABLE 45 SOFTWARE: DIGITAL SIGNAGE MARKET, BY TYPE, 2026-2032 (USD MILLION)
- TABLE 46 SOFTWARE: DIGITAL SIGNAGE MARKET, BY END USE, 2022-2025 (USD MILLION)
- TABLE 47 SOFTWARE: DIGITAL SIGNAGE MARKET, BY END USE, 2026-2032 (USD MILLION)
- TABLE 48 SOFTWARE: DIGITAL SIGNAGE MARKET FOR COMMERCIAL, BY TYPE, 2022-2025 (USD MILLION)
- TABLE 49 SOFTWARE: DIGITAL SIGNAGE MARKET FOR COMMERCIAL, BY TYPE, 2026-2032 (USD MILLION)
- TABLE 50 SOFTWARE: DIGITAL SIGNAGE MARKET FOR INFRASTRUCTURAL, BY TYPE, 2022-2025 (USD MILLION)
- TABLE 51 SOFTWARE: DIGITAL SIGNAGE MARKET FOR INFRASTRUCTURAL, BY TYPE, 2026-2032 (USD MILLION)
- TABLE 52 SOFTWARE: DIGITAL SIGNAGE MARKET FOR INSTITUTIONAL, BY TYPE, 2022-2025 (USD MILLION)
- TABLE 53 SOFTWARE: DIGITAL SIGNAGE MARKET FOR INSTITUTIONAL, BY TYPE, 2026-2032 (USD MILLION)
- TABLE 54 SOFTWARE: DIGITAL SIGNAGE MARKET, BY REGION, 2022-2025 (USD MILLION)
- TABLE 55 SOFTWARE: DIGITAL SIGNAGE MARKET, BY REGION, 2026-2032 (USD MILLION)
- TABLE 56 SERVICES: DIGITAL SIGNAGE MARKET, BY TYPE, 2022-2025 (USD MILLION)
- TABLE 57 SERVICES: DIGITAL SIGNAGE MARKET, BY TYPE, 2026-2032 (USD MILLION)
- TABLE 58 SERVICES: DIGITAL SIGNAGE MARKET, BY END USE, 2022-2025 (USD MILLION)
- TABLE 59 SERVICES: DIGITAL SIGNAGE MARKET, BY END USE, 2026-2032 (USD MILLION)
- TABLE 60 SERVICES: DIGITAL SIGNAGE MARKET FOR COMMERCIAL, BY TYPE, 2022-2025 (USD MILLION)
- TABLE 61 SERVICES: DIGITAL SIGNAGE MARKET FOR COMMERCIAL, BY TYPE, 2026-2032 (USD MILLION)
- TABLE 62 SERVICES: DIGITAL SIGNAGE MARKET FOR INFRASTRUCTURAL, BY TYPE, 2022-2025 (USD MILLION)
- TABLE 63 SERVICES: DIGITAL SIGNAGE MARKET FOR INFRASTRUCTURAL, BY TYPE, 2026-2032 (USD MILLION)
- TABLE 64 SERVICES: DIGITAL SIGNAGE MARKET FOR INSTITUTIONAL, BY TYPE, 2022-2025 (USD MILLION)
- TABLE 65 SERVICES: DIGITAL SIGNAGE MARKET FOR INSTITUTIONAL, BY TYPE, 2026-2032 (USD MILLION)
- TABLE 66 SERVICES: DIGITAL SIGNAGE MARKET, BY REGION, 2022-2025 (USD MILLION)
- TABLE 67 SERVICES: DIGITAL SIGNAGE MARKET, BY REGION, 2026-2032 (USD MILLION)
- TABLE 68 DIGITAL SIGNAGE MARKET, BY PRODUCT TYPE, 2022-2025 (USD MILLION)
- TABLE 69 DIGITAL SIGNAGE MARKET, BY PRODUCT TYPE, 2026-2032 (USD MILLION)
- TABLE 70 DIGITAL SIGNAGE MARKET, BY PRODUCT TYPE, 2022-2025 (THOUSAND UNITS)
- TABLE 71 DIGITAL SIGNAGE MARKET, BY PRODUCT TYPE, 2026-2032 (THOUSAND UNITS)
- TABLE 72 DIGITAL SIGNAGE MARKET, BY INSTALLATION LOCATION, 2022-2025 (USD MILLION)
- TABLE 73 DIGITAL SIGNAGE MARKET, BY INSTALLATION LOCATION, 2026-2032 (USD MILLION)
- TABLE 74 INDOOR: DIGITAL SIGNAGE MARKET, BY END USE, 2022-2025 (USD MILLION)
- TABLE 75 INDOOR: DIGITAL SIGNAGE MARKET, BY END USE, 2026-2032 (USD MILLION)
- TABLE 76 OUTDOOR: DIGITAL SIGNAGE MARKET, BY END USE, 2022-2025 (USD MILLION)
- TABLE 77 OUTDOOR: DIGITAL SIGNAGE MARKET, BY END USE, 2026-2032 (USD MILLION)
- TABLE 78 DIGITAL SIGNAGE MARKET, BY APPLICATION, 2022-2025 (USD MILLION)
- TABLE 79 DIGITAL SIGNAGE MARKET, BY APPLICATION, 2026-2032 (USD MILLION)
- TABLE 80 DIGITAL SIGNAGE MARKET, BY END USE, 2022-2025 (USD MILLION)
- TABLE 81 DIGITAL SIGNAGE MARKET, BY END USE, 2026-2032 (USD MILLION)
- TABLE 82 COMMERCIAL: DIGITAL SIGNAGE MARKET, BY TYPE, 2022-2025 (USD MILLION)
- TABLE 83 COMMERCIAL: DIGITAL SIGNAGE MARKET, BY TYPE, 2026-2032 (USD MILLION)
- TABLE 84 COMMERCIAL: DIGITAL SIGNAGE MARKET, BY OFFERING, 2022-2025 (USD MILLION)
- TABLE 85 COMMERCIAL: DIGITAL SIGNAGE MARKET, BY OFFERING, 2026-2032 (USD MILLION)
- TABLE 86 COMMERCIAL: DIGITAL SIGNAGE MARKET, BY REGION, 2022-2025 (USD MILLION)
- TABLE 87 COMMERCIAL: DIGITAL SIGNAGE MARKET, BY REGION, 2026-2032 (USD MILLION)
- TABLE 88 RETAIL: DIGITAL SIGNAGE MARKET, BY INSTALLATION LOCATION, 2022-2025 (USD MILLION)
- TABLE 89 RETAIL: DIGITAL SIGNAGE MARKET, BY INSTALLATION LOCATION, 2026-2032 (USD MILLION)
- TABLE 90 RETAIL: DIGITAL SIGNAGE MARKET, BY REGION, 2022-2025 (USD MILLION)
- TABLE 91 RETAIL: DIGITAL SIGNAGE MARKET, BY REGION, 2026-2032 (USD MILLION)
- TABLE 92 RETAIL: DIGITAL SIGNAGE MARKET, BY OFFERING, 2022-2025 (USD MILLION)
- TABLE 93 RETAIL: DIGITAL SIGNAGE MARKET, BY OFFERING, 2026-2032 (USD MILLION)
- TABLE 94 CORPORATE OFFICES: DIGITAL SIGNAGE MARKET, BY INSTALLATION LOCATION, 2022-2025 (USD MILLION)
- TABLE 95 CORPORATE OFFICES: DIGITAL SIGNAGE MARKET, BY INSTALLATION LOCATION, 2026-2032 (USD MILLION)
- TABLE 96 CORPORATE OFFICES: DIGITAL SIGNAGE MARKET, BY REGION, 2022-2025 (USD MILLION)
- TABLE 97 CORPORATE OFFICES: DIGITAL SIGNAGE MARKET, BY REGION, 2026-2032 (USD MILLION)
- TABLE 98 CORPORATE OFFICES: DIGITAL SIGNAGE MARKET, BY OFFERING, 2022-2025 (USD MILLION)
- TABLE 99 CORPORATE OFFICES: DIGITAL SIGNAGE MARKET, BY OFFERING, 2026-2032 (USD MILLION)
- TABLE 100 HEALTHCARE FACILITIES: DIGITAL SIGNAGE MARKET, BY INSTALLATION LOCATION, 2022-2025 (USD MILLION)
- TABLE 101 HEALTHCARE FACILITIES: DIGITAL SIGNAGE MARKET, BY INSTALLATION LOCATION, 2026-2032 (USD MILLION)
- TABLE 102 HEALTHCARE FACILITIES: DIGITAL SIGNAGE MARKET, BY REGION, 2022-2025 (USD MILLION)
- TABLE 103 HEALTHCARE FACILITIES: DIGITAL SIGNAGE MARKET, BY REGION, 2026-2032 (USD MILLION)
- TABLE 104 HEALTHCARE FACILITIES: DIGITAL SIGNAGE MARKET, BY OFFERING, 2022-2025 (USD MILLION)
- TABLE 105 HEALTHCARE FACILITIES: DIGITAL SIGNAGE MARKET, BY OFFERING, 2026-2032 (USD MILLION)
- TABLE 106 HOSPITALITY FACILITIES & RESTAURANTS: DIGITAL SIGNAGE MARKET, BY INSTALLATION LOCATION, 2022-2025 (USD MILLION)
- TABLE 107 HOSPITALITY FACILITIES & RESTAURANTS: DIGITAL SIGNAGE MARKET, BY INSTALLATION LOCATION, 2026-2032 (USD MILLION)
- TABLE 108 HOSPITALITY FACILITIES & RESTAURANTS: DIGITAL SIGNAGE MARKET, BY REGION, 2022-2025 (USD MILLION)
- TABLE 109 HOSPITALITY FACILITIES & RESTAURANTS: DIGITAL SIGNAGE MARKET, BY REGION, 2026-2032 (USD MILLION)
- TABLE 110 HOSPITALITY FACILITIES & RESTAURANTS: DIGITAL SIGNAGE MARKET, BY OFFERING, 2022-2025 (USD MILLION)
- TABLE 111 HOSPITALITY FACILITIES & RESTAURANTS: DIGITAL SIGNAGE MARKET, BY OFFERING, 2026-2032 (USD MILLION)
- TABLE 112 INFRASTRUCTURAL: DIGITAL SIGNAGE MARKET, BY TYPE, 2022-2025 (USD MILLION)
- TABLE 113 INFRASTRUCTURAL: DIGITAL SIGNAGE MARKET, BY TYPE, 2026-2032 (USD MILLION)
- TABLE 114 INFRASTRUCTURAL: DIGITAL SIGNAGE MARKET, BY OFFERING, 2022-2025 (USD MILLION)
- TABLE 115 INFRASTRUCTURAL: DIGITAL SIGNAGE MARKET, BY OFFERING, 2026-2032 (USD MILLION)
- TABLE 116 INFRASTRUCTURAL: DIGITAL SIGNAGE MARKET, BY REGION, 2022-2025 (USD MILLION)
- TABLE 117 INFRASTRUCTURAL: DIGITAL SIGNAGE MARKET, BY REGION, 2026-2032 (USD MILLION)
- TABLE 118 TRANSPORTATION HUBS & PUBLIC PLACES: DIGITAL SIGNAGE MARKET, BY INSTALLATION LOCATION, 2022-2025 (USD MILLION)
- TABLE 119 TRANSPORTATION HUBS & PUBLIC PLACES: DIGITAL SIGNAGE MARKET, BY INSTALLATION LOCATION, 2026-2032 (USD MILLION)
- TABLE 120 TRANSPORTATION HUBS & PUBLIC PLACES: DIGITAL SIGNAGE MARKET, BY REGION, 2022-2025 (USD MILLION)
- TABLE 121 TRANSPORTATION HUBS & PUBLIC PLACES: DIGITAL SIGNAGE MARKET, BY REGION, 2026-2032 (USD MILLION)
- TABLE 122 TRANSPORTATION HUBS & PUBLIC PLACES: DIGITAL SIGNAGE MARKET, BY OFFERING, 2022-2025 (USD MILLION)
- TABLE 123 TRANSPORTATION HUBS & PUBLIC PLACES: DIGITAL SIGNAGE MARKET, BY OFFERING, 2026-2032 (USD MILLION)
- TABLE 124 SPORTS & ENTERTAINMENT VENUES: DIGITAL SIGNAGE MARKET, BY INSTALLATION LOCATION, 2022-2025 (USD MILLION)
- TABLE 125 SPORTS & ENTERTAINMENT VENUES: DIGITAL SIGNAGE MARKET, BY INSTALLATION LOCATION, 2026-2032 (USD MILLION)
- TABLE 126 SPORTS & ENTERTAINMENT VENUES: DIGITAL SIGNAGE MARKET, BY REGION, 2022-2025 (USD MILLION)
- TABLE 127 SPORTS & ENTERTAINMENT VENUES: DIGITAL SIGNAGE MARKET, BY REGION, 2026-2032 (USD MILLION)
- TABLE 128 SPORTS & ENTERTAINMENT VENUES: DIGITAL SIGNAGE MARKET, BY OFFERING, 2022-2025 (USD MILLION)
- TABLE 129 SPORTS & ENTERTAINMENT VENUES: DIGITAL SIGNAGE MARKET, BY OFFERING, 2026-2032 (USD MILLION)
- TABLE 130 INSTITUTIONAL: DIGITAL SIGNAGE MARKET, BY TYPE, 2022-2025 (USD MILLION)
- TABLE 131 INSTITUTIONAL: DIGITAL SIGNAGE MARKET, BY TYPE, 2026-2032 (USD MILLION)
- TABLE 132 INSTITUTIONAL: DIGITAL SIGNAGE MARKET, BY OFFERING, 2022-2025 (USD MILLION)
- TABLE 133 INSTITUTIONAL: DIGITAL SIGNAGE MARKET, BY OFFERING, 2026-2032 (USD MILLION)
- TABLE 134 INSTITUTIONAL: DIGITAL SIGNAGE MARKET, BY REGION, 2022-2025 (USD MILLION)
- TABLE 135 INSTITUTIONAL: DIGITAL SIGNAGE MARKET, BY REGION, 2026-2032 (USD MILLION)
- TABLE 136 GOVERNMENT AND PUBLIC SECTOR INSTITUTIONS: DIGITAL SIGNAGE MARKET, BY INSTALLATION LOCATION, 2022-2025 (USD MILLION)
- TABLE 137 GOVERNMENT AND PUBLIC SECTOR INSTITUTIONS: DIGITAL SIGNAGE MARKET, BY INSTALLATION LOCATION, 2026-2032 (USD MILLION)
- TABLE 138 GOVERNMENT AND PUBLIC SECTOR INSTITUTIONS: DIGITAL SIGNAGE MARKET, BY REGION, 2022-2025 (USD MILLION)
- TABLE 139 GOVERNMENT AND PUBLIC SECTOR INSTITUTIONS: DIGITAL SIGNAGE MARKET, BY REGION, 2026-2032 (USD MILLION)
- TABLE 140 GOVERNMENT AND PUBLIC SECTOR INSTITUTIONS: DIGITAL SIGNAGE MARKET, BY OFFERING, 2022-2025 (USD MILLION)
- TABLE 141 GOVERNMENT AND PUBLIC SECTOR INSTITUTIONS: DIGITAL SIGNAGE MARKET, BY OFFERING, 2026-2032 (USD MILLION)
- TABLE 142 BFSI INSTITUTIONS: DIGITAL SIGNAGE MARKET, BY INSTALLATION LOCATION, 2022-2025 (USD MILLION)
- TABLE 143 BFSI INSTITUTIONS: DIGITAL SIGNAGE MARKET, BY INSTALLATION LOCATION, 2026-2032 (USD MILLION)
- TABLE 144 BFSI INSTITUTIONS: DIGITAL SIGNAGE MARKET, BY REGION, 2022-2025 (USD MILLION)
- TABLE 145 BFSI INSTITUTIONS: DIGITAL SIGNAGE MARKET, BY REGION, 2026-2032 (USD MILLION)
- TABLE 146 BFSI INSTITUTIONS: DIGITAL SIGNAGE MARKET, BY OFFERING, 2022-2025 (USD MILLION)
- TABLE 147 BFSI INSTITUTIONS: DIGITAL SIGNAGE MARKET, BY OFFERING, 2026-2032 (USD MILLION)
- TABLE 148 EDUCATIONAL INSTITUTIONS: DIGITAL SIGNAGE MARKET, BY INSTALLATION LOCATION, 2022-2025 (USD MILLION)
- TABLE 149 EDUCATIONAL INSTITUTIONS: DIGITAL SIGNAGE MARKET, BY INSTALLATION LOCATION, 2026-2032 (USD MILLION)
- TABLE 150 EDUCATIONAL INSTITUTIONS: DIGITAL SIGNAGE MARKET, BY REGION, 2022-2025 (USD MILLION)
- TABLE 151 EDUCATIONAL INSTITUTIONS: DIGITAL SIGNAGE MARKET, BY REGION, 2026-2032 (USD MILLION)
- TABLE 152 EDUCATIONAL INSTITUTIONS: DIGITAL SIGNAGE MARKET, BY OFFERING, 2022-2025 (USD MILLION)
- TABLE 153 EDUCATIONAL INSTITUTIONS: DIGITAL SIGNAGE MARKET, BY OFFERING, 2026-2032 (USD MILLION)
- TABLE 154 INDUSTRIAL: DIGITAL SIGNAGE MARKET, BY INSTALLATION LOCATION, 2022-2025 (USD MILLION)
- TABLE 155 INDUSTRIAL: DIGITAL SIGNAGE MARKET, BY INSTALLATION LOCATION, 2026-2032 (USD MILLION)
- TABLE 156 INDUSTRIAL: DIGITAL SIGNAGE MARKET, BY REGION, 2022-2025 (USD MILLION)
- TABLE 157 INDUSTRIAL: DIGITAL SIGNAGE MARKET, BY REGION, 2026-2032 (USD MILLION)
- TABLE 158 INDUSTRIAL: DIGITAL SIGNAGE MARKET, BY OFFERING, 2022-2025 (USD MILLION)
- TABLE 159 INDUSTRIAL: DIGITAL SIGNAGE MARKET, BY OFFERING, 2026-2032 (USD MILLION)
- TABLE 160 DIGITAL SIGNAGE MARKET, BY REGION, 2022-2025 (USD MILLION)
- TABLE 161 DIGITAL SIGNAGE MARKET, BY REGION, 2026-2032 (USD MILLION)
- TABLE 162 NORTH AMERICA: DIGITAL SIGNAGE MARKET, BY END USE, 2022-2025 (USD MILLION)
- TABLE 163 NORTH AMERICA: DIGITAL SIGNAGE MARKET, BY END USE, 2026-2032 (USD MILLION)
- TABLE 164 NORTH AMERICA: DIGITAL SIGNAGE MARKET, BY COUNTRY, 2022-2025 (USD MILLION)
- TABLE 165 NORTH AMERICA: DIGITAL SIGNAGE MARKET, BY COUNTRY, 2026-2032 (USD MILLION)
- TABLE 166 EUROPE: DIGITAL SIGNAGE MARKET, BY END USE, 2022-2025 (USD MILLION)
- TABLE 167 EUROPE: DIGITAL SIGNAGE MARKET, BY END USE, 2026-2032 (USD MILLION)
- TABLE 168 EUROPE: DIGITAL SIGNAGE MARKET, BY COUNTRY, 2022-2025 (USD MILLION)
- TABLE 169 EUROPE: DIGITAL SIGNAGE MARKET, BY COUNTRY, 2026-2032 (USD MILLION)
- TABLE 170 ASIA PACIFIC: DIGITAL SIGNAGE MARKET, BY END USE, 2022-2025 (USD MILLION)
- TABLE 171 ASIA PACIFIC: DIGITAL SIGNAGE MARKET, BY END USE, 2026-2032 (USD MILLION)
- TABLE 172 ASIA PACIFIC: DIGITAL SIGNAGE MARKET, BY COUNTRY, 2022-2025 (USD MILLION)
- TABLE 173 ASIA PACIFIC: DIGITAL SIGNAGE MARKET, BY COUNTRY, 2026-2032 (USD MILLION)
- TABLE 174 REST OF THE WORLD: DIGITAL SIGNAGE MARKET, BY END USE, 2022-2025 (USD MILLION)
- TABLE 175 REST OF THE WORLD: DIGITAL SIGNAGE MARKET, BY END USE, 2026-2032 (USD MILLION)
- TABLE 176 REST OF THE WORLD: DIGITAL SIGNAGE MARKET, BY REGION, 2022-2025 (USD MILLION)
- TABLE 177 REST OF THE WORLD: DIGITAL SIGNAGE MARKET, BY REGION, 2026-2032 (USD MILLION)
- TABLE 178 MIDDLE EAST: DIGITAL SIGNAGE MARKET, BY COUNTRY, 2022-2025 (USD MILLION)
- TABLE 179 MIDDLE EAST: DIGITAL SIGNAGE MARKET, BY COUNTRY, 2026-2032 (USD MILLION)
- TABLE 180 AFRICA: DIGITAL SIGNAGE MARKET, BY COUNTRY, 2022-2025 (USD MILLION)
- TABLE 181 AFRICA: DIGITAL SIGNAGE MARKET, BY COUNTRY, 2026-2032 (USD MILLION)
- TABLE 182 SOUTH AMERICA: DIGITAL SIGNAGE MARKET, BY COUNTRY, 2022-2025 (USD MILLION)
- TABLE 183 SOUTH AMERICA: DIGITAL SIGNAGE MARKET, BY COUNTRY, 2026-2032 (USD MILLION)
- TABLE 184 DIGITAL SIGNAGE MARKET: OVERVIEW OF STRATEGIES ADOPTED BY KEY PLAYERS, JANUARY 2021-JANUARY 2026
- TABLE 185 DIGITAL SIGNAGE MARKET: DEGREE OF COMPETITION, 2025
- TABLE 186 DIGITAL SIGNAGE MARKET: REGION FOOTPRINT
- TABLE 187 DIGITAL SIGNAGE MARKET: OFFERING FOOTPRINT
- TABLE 188 DIGITAL SIGNAGE MARKET: PRODUCT TYPE FOOTPRINT
- TABLE 189 DIGITAL SIGNAGE MARKET: INSTALLATION LOCATION FOOTPRINT
- TABLE 190 DIGITAL SIGNAGE MARKET: APPLICATION FOOTPRINT
- TABLE 191 DIGITAL SIGNAGE MARKET: END USE FOOTPRINT
- TABLE 192 DIGITAL SIGNAGE MARKET: DETAILED LIST OF KEY STARTUPS/SMES
- TABLE 193 DIGITAL SIGNAGE MARKET: COMPETITIVE BENCHMARKING OF STARTUPS/SMES
- TABLE 194 DIGITAL SIGNAGE MARKET: PRODUCT LAUNCHES, JANUARY 2021-JANUARY 2026
- TABLE 195 DIGITAL SIGNAGE MARKET: DEALS, JANUARY 2021-JANUARY 2026
- TABLE 196 SAMSUNG: COMPANY OVERVIEW
- TABLE 197 SAMSUNG: PRODUCTS/SOLUTIONS/SERVICES OFFERED
- TABLE 198 SAMSUNG: PRODUCT LAUNCHES
- TABLE 199 SAMSUNG: DEALS
- TABLE 200 LG ELECTRONICS: COMPANY OVERVIEW
- TABLE 201 LG ELECTRONICS: PRODUCTS/SOLUTIONS/SERVICES OFFERED
- TABLE 202 LG ELECTRONICS: PRODUCT LAUNCHES
- TABLE 203 LG ELECTRONICS: DEALS
- TABLE 204 SHARP CORPORATION: COMPANY OVERVIEW
- TABLE 205 SHARP CORPORATION: PRODUCTS/SOLUTIONS/SERVICES OFFERED
- TABLE 206 SHARP CORPORATION: PRODUCT LAUNCHES
- TABLE 207 SHARP CORPORATION: DEALS
- TABLE 208 LEYARD: COMPANY OVERVIEW
- TABLE 209 LEYARD: PRODUCTS/SOLUTIONS/SERVICES OFFERED
- TABLE 210 LEYARD: PRODUCT LAUNCHES
- TABLE 211 SONY GROUP CORPORATION: COMPANY OVERVIEW
- TABLE 212 SONY GROUP CORPORATION: PRODUCTS/SOLUTIONS/SERVICES OFFERED
- TABLE 213 SONY GROUP CORPORATION: PRODUCT LAUNCHES
- TABLE 214 SONY GROUP CORPORATION: DEALS
- TABLE 215 BARCO: COMPANY OVERVIEW
- TABLE 216 BARCO: PRODUCTS/SOLUTIONS/SERVICES OFFERED
- TABLE 217 BARCO: PRODUCT LAUNCHES
- TABLE 218 BARCO: DEALS
- TABLE 219 PANASONIC HOLDINGS CORPORATION: COMPANY OVERVIEW
- TABLE 220 PANASONIC HOLDINGS CORPORATION: PRODUCTS/SOLUTIONS/SERVICES OFFERED
- TABLE 221 PANASONIC HOLDINGS CORPORATION: PRODUCT LAUNCHES
- TABLE 222 AUO CORPORATION: COMPANY OVERVIEW
- TABLE 223 AUO CORPORATION: PRODUCTS/SOLUTIONS/SERVICES OFFERED
- TABLE 224 AUO CORPORATION: PRODUCT LAUNCHES
- TABLE 225 AUO CORPORATION: DEALS
- TABLE 226 AUO CORPORATION: OTHERS
- TABLE 227 DAKTRONICS: COMPANY OVERVIEW
- TABLE 228 DAKTRONICS: PRODUCTS/SOLUTIONS/SERVICES OFFERED
- TABLE 229 DAKTRONICS: PRODUCT LAUNCHES
- TABLE 230 DAKTRONICS: DEALS
- TABLE 231 BRIGHTSIGN LLC: COMPANY OVERVIEW
- TABLE 232 BRIGHTSIGN LLC: PRODUCTS/SOLUTIONS/SERVICES OFFERED
- TABLE 233 BRIGHTSIGN LLC: PRODUCT LAUNCHES
- TABLE 234 BRIGHTSIGN LLC: DEALS
- TABLE 235 STRATACACHE: BUSINESS OVERVIEW
- TABLE 236 BENQ: BUSINESS OVERVIEW
- TABLE 237 INTUIFACE: BUSINESS OVERVIEW
- TABLE 238 DELTA ELECTRONICS, INC.: BUSINESS OVERVIEW
- TABLE 239 BROADSIGN INTERNATIONAL, LLC: BUSINESS OVERVIEW
- TABLE 240 CHRISTIE DIGITAL SYSTEMS USA, INC.: BUSINESS OVERVIEW
- TABLE 241 CISCO SYSTEMS, INC.: BUSINESS OVERVIEW
- TABLE 242 AESYS S.P.A.: BUSINESS OVERVIEW
- TABLE 243 TATTILE S.R.L.: BUSINESS OVERVIEW
- TABLE 244 PPDS: BUSINESS OVERVIEW
- TABLE 245 NAVORI LABS: BUSINESS OVERVIEW
- TABLE 246 VIEWSONIC: BUSINESS OVERVIEW
- TABLE 247 22 MILES: BUSINESS OVERVIEW
- TABLE 248 FLIPNODE LLC: BUSINESS OVERVIEW
- TABLE 249 SPECTRIO LLC: BUSINESS OVERVIEW
- TABLE 250 DIGITAL SIGNAGE MARKET: RISK ASSESSMENT
List of Figures
- FIGURE 1 DIGITAL SIGNAGE MARKET SEGMENTATION AND REGIONAL SCOPE
- FIGURE 2 KEY INSIGHTS AND MARKET HIGHLIGHTS
- FIGURE 3 GLOBAL DIGITAL SIGNAGE MARKET, 2022-2032
- FIGURE 4 MAJOR STRATEGIES ADOPTED BY KEY PLAYERS IN DIGITAL SIGNAGE MARKET (2021-2025)
- FIGURE 5 DISRUPTIONS IMPACTING GROWTH OF DIGITAL SIGNAGE MARKET
- FIGURE 6 HIGH-GROWTH SEGMENTS IN DIGITAL SIGNAGE MARKET, 2025
- FIGURE 7 ASIA PACIFIC TO REGISTER HIGHEST GROWTH RATE DURING FORECAST PERIOD
- FIGURE 8 RISING ADOPTION OF SMART RETAIL, DIGITAL ADVERTISING, AND SMART CITY INFRASTRUCTURE TO DRIVE MARKET
- FIGURE 9 HARDWARE SEGMENT TO ACCOUNT FOR LARGEST MARKET SHARE IN 2032
- FIGURE 10 STANDALONE DISPLAYS TO DOMINATE MARKET IN 2026
- FIGURE 11 INDOOR SEGMENT TO DOMINATE MARKET FROM 2O26 TO 2032
- FIGURE 12 COMMERCIAL SEGMENT TO DOMINATE MARKET DURING FORECAST PERIOD
- FIGURE 13 ASIA PACIFIC TO ACCOUNT FOR LARGEST MARKET SHARE IN 2032
- FIGURE 14 INDIA TO REGISTER HIGHEST CAGR IN DIGITAL SIGNAGE MARKET DURING FORECAST PERIOD
- FIGURE 15 DIGITAL SIGNAGE MARKET: DRIVERS, RESTRAINTS, OPPORTUNITIES, AND CHALLENGES
- FIGURE 16 IMPACT ANALYSIS: DRIVERS
- FIGURE 17 IMPACT ANALYSIS: RESTRAINTS
- FIGURE 18 IMPACT ANALYSIS: OPPORTUNITIES
- FIGURE 19 IMPACT ANALYSIS: CHALLENGES
- FIGURE 20 DIGITAL SIGNAGE MARKET: PORTER'S FIVE FORCES ANALYSIS
- FIGURE 21 DIGITAL SIGNAGE MARKET: VALUE CHAIN ANALYSIS
- FIGURE 22 DIGITAL SIGNAGE MARKET: ECOSYSTEM ANALYSIS
- FIGURE 23 AVERAGE SELLING PRICE OF VIDEO WALLS OFFERED BY KEY PLAYERS, 2024
- FIGURE 24 AVERAGE SELLING PRICE OF SIGNAGE & INFORMATION DISPLAYS OFFERED BY KEY PLAYERS, 2024
- FIGURE 25 AVERAGE SELLING PRICE OF VIDEO WALLS, BY REGION, 2021-2024
- FIGURE 26 AVERAGE SELLING PRICE OF SIGNAGE & INFORMATION DISPLAYS, BY REGION, 2021-2024
- FIGURE 27 IMPORT DATA FOR HS CODE 852859-COMPLIANT PRODUCTS FOR TOP FIVE COUNTRIES, 2021-2024
- FIGURE 28 EXPORT DATA FOR HS CODE 852859-COMPLIANT PRODUCTS FOR TOP FIVE COUNTRIES, 2021-2024
- FIGURE 29 TRENDS/DISRUPTIONS INFLUENCING CUSTOMER BUSINESS
- FIGURE 30 INVESTMENT AND FUNDING SCENARIO, 2021-2024
- FIGURE 31 PATENTS APPLIED AND GRANTED, 2015-2024
- FIGURE 32 DECISION-MAKING FACTORS IN DIGITAL SIGNAGE MARKET
- FIGURE 33 INFLUENCE OF STAKEHOLDERS ON BUYING PROCESS FOR TOP THREE END USES
- FIGURE 34 KEY BUYING CRITERIA FOR TOP THREE END USES
- FIGURE 35 ADOPTION BARRIERS AND INTERNAL CHALLENGES
- FIGURE 36 HARDWARE SEGMENT TO HOLD LARGEST MARKET SHARE DURING FORECAST PERIOD
- FIGURE 37 STANDALONE DISPLAYS SEGMENT TO HOLD LARGER MARKET SHARE DURING FORECAST PERIOD
- FIGURE 38 INDOOR SEGMENT TO HOLD LARGER MARKET SHARE DURING FORECAST PERIOD
- FIGURE 39 ADVERTISING & PROMOTION SEGMENT TO ACCOUNT FOR LARGEST MARKET SHARE DURING FORECAST PERIOD
- FIGURE 40 COMMERCIAL SEGMENT TO HOLD LARGEST MARKET SHARE DURING FORECAST PERIOD
- FIGURE 41 ASIA PACIFIC TO LEAD DIGITAL SIGNAGE MARKET DURING FORECAST PERIOD
- FIGURE 42 NORTH AMERICA: DIGITAL SIGNAGE MARKET SNAPSHOT
- FIGURE 43 EUROPE: DIGITAL SIGNAGE MARKET SNAPSHOT
- FIGURE 44 ASIA PACIFIC: DIGITAL SIGNAGE MARKET SNAPSHOT
- FIGURE 45 DIGITAL SIGNAGE MARKET: REVENUE ANALYSIS OF KEY PLAYERS, 2021-2024
- FIGURE 46 MARKET SHARE ANALYSIS OF COMPANIES OFFERING DIGITAL SIGNAGE, 2025
- FIGURE 47 BRAND/PRODUCT COMPARISON
- FIGURE 48 DIGITAL SIGNAGE MARKET: COMPANY EVALUATION MATRIX (KEY PLAYERS), 2025
- FIGURE 49 DIGITAL SIGNAGE MARKET: COMPANY FOOTPRINT
- FIGURE 50 DIGITAL SIGNAGE MARKET: COMPANY EVALUATION MATRIX (STARTUPS/SMES), 2025
- FIGURE 51 COMPANY VALUATION, 2025
- FIGURE 52 FINANCIAL METRICS (EV/EBITDA), 2025
- FIGURE 53 SAMSUNG: COMPANY SNAPSHOT
- FIGURE 54 LG ELECTRONICS: COMPANY SNAPSHOT
- FIGURE 55 SHARP CORPORATION: COMPANY SNAPSHOT
- FIGURE 56 LEYARD: COMPANY SNAPSHOT
- FIGURE 57 SONY GROUP CORPORATION: COMPANY SNAPSHOT
- FIGURE 58 BARCO: COMPANY SNAPSHOT
- FIGURE 59 PANASONIC HOLDINGS CORPORATION: COMPANY SNAPSHOT
- FIGURE 60 AUO CORPORATION: COMPANY SNAPSHOT
- FIGURE 61 DAKTRONICS: COMPANY SNAPSHOT
- FIGURE 62 DIGITAL SIGNAGE MARKET: RESEARCH DESIGN
- FIGURE 63 DIGITAL SIGNAGE MARKET: BOTTOM-UP APPROACH
- FIGURE 64 DIGITAL SIGNAGE MARKET: TOP-DOWN APPROACH
- FIGURE 65 DIGITAL SIGNAGE MARKET SIZE ESTIMATION METHODOLOGY (DEMAND SIDE)
- FIGURE 66 DIGITAL SIGNAGE MARKET SIZE ESTIMATION METHODOLOGY (SUPPLY SIDE)
- FIGURE 67 DIGITAL SIGNAGE MARKET: DATA TRIANGULATION
- FIGURE 68 DIGITAL SIGNAGE MARKET: RESEARCH ASSUMPTIONS
 數位相機顯示器市場報告:趨勢、預測和競爭分析(至2035年)
 2026年全球數位電子看板市場報告
 全球智慧指示牌市場規模、佔有率、趨勢和成長分析報告(2026-2034)
 數位看板市場:依產品、組件(硬體、服務)、應用和行業劃分 - 至2036年的全球預測
 LED數位記分板市場分析及預測(至2035年):依類型、產品類型、服務、技術、組件、應用、形狀、材質、最終用戶、安裝類型分類數位電子看板市場分析及預測(至2035年):依類型、產品、服務、技術、組件、應用、形式、部署方式、最終用戶及安裝類型分類醫療數位電子看板市場分析及預測(至2035年):按類型、產品、服務、技術、組件、應用、部署模式、最終用戶、功能和安裝類型分類
 數位電子看板:市場佔有率分析、產業趨勢與統計、成長預測(2026-2031)
 數位電子看板市場規模、佔有率、趨勢及預測(按類型、組件、技術、應用、位置、規模和地區分類),2026-2034年2026年全球數位側窗顯示器市場報告