


 |
市場調查報告書
商品編碼
1808080
全球園藝塑膠市場(按塑膠類型、成分、應用和地區分類)- 2030 年預測Garden Plastics Market by Plastic Type (Commodity Plastics, Engineering Plastics, Performance Plastics ), Application, Composition, and Region - Global Forecast to 2030 |
||||||
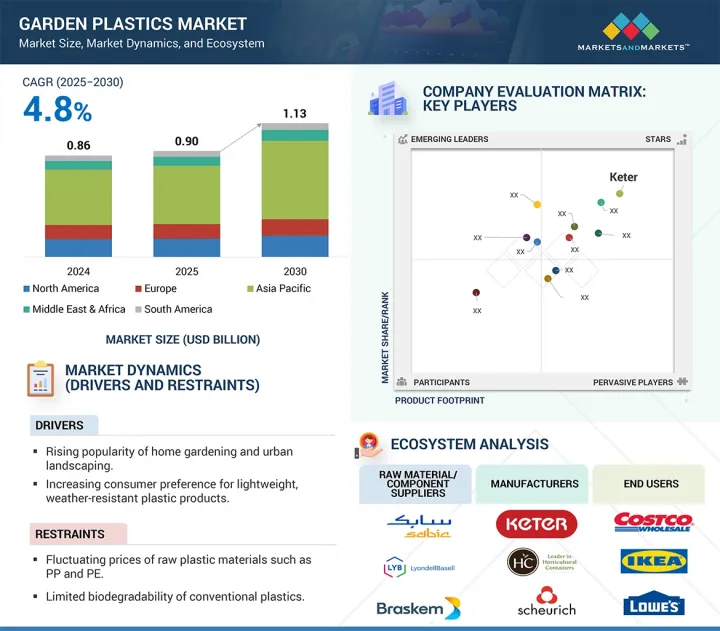
全球園藝塑膠市場預計將從 2025 年的 9 億美元成長到 2030 年的 11.3 億美元,2025 年至 2030 年的複合年成長率為 4.8%。
| 調查範圍 | |
|---|---|
| 調查年份 | 2023-2030 |
| 基準年 | 2024 |
| 預測期 | 2025-2030 |
| 對價單位 | 金額(百萬美元) 數量(千噸) |
| 部分 | 按塑膠類型、成分、應用和地區 |
| 目標區域 | 亞太地區、北美、歐洲、中東和非洲、南美 |
這一成長很大程度上歸功於都市區消費者以及行動不便、空間有限的人群對DIY景觀園藝和容器園藝的普遍需求。此外,塑膠花盆、柵欄、儲物箱和園藝配件(主要由聚乙烯、聚丙烯和再生塑膠製成)的供應日益增加,滿足了消費者對低維護、耐用產品的需求。塑膠配方的創新提高了抗紫外線性能、保色性和環境相容性,也正在擴大市場潛力。
再生塑膠和消費後塑膠園藝產品的日益普及、永續設計的監管壓力以及製造商採用循環經濟設計的努力也推動了市場前景的持續成長。模組化園藝系統、智慧灌溉塑膠和高階裝飾容器的需求預計也將成長,尤其是在人口老化推動園藝塑膠支出增加的新興市場。
玻璃纖維增強塑膠 (GFRP) 憑藉其強大的機械性能和持久的耐候性,成為園藝塑膠市場中成長第二快的零件類別。這些增強材料擴大應用於高階花園家具、結構花盆、柵欄板、工具手柄以及其他需要增強承重和抗衝擊性能的應用。 GFRP 提供了一個理想的解決方案,它平衡了結構強度和設計適應性,激發了消費者對兼具美觀和耐用性的園藝解決方案日益成長的興趣。 GFRP 的外觀與木材和金屬相似,但重量輕且具有出色的耐腐蝕性,非常適合高階戶外應用。設計驅動型景觀設計的趨勢,加上功能的複雜性,正在推動 GFRP 在高階產品類型中的使用量不斷增加。
非增強塑膠產業正在經歷園藝塑膠領域的顯著成長,預計在預測期內將進一步受益。非填充塑膠未經增強,不含任何添加填充材,使其成為園藝塑膠包裝供應鏈的核心組成部分。它們繼續用於製造花盆、花園邊界、戶外垃圾桶和輕質容器等產品,尤其是在結構完整性要求不高的情況下。非增強塑膠支援多種成型工藝,無需考慮複合材料配方,因此具有加工靈活性,並可節省複合材料投入。作為一種低成本的替代品,非增強塑膠填補了DIY園藝和小批量園藝的一大空白,而永續性仍然是製造商和消費者面臨的重大挑戰。它們的易用性,以及消費者擴大將非增強塑膠作為環保園藝實踐的一部分,預計也將推動非增強塑膠市場的成長。
2024 年,高密度聚苯乙烯(HDPE) 將成為園藝塑膠領域第二大可用塑膠類型。 HDPE 最顯著的優勢在於其廣泛的可用性、被某些人視為商品塑膠的作用以及其最廣泛的性能特徵。 HDPE 廣泛應用於各種園藝產品,包括花園家具、花盆、花槽和噴壺。 HDPE 兼具柔軟度、耐用性和耐候性,是生產長效園藝產品的理想材料。與原生顆粒相比,HDPE 價格低廉、易於加工且可回收。 HDPE 為園藝塑膠製造商提供了一種經濟實惠且環保的永續選擇。
到2024年,北美將成為全球園藝塑膠市場的第二大區域市場。住宅和商業園林綠化市場,尤其是美國和加拿大,對園林綠化塑膠產品的需求一直強勁。疫情過後,家居維修計劃和DIY園藝活動增加,激發了人們對永續園林綠化方法的興趣。這導致塑膠園藝產品(例如堆肥機、高架花壇、甲板箱和戶外家具)的需求增加。此外,北美消費者日益增強的環保意識,也大大激勵了區域塑膠產品製造商追求技術創新來生產塑膠產品。這導致了抗紫外線塑膠和可回收塑膠產品的使用,這些產品可以滿足消費者對環保園藝的需求。此外,大型零售品牌與國家和地區經銷商合作,建立了廣泛的產品分銷網路,使其能夠向該地區供應種類繁多的產品。
涵蓋的公司包括:Keter(以色列)、THE HC COMPANIES, INC.(美國)、Scheurich GmbH & Co. KG(德國)、Elho BV(荷蘭)、Horst Brandstatter Group(德國)、The AMES Companies(美國)、Berry Global Inc.(美國)、RKW Group(德國)、The AMES Companies(美國)、 BASF Global Inc.(美國)、RKW Group(德國)、德國)。本研究對這些園藝塑膠市場的主要企業進行了詳細的競爭分析,包括他們的公司簡介、最新發展和關鍵市場策略。
調查對象
本研究報告按塑膠類型、應用、成分和地區對園藝塑膠市場進行細分。報告涵蓋影響園藝塑膠市場成長的促進因素、限制因素、挑戰和機會的詳細資訊。該報告對主要行業參與企業進行了詳細分析,深入了解了他們的業務概況、產品供應以及與園藝塑膠市場相關的關鍵策略,例如合作夥伴關係、協議、產品發布和收購。報告中還涵蓋了園藝塑膠市場生態系統中新興企業的競爭分析。
本報告為市場領導者/新進業者提供園藝塑膠市場整體及其細分市場最接近的收益數據資訊。本報告幫助相關人員了解競爭格局,獲得洞察力,從而更好地定位業務,並規劃合適的打入市場策略。本報告幫助相關人員掌握市場脈搏,並提供關鍵市場促進因素、限制、挑戰和機會的資訊。
目錄
第1章 引言
第2章調查方法
第3章執行摘要
第4章重要考察
第5章市場概述
- 介紹
- 市場動態
- 波特五力分析
- 影響客戶業務的趨勢/中斷
- 生態系分析
- 價值鏈分析
- 監管狀況
- 貿易分析
- 定價分析
- 技術分析
- 專利分析
- 案例研究分析
- 2025-2026年主要會議和活動
- 投資金籌措場景
- 生成式人工智慧/人工智慧對園藝塑膠市場的影響
- 主要相關人員和採購標準
- 宏觀經濟分析
- 2025年美國關稅對園藝塑膠市場的影響
第6章園藝塑膠市場(依塑膠類型)
- 介紹
- 一般塑膠
- 工程與高性能塑膠
7. 園藝塑膠市場(依成分)
- 介紹
- 未填充
- 含有礦物質
- 玻璃纖維增強
- 其他
第8章園藝塑膠市場(按應用)
- 介紹
- 多部電影
- 灌溉系統
- 溫室和隧道覆蓋物
- 高架床和花園襯墊
- 盆栽和容器
- 其他
第9章園藝塑膠市場(按地區)
- 介紹
- 北美洲
- 美國
- 加拿大
- 墨西哥
- 歐洲
- 德國
- 法國
- 英國
- 義大利
- 西班牙
- 其他
- 亞太地區
- 中國
- 日本
- 印度
- 韓國
- 其他
- 中東和非洲
- 海灣合作理事會國家
- 南非
- 其他
- 南美洲
- 巴西
- 阿根廷
- 其他
第10章 競爭格局
- 概述
- 主要參與企業的策略,2022-2025
- 2024年市場佔有率分析
- 2020-2024年收益分析
- 2024 年估值與財務指標
- 產品/品牌比較
- 公司估值矩陣:2024 年關鍵參與企業
- 公司估值矩陣:Start-Ups/中小企業,2024 年
- 競爭場景
第11章:公司簡介
- 主要參與企業
- KETER
- THE HC COMPANIES, INC.
- SCHEURICH GMBH & CO. KG
- ELHO BV
- HORST BRANDSTATTER GROUP
- GRIFFON CORPORATION INC.
- BERRY GLOBAL INC.
- RKW GROUP
- BASF
- ARMANDO ALVAREZ GROUP
- 其他公司
- LANDMARK PLASTIC INC.
- EAST JORDAN PLASTICS, INC.
- CREO GROUP
- TO PLASTICS, INC.
- CAPI EUROPE
- HARSHDEEP INDIA
- EURO3PLAST SPA
- SA PLASTIKOR(PTY)LTD.
- COSMOPLAST UAE
- FINOLEX PLASSON
- KISAN
- TAIZHOU SHENGERDA PLASTIC CO., LTD.
- HOSCO INDIA
- TAIZHOU KEDI PLASTIC CO., LTD.
- VIP PLASTICS
第12章 附錄
The global garden plastics market is expected to increase from USD 0.90 billion in 2025 to USD 1.13 billion by 2030, exhibiting a compound annual growth rate (CAGR) of 4.8% between 2025 and 2030.
| Scope of the Report | |
|---|---|
| Years Considered for the Study | 2023-2030 |
| Base Year | 2024 |
| Forecast Period | 2025-2030 |
| Units Considered | Value (USD Million) Volume (KT) |
| Segments | Plastic Type, Application, Composition, and Region |
| Regions covered | Asia Pacific, North America, Europe, the Middle East & Africa, and South America |
Most of this growth is attributed to the overall increase of DIY landscaping and container gardening for urban customers and limited mobility or space. In addition, the increased availability of plastic-based planters, fencing, storage bins, and garden accessories, made mostly from polyethylene, polypropylene, and recycled plastics, are addressing consumer interests for low-maintenance and durable products. Innovations in plastic formulations that offer improved UV resistance, color retention, and eco-friendliness are widening the market potential.
The continued outlook for the market is also aided by the growing availability of recycled and post-consumer plastic garden products, regulatory pressure for sustainable design, and manufacturer's efforts to embrace circular economy design. Demand should also grow in modular garden systems, smart irrigation plastics, and premium decorative containers, especially in developed markets with aging populations that spend on high levels on garden plastics.
"Glass-fiber-reinforced plastics to be second-fastest-growing composition segment"
Glass-fiber-reinforced plastics (GFRPs) is the second-highest expanding composition segment of the garden plastics market because of their robust mechanical properties, together with their enduring resistance to weathering. These reinforced materials are increasingly used for premium garden furniture, structural planters, fencing panels, and tool handles that require enhanced load-bearing and impact resistance capabilities. The growing interest among consumers for enduring garden solutions with esthetic value positions GFRP as an ideal solution that balances structural strength and design adaptability. These materials duplicate the appearance of wood and metal yet deliver reduced weight, together with superior corrosion protection which makes them desirable for upscale outdoor applications. The design-focused landscaping trend, combined with functional complexity drives the rising use of GFRP across premium product categories.
"Unfilled plastics segment to be fastest-growing in the garden plastics market"
The unfilled plastics industry has experienced significant growth throughout the garden plastics sector and is expected to benefit further during the forecast period. Because they are not reinforced and have no added fillers, unfilled plastics are a central part of the garden plastic packaging supply chain, because unfilled plastics are cheaper, easy to process, and recyclable. Usage of unfilled plastics continues to grow in the production of plant pots, garden borders, outdoor bins, and lightweight containers, especially where low structural integrity is not an issue. Because the molding processes can be varied and there are no composite formulations to consider, unfilled plastics provide fabrication versatility and composite input savings. Sustainability will remain a major issue for manufacturers and consumers as low-cost alternatives and unfilled plastics are filling a major gap in DIY gardening and small garden horticulture. Their comparative ease of use along with the growing acceptance of consumers to consider unfilled plastics as part of their eco-friendly gardening solution will continue to expedite the market growth of unfilled plastics..
"HDPE to be second-largest plastic type in the garden plastics market"
In tree planting in 2024, high-density polyethylene (HDPE) represented the second-largest plastic type to create products available in the garden plastics sector. The most relevant benefits of HDPE are that it is extensively available, regarded by some as a commodity-type plastic, and has the widest range of performance characteristics. HDPE is used in a wider variety of garden products such as garden furniture, pots, planters, and watering cans. HDPE has a unique combination of flexibility, durability, and weathering. HDPE is very suited for garden products intended for durable lifespans. HDPE is inexpensive compared to virgin raw granules, cheap to process, easy to process, and can be recycled. HDPE is a cheap, and environmentally sustainable option for manufacturers in garden plastics.
"North America to be second-largest regional market in 2024"
In 2024, North America was the second-largest regional market in the world garden plastics market. There is a consistent, strong demand for landscaping plastic products in the residential and commercial landscaping markets, particularly in the US and Canada. After the pandemic, there was an increase in home improvement projects, Do-It-Yourself (DIY) gardening, and a growing interest in sustainable landscaping practices. As a consequence, there has also been a rise in plastic gardening products, such as composters, raised garden beds, deck boxes, and outdoor furniture. Additionally, the growing environmental awareness of North American consumers has created higher motivation for regional producers of plastic products to promote innovation to produce plastic products. Due this, they are now using UV stabilized plastic and recyclable plastic products as these products can satisfy consumer needs for eco-conscious gardening. Furthermore, the larger retail brands that align with national and regional distributors, provide an extensive product distribution network that allows extensive product reach into the region.
By Company Type: Tier 1: 22%, Tier 2: 45%, and Tier 3: 33%
By Designation: C-level Executives: 20%, Directors: 30%, and Other Designations: 50%
By Region: North America: 20%, Europe: 10%, Asia Pacific: 40%, South America: 10%, and Middle East & Africa 20%
Note: Other designations include sales, marketing, and product managers.
Tier 1: >USD 1 Billion; Tier 2: USD 500 million-1 Billion; and Tier 3: <USD 500 million
Companies Covered: Keter (Israel), THE HC COMPANIES, INC. (US), Scheurich GmbH & Co. KG (Germany), Elho B.V. (Netherlands), Horst Brandstatter Group (Germany), The AMES Companies (US), Berry Global Inc. (US), RKW Group (Germany), BASF (Germany), and Armando Alvarez Group (Span) are covered in the report. The study includes an in-depth competitive analysis of these key players in the garden plastics market, with their company profiles, recent developments, and key market strategies.
Research Coverage
This research report categorizes the garden plastics market, based on plastic type (commodity plastics and engineering plastics and performance plastics ), application (pots & containers, irrigation systems, greenhouse & tunnel coverings, raised beds & garden liners, and mulch films), composition (unfilled, mineral filled, and glass fiber-reinforced) and region (Asia Pacific, North America, Europe, South America, and Middle East & Africa). The report's scope covers detailed information regarding the drivers, restraints, challenges, and opportunities influencing the growth of the garden plastics market. A detailed analysis of the key industry players has been done to provide insights into their business overviews, products offered, and key strategies, such as partnerships, agreements, product launches, and acquisitions associated with the garden plastics market. This report covers a competitive analysis of the upcoming startups in the garden plastics market ecosystem.
Reasons to Buy the Report
The report will offer the market leaders/new entrants with information on the closest approximations of the revenue numbers for the overall garden plastics market and the subsegments. This report will help stakeholders understand the competitive landscape, gain more insights into positioning their businesses better, and plan suitable go-to-market strategies. The report will help stakeholders understand the pulse of the market and provide them with information on key market drivers, restraints, challenges, and opportunities.
The report provides insights into the following points:
- Assessment of primary drivers (Rising popularity of home gardening and urban landscaping, Increasing consumer preference for lightweight, weather-resistant plastic products, Growth in residential construction and outdoor living spaces, Cost-effectiveness and ease of manufacturing of plastic garden products.) restraints (Fluctuating prices of raw plastic materials such as PP and PE, and Limited biodegradability of conventional plastics), opportunities (Rising demand for recycled and bio-based plastics in garden products, Growth in smart gardening tools and modular plastic planters, Innovation in UV-resistant and esthetic-enhanced garden plastics and Expansion into emerging markets with rising urban green space initiatives), and challenges (Increasing competition from biodegradable and natural alternatives, such as clay, metal, and wood, Balancing cost vs. sustainability in material selection , and Managing product durability against prolonged sun and moisture exposure).
- Product Development/Innovation: Detailed insights into upcoming technologies, research & development activities, and product & service launches in the garden plastics market.
- Market Development: Comprehensive information about profitable markets - the report analyzes the garden plastics market across varied regions.
Market Diversification: Exhaustive information about new products & services, untapped geographies, recent developments, and investments in the garden plastics market.
- Competitive Assessment: In-depth assessment of market shares, growth strategies, and service offerings of leading players, such as Keter (Israel), THE HC COMPANIES, INC. (US), Scheurich GmbH & Co. KG (Germany), Elho B.V. (Netherlands), Horst Brandstatter Group (Germany), The AMES Companies (US), Berry Global Inc. (US), RKW Group (Germany), BASF (Germany), and Armando Alvarez Group (Spain).
TABLE OF CONTENTS
1 INTRODUCTION
- 1.1 STUDY OBJECTIVES
- 1.2 MARKET DEFINITION
- 1.3 STUDY SCOPE
- 1.3.1 MARKETS COVERED
- 1.3.2 INCLUSIONS AND EXCLUSIONS
- 1.3.3 YEARS CONSIDERED
- 1.3.4 CURRENCY CONSIDERED
- 1.3.5 UNITS CONSIDERED
- 1.4 STAKEHOLDERS
2 RESEARCH METHODOLOGY
- 2.1 RESEARCH DATA
- 2.1.1 SECONDARY DATA
- 2.1.1.1 List of major secondary sources
- 2.1.1.2 Key data from secondary sources
- 2.1.2 PRIMARY DATA
- 2.1.2.1 Key data from primary sources
- 2.1.2.2 Key industry insights
- 2.1.2.3 Breakdown of interviews with experts
- 2.1.1 SECONDARY DATA
- 2.2 MARKET SIZE ESTIMATION
- 2.2.1 BOTTOM-UP APPROACH
- 2.2.2 TOP-DOWN APPROACH
- 2.3 DATA TRIANGULATION
- 2.4 RESEARCH ASSUMPTIONS
- 2.5 GROWTH RATE ASSUMPTIONS/FORECAST
- 2.5.1 SUPPLY SIDE
- 2.5.2 DEMAND SIDE
- 2.6 RISK ASSESSMENT
- 2.7 LIMITATIONS
3 EXECUTIVE SUMMARY
4 PREMIUM INSIGHTS
- 4.1 ATTRACTIVE OPPORTUNITIES FOR PLAYERS IN GARDEN PLASTICS MARKET
- 4.2 GARDEN PLASTICS MARKET, BY PLASTIC TYPE
- 4.3 GARDEN PLASTICS MARKET, BY COMPOSITION
- 4.4 GARDEN PLASTICS MARKET, BY APPLICATION
- 4.5 GARDEN PLASTICS MARKET, BY KEY COUNTRY
5 MARKET OVERVIEW
- 5.1 INTRODUCTION
- 5.2 MARKET DYNAMICS
- 5.2.1 DRIVERS
- 5.2.1.1 Rising popularity of home gardening and urban landscaping
- 5.2.1.2 Increasing preference for lightweight, weather-resistant plastic products
- 5.2.1.3 Growth in residential construction and outdoor living spaces
- 5.2.1.4 Cost-effectiveness and ease of manufacturing plastic garden products
- 5.2.2 RESTRAINTS
- 5.2.2.1 Fluctuating prices of raw plastic materials such as PP and PE
- 5.2.2.2 Limited biodegradability of conventional plastics
- 5.2.3 OPPORTUNITIES
- 5.2.3.1 Rising demand for recycled and bio-based plastics in garden products
- 5.2.3.2 Growth in demand for smart gardening tools and modular plastic planters
- 5.2.3.3 Innovation in UV-resistant and esthetically enhanced garden plastics
- 5.2.3.4 Expansion into emerging markets with rising urban green space initiatives
- 5.2.4 CHALLENGES
- 5.2.4.1 Increasing competition from biodegradable and natural alternatives such as clay, metal, and wood
- 5.2.4.2 Balancing cost vs. sustainability in material selection
- 5.2.4.3 Managing product durability against prolonged sun and moisture exposure
- 5.2.1 DRIVERS
- 5.3 PORTER'S FIVE FORCES ANALYSIS
- 5.3.1 BARGAINING POWER OF SUPPLIERS
- 5.3.2 BARGAINING POWER OF BUYERS
- 5.3.3 INTENSITY OF COMPETITIVE RIVALRY
- 5.3.4 THREAT OF NEW ENTRANTS
- 5.3.5 THREAT OF SUBSTITUTES
- 5.4 TRENDS/DISRUPTIONS IMPACTING CUSTOMER BUSINESS
- 5.5 ECOSYSTEM ANALYSIS
- 5.6 VALUE CHAIN ANALYSIS
- 5.7 REGULATORY LANDSCAPE
- 5.7.1 REGULATORY BODIES, GOVERNMENT AGENCIES, AND OTHER ORGANIZATIONS
- 5.7.2 REGULATIONS
- 5.7.2.1 California Proposition 65 - Safe Drinking Water and Toxic Enforcement Act of 1986
- 5.7.2.2 TSCA (Toxic Substances Control Act) - 15 U.S.C. 2601 et seq.
- 5.7.2.3 Canada's Single-Use Plastics Prohibition Regulations (SOR/2022-138)
- 5.7.2.4 REACH Regulation (EC) No 1907/2006 - Registration, Evaluation, Authorisation and Restriction of Chemicals
- 5.7.2.5 Packaging and Packaging Waste Directive (94/62/EC)
- 5.7.2.6 Circular Economy Action Plan (2020)
- 5.7.2.7 Brazil's National Solid Waste Policy (Law No. 12.305/2010)
- 5.7.2.8 Chile's EPR Law (Law No. 20.920)
- 5.7.2.9 India - Plastic Waste Management Rules, 2016 (Amended 2022)
- 5.7.2.10 China - Plastic Pollution Control Measures (2020-2025)
- 5.7.2.11 Japan - Containers and Packaging Recycling Law (Act No. 112 of 1995)
- 5.7.2.12 South Africa - Extended Producer Responsibility Regulations (2021)
- 5.7.2.13 UAE - Integrated Waste Management Strategy (2021-2040)
- 5.7.2.14 Saudi Arabia - SASO Technical Regulation for Biodegradable Plastics (M.A-156-16-03-01)
- 5.8 TRADE ANALYSIS
- 5.8.1 IMPORT SCENARIO (HS CODE 391733)
- 5.8.2 EXPORT SCENARIO (HS CODE 391733)
- 5.8.3 EXPORT SCENARIO (HS CODE 392690)
- 5.8.4 IMPORT SCENARIO (HS CODE 392690)
- 5.9 PRICING ANALYSIS
- 5.9.1 AVERAGE SELLING PRICE TREND OF KEY PLAYERS, BY APPLICATION, 2024
- 5.9.2 AVERAGE SELLING PRICE TREND, BY REGION, 2024-2030
- 5.10 TECHNOLOGY ANALYSIS
- 5.10.1 KEY TECHNOLOGIES
- 5.10.1.1 Bio-Based Plastic Formulation
- 5.10.1.2 Recycled Polymer Integration (PCR & PIR)
- 5.10.2 COMPLEMENTARY TECHNOLOGIES
- 5.10.2.1 Smart Self-watering Systems
- 5.10.2.2 UV Stabilization and Weather-resistant Additives
- 5.10.3 ADJACENT TECHNOLOGIES
- 5.10.3.1 Smart Gardening & IoT Integration
- 5.10.3.2 Vertical Farming & Modular Urban Planters
- 5.10.1 KEY TECHNOLOGIES
- 5.11 PATENT ANALYSIS
- 5.11.1 METHODOLOGY
- 5.11.2 DOCUMENT TYPES
- 5.11.3 PUBLICATION TRENDS IN LAST 10 YEARS
- 5.11.4 INSIGHTS
- 5.11.5 LEGAL STATUS OF PATENTS
- 5.11.6 JURISDICTION ANALYSIS
- 5.11.7 TOP APPLICANTS
- 5.12 CASE STUDY ANALYSIS
- 5.12.1 TRANSITIONING TO RECYCLED PLASTIC IN GARDEN STORAGE PRODUCTS BY KETER
- 5.12.2 IMPLEMENTING CLOSED-LOOP RECYCLING FOR PLASTIC PLANTERS BY THE HC COMPANIES
- 5.12.3 SHIFTING TO BIO-BASED COMPOSITE MATERIALS FOR GARDEN FURNITURE BY NARDI (ITALY)
- 5.13 KEY CONFERENCES AND EVENTS, 2025-2026
- 5.14 INVESTMENT AND FUNDING SCENARIO
- 5.15 IMPACT OF GEN AI/AI ON GARDEN PLASTICS MARKET
- 5.15.1 INTRODUCTION
- 5.15.2 AI IN PRODUCT DESIGN AND CONSUMER INSIGHTS
- 5.15.3 AI-ENABLED MANUFACTURING AND SUPPLY CHAIN OPTIMIZATION
- 5.15.4 GENAI FOR SUSTAINABILITY AND CIRCULARITY
- 5.16 KEY STAKEHOLDERS AND BUYING CRITERIA
- 5.16.1 KEY STAKEHOLDERS IN BUYING PROCESS
- 5.16.2 BUYING CRITERIA
- 5.17 MACROECONOMIC ANALYSIS
- 5.17.1 INTRODUCTION
- 5.17.2 GDP TRENDS AND FORECASTS
- 5.18 IMPACT OF 2025 US TARIFF ON GARDEN PLASTICS MARKET
- 5.18.1 INTRODUCTION
- 5.18.2 KEY TARIFF RATES
- 5.18.3 PRICE IMPACT ANALYSIS
- 5.18.4 IMPACT ON COUNTRY/REGION
- 5.18.4.1 US
- 5.18.4.2 China
- 5.18.4.3 Europe
- 5.18.5 IMPACT ON APPLICATIONS
- 5.18.5.1 Residential landscaping & gardening
- 5.18.5.2 Municipal landscaping
- 5.18.5.3 E-Commerce & Direct-to-Consumer (DTC) channels
6 GARDEN PLASTICS MARKET, BY PLASTIC TYPE
- 6.1 INTRODUCTION
- 6.2 COMMODITY PLASTICS
- 6.2.1 ABUNDANCE, COST-EFFICIENCY, AND DURABILITY TO DRIVE DEMAND
- 6.2.2 HDPE (HIGH-DENSITY POLYETHYLENE)
- 6.2.3 LDPE (LOW-DENSITY POLYETHYLENE)
- 6.2.4 PP (POLYPROPYLENE)
- 6.2.5 PVC (POLYVINYL CHLORIDE)
- 6.2.6 OTHER COMMODITY PLASTICS
- 6.3 ENGINEERING & PERFORMANCE PLASTICS
- 6.3.1 SUPERIOR MECHANICAL PROPERTIES, WEATHER RESISTANCE, AND LONGEVITY TO FUEL MARKET
- 6.3.2 ABS (ACRYLONITRILE BUTADIENE STYRENE)
- 6.3.3 PA (POLYAMIDE)
- 6.3.4 PVDF (POLYVINYLIDENE FLUORIDE)
- 6.3.5 POM (POLYOXYMETHYLENE)
- 6.3.6 OTHER ENGINEERING & PERFORMANCE PLASTICS
7 GARDEN PLASTICS MARKET, BY COMPOSITION
- 7.1 INTRODUCTION
- 7.2 UNFILLED
- 7.2.1 COST-EFFICIENT AND VERSATILE SOLUTION FOR MASS MARKET GARDEN PRODUCTS
- 7.3 MINERAL-FILLED
- 7.3.1 ENHANCED RIGIDITY, DIMENSIONAL STABILITY, AND UV RESISTANCE TO DRIVE ADOPTION
- 7.4 GLASS FIBER REINFORCED
- 7.4.1 HIGH TENSILE STRENGTH, DIMENSIONAL STABILITY, AND LONG-TERM DURABILITY TO BOOST ADOPTION
- 7.5 OTHER COMPOSITIONS
8 GARDEN PLASTICS MARKET, BY APPLICATION
- 8.1 INTRODUCTION
- 8.2 MULCH FILMS
- 8.2.1 SUSTAINABLE AGRICULTURAL PRACTICES TO DRIVE ADOPTION
- 8.3 IRRIGATION SYSTEMS
- 8.3.1 EXPANDING WATER CONSERVATION PRACTICES TO BOOST MARKET
- 8.4 GREENHOUSE & TUNNEL COVERINGS
- 8.4.1 INCREASING CONTROLLED-ENVIRONMENT FARMING TO FUEL DEMAND
- 8.5 RAISED BEDS & GARDEN LINERS
- 8.5.1 RISING URBAN FARMING AND DIY LANDSCAPING TO PROPEL MARKET
- 8.6 POTS & CONTAINERS
- 8.6.1 GROWING URBAN GARDENING AND LANDSCAPING TO BOOST DEMAND
- 8.7 OTHER APPLICATIONS
9 GARDEN PLASTICS MARKET, BY REGION
- 9.1 INTRODUCTION
- 9.2 NORTH AMERICA
- 9.2.1 US
- 9.2.1.1 Demand for durable, weather-resistant, and sustainable plastic products to drive market
- 9.2.2 CANADA
- 9.2.2.1 Strong demand across residential landscaping, commercial horticulture, and urban infrastructure projects to drive growth
- 9.2.3 MEXICO
- 9.2.3.1 Rising demand for urban green infrastructure to boost growth
- 9.2.1 US
- 9.3 EUROPE
- 9.3.1 GERMANY
- 9.3.1.1 Strong domestic consumption, sustainability mandates, and rising demand across garden and outdoor living segments to propel market
- 9.3.2 FRANCE
- 9.3.2.1 Shift toward sustainable lifestyles, esthetic functionality, and urban gardening to fuel market
- 9.3.3 UK
- 9.3.3.1 Consumer shift toward sustainability, DIY culture, and durable outdoor living solutions to drive market
- 9.3.4 ITALY
- 9.3.4.1 Major line expansions and rising demand from home, garden, and construction segments to drive market growth
- 9.3.5 SPAIN
- 9.3.5.1 Multi-sectoral expansion and sustainability push to support growth
- 9.3.6 REST OF EUROPE
- 9.3.1 GERMANY
- 9.4 ASIA PACIFIC
- 9.4.1 CHINA
- 9.4.1.1 large-scale manufacturing capacity, growing domestic landscaping trends, and expanding global exports to boost market
- 9.4.2 JAPAN
- 9.4.2.1 Advanced innovation, demographic-driven product development, and strong shift toward environmental responsibility to fuel demand
- 9.4.3 INDIA
- 9.4.3.1 Rapid urbanization, government push for sustainability, and domestic innovation to drive growth
- 9.4.4 SOUTH KOREA
- 9.4.4.1 Demographic trends, rise of home-based lifestyle, and growing environmental consciousness to support market growth
- 9.4.5 REST OF ASIA PACIFIC
- 9.4.1 CHINA
- 9.5 MIDDLE EAST & AFRICA
- 9.5.1 GCC COUNTRIES
- 9.5.1.1 Saudi Arabia
- 9.5.1.1.1 Reshaping urban spaces, boosting green infrastructure, and use of durable, eco-friendly plastic products to propel demand
- 9.5.1.2 UAE
- 9.5.1.2.1 Rising per capita income, expanding residential infrastructure, and thriving landscaping industry to fuel market growth
- 9.5.1.3 Rest of GCC countries
- 9.5.1.1 Saudi Arabia
- 9.5.2 SOUTH AFRICA
- 9.5.2.1 Renewed focus on sustainable urban living, water conservation, and public space development to drive demand
- 9.5.3 REST OF MIDDLE EAST & AFRICA
- 9.5.1 GCC COUNTRIES
- 9.6 SOUTH AMERICA
- 9.6.1 BRAZIL
- 9.6.1.1 Transition toward recyclable and durable outdoor goods to propel market
- 9.6.2 ARGENTINA
- 9.6.2.1 Growing demand for durable, UV-resistant, and weather-tolerant plastic products to boost market
- 9.6.3 REST OF SOUTH AMERICA
- 9.6.1 BRAZIL
10 COMPETITIVE LANDSCAPE
- 10.1 OVERVIEW
- 10.2 KEY PLAYER STRATEGIES, 2022-2025
- 10.3 MARKET SHARE ANALYSIS, 2024
- 10.4 REVENUE ANALYSIS, 2020-2024
- 10.5 COMPANY VALUATION AND FINANCIAL METRICS, 2024
- 10.6 PRODUCT/BRAND COMPARISON
- 10.7 COMPANY EVALUATION MATRIX: KEY PLAYERS, 2024
- 10.7.1 STARS
- 10.7.2 EMERGING LEADERS
- 10.7.3 PERVASIVE PLAYERS
- 10.7.4 PARTICIPANTS
- 10.7.5 COMPANY FOOTPRINT: KEY PLAYERS, 2024
- 10.7.5.1 Company footprint
- 10.7.5.2 Region footprint
- 10.7.5.3 Type footprint
- 10.7.5.4 Application footprint
- 10.7.5.5 Composition footprint
- 10.8 COMPANY EVALUATION MATRIX: STARTUPS/SMES, 2024
- 10.8.1 PROGRESSIVE COMPANIES
- 10.8.2 RESPONSIVE COMPANIES
- 10.8.3 DYNAMIC COMPANIES
- 10.8.4 STARTING BLOCKS
- 10.8.5 COMPETITIVE BENCHMARKING: STARTUPS/SMES, 2024
- 10.8.5.1 Detailed list of key startups/SMEs
- 10.8.5.2 Competitive benchmarking of key startups/SMEs
- 10.9 COMPETITIVE SCENARIO
- 10.9.1 PRODUCT LAUNCHES
- 10.9.2 DEALS
11 COMPANY PROFILES
- 11.1 KEY PLAYERS
- 11.1.1 KETER
- 11.1.1.1 Business overview
- 11.1.1.2 Products/Solutions/Services offered
- 11.1.1.3 Recent developments
- 11.1.1.3.1 Product launches
- 11.1.1.3.2 Deals
- 11.1.1.4 MnM view
- 11.1.1.4.1 Right to win
- 11.1.1.4.2 Strategic choices
- 11.1.1.4.3 Weaknesses and competitive threats
- 11.1.2 THE HC COMPANIES, INC.
- 11.1.2.1 Business overview
- 11.1.2.1.1 Products/Solutions/Services offered
- 11.1.2.2 Recent developments
- 11.1.2.2.1 Product launches
- 11.1.2.2.2 Deals
- 11.1.2.3 MnM view
- 11.1.2.3.1 Right to win
- 11.1.2.3.2 Strategic choices
- 11.1.2.3.3 Weaknesses and competitive threats
- 11.1.2.1 Business overview
- 11.1.3 SCHEURICH GMBH & CO. KG
- 11.1.3.1 Business overview
- 11.1.3.2 Products/Solutions/Services offered
- 11.1.3.3 Recent developments
- 11.1.3.3.1 Deals
- 11.1.3.4 MnM view
- 11.1.3.4.1 Right to win
- 11.1.3.4.2 Strategic choices
- 11.1.3.4.3 Weaknesses and competitive threats
- 11.1.4 ELHO B.V.
- 11.1.4.1 Business overview
- 11.1.4.2 Products/Solutions/Services offered
- 11.1.4.3 Recent developments
- 11.1.4.3.1 Product launches
- 11.1.4.4 MnM view
- 11.1.4.4.1 Right to win
- 11.1.4.4.2 Strategic choices
- 11.1.4.4.3 Weaknesses and competitive threats
- 11.1.5 HORST BRANDSTATTER GROUP
- 11.1.5.1 Business overview
- 11.1.5.2 Products/Solutions/Services offered
- 11.1.5.3 MnM view
- 11.1.5.3.1 Right to win
- 11.1.5.3.2 Strategic choices
- 11.1.5.3.3 Weaknesses and competitive threats
- 11.1.6 GRIFFON CORPORATION INC.
- 11.1.6.1 Business overview
- 11.1.6.2 Products/Solutions/Services offered
- 11.1.6.3 MnM view
- 11.1.7 BERRY GLOBAL INC.
- 11.1.7.1 Business overview
- 11.1.7.2 Products/Solutions/Services offered
- 11.1.7.3 Recent developments
- 11.1.7.3.1 Deals
- 11.1.7.4 MnM view
- 11.1.8 RKW GROUP
- 11.1.8.1 Business overview
- 11.1.8.2 Products/Solutions/Services offered
- 11.1.8.3 MnM view
- 11.1.9 BASF
- 11.1.9.1 Business overview
- 11.1.9.2 Products/Solutions/Services offered
- 11.1.9.3 Recent developments
- 11.1.9.3.1 Product launches
- 11.1.9.4 MnM view
- 11.1.10 ARMANDO ALVAREZ GROUP
- 11.1.10.1 Business overview
- 11.1.10.2 Products/Solutions/Services offered
- 11.1.10.3 MnM view
- 11.1.1 KETER
- 11.2 OTHER PLAYERS
- 11.2.1 LANDMARK PLASTIC INC.
- 11.2.2 EAST JORDAN PLASTICS, INC.
- 11.2.3 CREO GROUP
- 11.2.4 T.O. PLASTICS, INC.
- 11.2.5 CAPI EUROPE
- 11.2.6 HARSHDEEP INDIA
- 11.2.7 EURO3PLAST SPA
- 11.2.8 SA PLASTIKOR (PTY) LTD.
- 11.2.9 COSMOPLAST UAE
- 11.2.10 FINOLEX PLASSON
- 11.2.11 KISAN
- 11.2.12 TAIZHOU SHENGERDA PLASTIC CO., LTD.
- 11.2.13 HOSCO INDIA
- 11.2.14 TAIZHOU KEDI PLASTIC CO., LTD.
- 11.2.15 VIP PLASTICS
12 APPENDIX
- 12.1 DISCUSSION GUIDE
- 12.2 KNOWLEDGESTORE: MARKETSANDMARKETS' SUBSCRIPTION PORTAL
- 12.3 CUSTOMIZATION OPTIONS
- 12.4 RELATED REPORTS
- 12.5 AUTHOR DETAILS
List of Tables
- TABLE 1 GARDEN PLASTICS MARKET: INCLUSIONS AND EXCLUSIONS OF STUDY
- TABLE 2 MONTHLY NEW RESIDENTIAL CONSTRUCTION, MAY 2025
- TABLE 3 IMPACT OF PORTER'S FIVE FORCES ON GARDEN PLASTICS MARKET
- TABLE 4 ROLES OF COMPANIES IN GARDEN PLASTICS ECOSYSTEM
- TABLE 5 NORTH AMERICA: LIST OF REGULATORY BODIES, GOVERNMENT AGENCIES, INDUSTRY ASSOCIATIONS, AND OTHER ORGANIZATIONS
- TABLE 6 EUROPE: LIST OF REGULATORY BODIES, GOVERNMENT AGENCIES, INDUSTRY ASSOCIATIONS, AND OTHER ORGANIZATIONS
- TABLE 7 ASIA PACIFIC: LIST OF REGULATORY BODIES, GOVERNMENT AGENCIES, INDUSTRY ASSOCIATIONS, AND OTHER ORGANIZATIONS
- TABLE 8 MIDDLE EAST & AFRICA: LIST OF REGULATORY BODIES, GOVERNMENT AGENCIES, INDUSTRY ASSOCIATIONS, AND OTHER ORGANIZATIONS
- TABLE 9 SOUTH AMERICA: LIST OF REGULATORY BODIES, GOVERNMENT AGENCIES, INDUSTRY ASSOCIATIONS, AND OTHER ORGANIZATIONS
- TABLE 10 IMPORT DATA RELATED TO HS CODE 391733-COMPLIANT PRODUCTS, BY COUNTRY, 2020-2024 (USD MILLION)
- TABLE 11 EXPORT DATA RELATED TO HS CODE 281213-COMPLIANT PRODUCTS, BY COUNTRY, 2020-2024 (USD MILLION)
- TABLE 12 EXPORT DATA RELATED TO HS CODE 392690-COMPLIANT PRODUCTS, BY COUNTRY, 2020- 2024 (USD MILLION)
- TABLE 13 IMPORT DATA RELATED TO HS CODE 392690-COMPLIANT PRODUCTS, BY COUNTRY, 2020-2024 (USD MILLION)
- TABLE 14 PRICING ANALYSIS OF GARDEN PLASTICS OFFERED BY KEY PLAYERS, BY APPLICATION, 2024 (USD/MT)
- TABLE 15 AVERAGE SELLING PRICE TREND OF GARDEN PLASTICS, BY REGION, 2023-2030 (USD/KG)
- TABLE 16 TOP 10 PATENT OWNERS DURING THE LAST TEN YEARS, 2015-2024
- TABLE 17 GARDEN PLASTICS MARKET: LIST OF KEY CONFERENCES AND EVENTS, 2025-2026
- TABLE 18 INFLUENCE OF STAKEHOLDERS ON BUYING PROCESS, BY APPLICATION
- TABLE 19 KEY BUYING CRITERIA FOR KEY APPLICATIONS
- TABLE 20 GLOBAL GDP GROWTH PROJECTION, BY REGION, 2021-2028 (USD TRILLION)
- TABLE 21 GARDEN PLASTICS MARKET, BY PLASTIC TYPE, 2022-2024 (USD MILLION)
- TABLE 22 GARDEN PLASTICS MARKET, BY PLASTIC TYPE, 2025-2030 (USD MILLION)
- TABLE 23 GARDEN PLASTICS MARKET, BY PLASTIC TYPE, 2022-2024 (KILOTON)
- TABLE 24 GARDEN PLASTICS MARKET, BY PLASTIC TYPE, 2025-2030 (KILOTON)
- TABLE 25 GARDEN PLASTICS MARKET, BY COMPOSITION, 2022-2024 (USD MILLION)
- TABLE 26 GARDEN PLASTICS MARKET, BY COMPOSITION, 2025-2030 (USD MILLION)
- TABLE 27 GARDEN PLASTICS MARKET, BY APPLICATION, 2022-2024 (KILOTON)
- TABLE 28 GARDEN PLASTICS MARKET, BY APPLICATION, 2025-2030 (KILOTON)
- TABLE 29 GARDEN PLASTICS MARKET, BY APPLICATION, 2022-2024 (USD MILLION)
- TABLE 30 GARDEN PLASTICS MARKET, BY APPLICATION, 2025-2030 (USD MILLION)
- TABLE 31 GARDEN PLASTICS MARKET, BY APPLICATION, 2022-2024 (KILOTON)
- TABLE 32 GARDEN PLASTICS MARKET, BY APPLICATION, 2025-2030 (KILOTON)
- TABLE 33 GARDEN PLASTICS MARKET, BY REGION, 2022-2024 (USD MILLION)
- TABLE 34 GARDEN PLASTICS MARKET, BY REGION, 2025-2030 (USD MILLION)
- TABLE 35 GARDEN PLASTICS MARKET, BY REGION, 2022-2024 (KILOTON)
- TABLE 36 GARDEN PLASTICS MARKET, BY REGION, 2025-2030 (KILOTON)
- TABLE 37 NORTH AMERICA: GARDEN PLASTICS MARKET, BY COUNTRY, 2022-2024 (USD MILLION)
- TABLE 38 NORTH AMERICA: GARDEN PLASTICS MARKET, BY COUNTRY, 2025-2030 (USD MILLION)
- TABLE 39 NORTH AMERICA: GARDEN PLASTICS MARKET, BY COUNTRY, 2022-2024 (KILOTON)
- TABLE 40 NORTH AMERICA: GARDEN PLASTICS MARKET, BY COUNTRY, 2025-2030 (KILOTON)
- TABLE 41 NORTH AMERICA: GARDEN PLASTICS MARKET, BY PLASTIC TYPE, 2022-2024 (USD MILLION)
- TABLE 42 NORTH AMERICA: GARDEN PLASTICS MARKET, BY PLASTIC TYPE, 2025-2030 (USD MILLION)
- TABLE 43 NORTH AMERICA: GARDEN PLASTICS MARKET, BY PLASTIC TYPE, 2022-2024 (KILOTON)
- TABLE 44 NORTH AMERICA : GARDEN PLASTICS MARKET, BY PLASTIC TYPE, 2025-2030 (KILOTON)
- TABLE 45 NORTH AMERICA: GARDEN PLASTICS MARKET, BY APPLICATION, 2022-2024 (USD MILLION)
- TABLE 46 NORTH AMERICA: GARDEN PLASTICS MARKET, BY APPLICATION, 2025-2030 (USD MILLION)
- TABLE 47 NORTH AMERICA: GARDEN PLASTICS MARKET, BY APPLICATION, 2022-2024 (KILOTON)
- TABLE 48 NORTH AMERICA: GARDEN PLASTICS MARKET, BY APPLICATION, 2025-2030 (KILOTON)
- TABLE 49 US: GARDEN PLASTICS MARKET, BY APPLICATION, 2022-2024 (USD MILLION)
- TABLE 50 US: GARDEN PLASTICS MARKET, BY APPLICATION, 2025-2030 (USD MILLION)
- TABLE 51 US: GARDEN PLASTICS MARKET, BY APPLICATION, 2022-2024 (KILOTON)
- TABLE 52 US: GARDEN PLASTICS MARKET, BY APPLICATION, 2025-2030 (KILOTON)
- TABLE 53 CANADA: GARDEN PLASTICS MARKET, BY APPLICATION, 2022-2024 (USD MILLION)
- TABLE 54 CANADA: GARDEN PLASTICS MARKET, BY APPLICATION, 2025-2030 (USD MILLION)
- TABLE 55 CANADA: GARDEN PLASTICS MARKET, BY APPLICATION, 2022-2024 (KILOTON)
- TABLE 56 CANADA: GARDEN PLASTICS MARKET, BY APPLICATION, 2025-2030 (KILOTON)
- TABLE 57 MEXICO: GARDEN PLASTICS MARKET, BY APPLICATION, 2022-2024 (USD MILLION)
- TABLE 58 MEXICO: GARDEN PLASTICS MARKET, BY APPLICATION, 2025-2030 (USD MILLION)
- TABLE 59 MEXICO: GARDEN PLASTICS MARKET, BY APPLICATION, 2022-2024 (KILOTON)
- TABLE 60 MEXICO: GARDEN PLASTICS MARKET, BY APPLICATION, 2025-2030 (KILOTON)
- TABLE 61 EUROPE: GARDEN PLASTICS MARKET, BY COUNTRY, 2022-2024 (USD MILLION)
- TABLE 62 EUROPE: GARDEN PLASTICS MARKET, BY COUNTRY, 2025-2030 (USD MILLION)
- TABLE 63 EUROPE: GARDEN PLASTICS MARKET, BY COUNTRY, 2022-2024 (KILOTON)
- TABLE 64 EUROPE: GARDEN PLASTICS MARKET, BY COUNTRY, 2025-2030 (KILOTON)
- TABLE 65 EUROPE: GARDEN PLASTICS MARKET, BY PLASTIC TYPE, 2022-2024 (USD MILLION)
- TABLE 66 EUROPE: GARDEN PLASTICS MARKET, BY PLASTIC TYPE, 2025-2030 (USD MILLION)
- TABLE 67 EUROPE: GARDEN PLASTICS MARKET, BY PLASTIC TYPE, 2022-2024 (KILOTON)
- TABLE 68 EUROPE: GARDEN PLASTICS MARKET, BY PLASTIC TYPE, 2025-2030 (KILOTON)
- TABLE 69 EUROPE: GARDEN PLASTICS MARKET, BY APPLICATION, 2022-2024 (USD MILLION)
- TABLE 70 EUROPE: GARDEN PLASTICS MARKET, BY APPLICATION, 2025-2030 (USD MILLION)
- TABLE 71 EUROPE: GARDEN PLASTICS MARKET, BY APPLICATION, 2022-2024 (KILOTON)
- TABLE 72 EUROPE: GARDEN PLASTICS MARKET, BY APPLICATION, 2025-2030 (KILOTON)
- TABLE 73 GERMANY: GARDEN PLASTICS MARKET, BY APPLICATION, 2022-2024 (USD MILLION)
- TABLE 74 GERMANY: GARDEN PLASTICS MARKET, BY APPLICATION, 2025-2030 (USD MILLION)
- TABLE 75 GERMANY: GARDEN PLASTICS MARKET, BY APPLICATION, 2022-2024 (KILOTON)
- TABLE 76 GERMANY: GARDEN PLASTICS MARKET, BY APPLICATION, 2025-2030 (KILOTON)
- TABLE 77 FRANCE: GARDEN PLASTICS MARKET, BY APPLICATION, 2022-2024 (USD MILLION)
- TABLE 78 FRANCE: GARDEN PLASTICS MARKET, BY APPLICATION, 2025-2030 (USD MILLION)
- TABLE 79 FRANCE: GARDEN PLASTICS MARKET, BY APPLICATION, 2022-2024 (KILOTON)
- TABLE 80 FRANCE: GARDEN PLASTICS MARKET, BY APPLICATION, 2025-2030 (KILOTON)
- TABLE 81 UK: GARDEN PLASTICS MARKET, BY APPLICATION, 2022-2024 (USD MILLION)
- TABLE 82 UK: GARDEN PLASTICS MARKET, BY APPLICATION, 2025-2030 (USD MILLION)
- TABLE 83 UK: GARDEN PLASTICS MARKET, BY APPLICATION, 2022-2024 (KILOTON)
- TABLE 84 UK: GARDEN PLASTICS MARKET, BY APPLICATION, 2025-2030 (KILOTON)
- TABLE 85 ITALY: GARDEN PLASTICS MARKET, BY APPLICATION, 2022-2024 (USD MILLION)
- TABLE 86 ITALY: GARDEN PLASTICS MARKET, BY APPLICATION, 2025-2030 (USD MILLION)
- TABLE 87 ITALY: GARDEN PLASTICS MARKET, BY APPLICATION, 2022-2024 (KILOTON)
- TABLE 88 ITALY: GARDEN PLASTICS MARKET, BY APPLICATION, 2025-2030 (KILOTON)
- TABLE 89 SPAIN: GARDEN PLASTICS MARKET, BY APPLICATION, 2022-2024 (USD MILLION)
- TABLE 90 SPAIN: GARDEN PLASTICS MARKET, BY APPLICATION, 2025-2030 (USD MILLION)
- TABLE 91 SPAIN: GARDEN PLASTICS MARKET, BY APPLICATION, 2022-2024 (KILOTON)
- TABLE 92 SPAIN: GARDEN PLASTICS MARKET, BY APPLICATION, 2025-2030 (KILOTON)
- TABLE 93 REST OF EUROPE: GARDEN PLASTICS MARKET, BY APPLICATION, 2022-2024 (USD MILLION)
- TABLE 94 REST OF EUROPE: GARDEN PLASTICS MARKET, BY APPLICATION, 2025-2030 (USD MILLION)
- TABLE 95 REST OF EUROPE: GARDEN PLASTICS MARKET, BY APPLICATION, 2022-2024 (KILOTON)
- TABLE 96 REST OF EUROPE: GARDEN PLASTICS MARKET, BY APPLICATION, 2025-2030 (KILOTON)
- TABLE 97 ASIA PACIFIC: GARDEN PLASTICS, BY COUNTRY, 2022-2024 (USD MILLION)
- TABLE 98 ASIA PACIFIC: GARDEN PLASTICS , BY COUNTRY, 2025-2030 (USD MILLION)
- TABLE 99 ASIA PACIFIC: GARDEN PLASTICS, BY COUNTRY, 2022-2024 (KILOTON)
- TABLE 100 ASIA PACIFIC: GARDEN PLASTICS, BY COUNTRY, 2025-2030 (KILOTON)
- TABLE 101 ASIA PACIFIC: GARDEN PLASTICS MARKET, BY PLASTIC TYPE, 2022-2024 (USD MILLION)
- TABLE 102 ASIA PACIFIC: GARDEN PLASTICS MARKET, BY PLASTIC TYPE, 2025-2030 (USD MILLION)
- TABLE 103 ASIA PACIFIC: GARDEN PLASTICS MARKET, BY PLASTIC TYPE, 2022-2024 (KILOTON)
- TABLE 104 ASIA PACIFIC: GARDEN PLASTICS MARKET, BY PLASTIC TYPE, 2025-2030 (KILOTON)
- TABLE 105 ASIA PACIFIC: GARDEN PLASTICS MARKET, BY APPLICATION, 2022-2024 (USD MILLION)
- TABLE 106 ASIA PACIFIC: GARDEN PLASTICS MARKET, BY APPLICATION, 2025-2030 (USD MILLION)
- TABLE 107 ASIA PACIFIC: GARDEN PLASTICS MARKET, BY APPLICATION, 2022-2024 (KILOTON)
- TABLE 108 ASIA PACIFIC: GARDEN PLASTICS MARKET, BY APPLICATION, 2025-2030 (KILOTON)
- TABLE 109 CHINA: GARDEN PLASTICS MARKET, BY APPLICATION, 2022-2024 (USD MILLION)
- TABLE 110 CHINA: GARDEN PLASTICS MARKET, BY APPLICATION, 2025-2030 (USD MILLION)
- TABLE 111 CHINA: GARDEN PLASTICS MARKET, BY APPLICATION, 2022-2024 (KILOTON)
- TABLE 112 CHINA: GARDEN PLASTICS MARKET, BY APPLICATION, 2025-2030 (KILOTON)
- TABLE 113 JAPAN: GARDEN PLASTICS MARKET, BY APPLICATION, 2022-2024 (USD MILLION)
- TABLE 114 JAPAN: GARDEN PLASTICS MARKET, BY APPLICATION, 2025-2030 (USD MILLION)
- TABLE 115 JAPAN: GARDEN PLASTICS MARKET, BY APPLICATION, 2022-2024 (KILOTON)
- TABLE 116 JAPAN: GARDEN PLASTICS MARKET, BY APPLICATION, 2025-2030 (KILOTON)
- TABLE 117 INDIA: GARDEN PLASTICS MARKET, BY APPLICATION, 2022-2024 (USD MILLION)
- TABLE 118 INDIA: GARDEN PLASTICS MARKET, BY APPLICATION, 2025-2030 (USD MILLION)
- TABLE 119 INDIA: GARDEN PLASTICS MARKET, BY APPLICATION, 2022-2024 (KILOTON)
- TABLE 120 INDIA: GARDEN PLASTICS MARKET, BY APPLICATION, 2025-2030 (KILOTON)
- TABLE 121 SOUTH KOREA: GARDEN PLASTICS MARKET, BY APPLICATION, 2022-2024 (USD MILLION)
- TABLE 122 SOUTH KOREA: GARDEN PLASTICS MARKET, BY APPLICATION, 2025-2030 (USD MILLION)
- TABLE 123 SOUTH KOREA: GARDEN PLASTICS MARKET, BY APPLICATION, 2022-2024 (KILOTON)
- TABLE 124 SOUTH KOREA: GARDEN PLASTICS MARKET, BY APPLICATION, 2025-2030 (KILOTON)
- TABLE 125 REST OF ASIA PACIFIC: GARDEN PLASTICS MARKET, BY APPLICATION, 2022-2024 (USD MILLION)
- TABLE 126 REST OF ASIA PACIFIC: GARDEN PLASTICS MARKET, BY APPLICATION, 2025-2030 (USD MILLION)
- TABLE 127 REST OF ASIA PACIFIC: GARDEN PLASTICS MARKET, BY APPLICATION, 2022-2024 (KILOTON)
- TABLE 128 REST OF ASIA PACIFIC: GARDEN PLASTICS MARKET, BY APPLICATION, 2025-2030 (KILOTON)
- TABLE 129 MIDDLE EAST & AFRICA: GARDEN PLASTICS MARKET, BY COUNTRY, 2022-2024 (USD MILLION)
- TABLE 130 MIDDLE EAST & AFRICA: GARDEN PLASTICS MARKET, BY COUNTRY, 2025-2030 (USD MILLION)
- TABLE 131 MIDDLE EAST & AFRICA: GARDEN PLASTICS MARKET, BY COUNTRY, 2022-2024 (KILOTON)
- TABLE 132 MIDDLE EAST & AFRICA: GARDEN PLASTICS MARKET, BY COUNTRY, 2025-2030 (KILOTON)
- TABLE 133 MIDDLE EAST & AFRICA: GARDEN PLASTICS MARKET, BY PLASTIC TYPE, 2022-2024 (USD MILLION)
- TABLE 134 MIDDLE EAST & AFRICA: GARDEN PLASTICS MARKET, BY PLASTIC TYPE, 2025-2030 (USD MILLION)
- TABLE 135 MIDDLE EAST & AFRICA: GARDEN PLASTICS MARKET, BY PLASTIC TYPE, 2022-2024 (KILOTON)
- TABLE 136 MIDDLE EAST & AFRICA: GARDEN PLASTICS MARKET, BY PLASTIC TYPE, 2025-2030 (KILOTON)
- TABLE 137 MIDDLE EAST & AFRICA: GARDEN PLASTICS MARKET, BY APPLICATION, 2022-2024 (USD MILLION)
- TABLE 138 MIDDLE EAST & AFRICA: GARDEN PLASTICS MARKET, BY APPLICATION, 2025-2030 (USD MILLION)
- TABLE 139 MIDDLE EAST & AFRICA: GARDEN PLASTICS MARKET, BY APPLICATION, 2022-2024 (KILOTON)
- TABLE 140 MIDDLE EAST & AFRICA: GARDEN PLASTICS MARKET, BY APPLICATION, 2025-2030 (KILOTON)
- TABLE 141 GCC COUNTRIES: GARDEN PLASTICS MARKET, BY APPLICATION, 2022-2024 (USD MILLION)
- TABLE 142 GCC COUNTRIES: GARDEN PLASTICS MARKET, BY APPLICATION, 2025-2030 (USD MILLION)
- TABLE 143 GCC COUNTRIES: GARDEN PLASTICS MARKET, BY APPLICATION, 2022-2024 (KILOTON)
- TABLE 144 GCC COUNTRIES: GARDEN PLASTICS MARKET, BY APPLICATION, 2025-2030 (KILOTON)
- TABLE 145 SAUDI ARABIA: GARDEN PLASTICS MARKET, BY APPLICATION, 2022-2024 (USD MILLION)
- TABLE 146 SAUDI ARABIA: GARDEN PLASTICS MARKET, BY APPLICATION, 2025-2030 (USD MILLION)
- TABLE 147 SAUDI ARABIA: GARDEN PLASTICS MARKET, BY APPLICATION, 2022-2024 (KILOTON)
- TABLE 148 SAUDI ARABIA: GARDEN PLASTICS MARKET, BY APPLICATION, 2025-2030 (KILOTON)
- TABLE 149 UAE: GARDEN PLASTICS MARKET, BY APPLICATION, 2022-2024 (USD MILLION)
- TABLE 150 UAE: GARDEN PLASTICS MARKET, BY APPLICATION, 2025-2030 (USD MILLION)
- TABLE 151 UAE: GARDEN PLASTICS MARKET, BY APPLICATION, 2022-2024 (KILOTON)
- TABLE 152 UAE: GARDEN PLASTICS MARKET, BY APPLICATION, 2025-2030 (KILOTON)
- TABLE 153 REST OF GCC COUNTRIES: GARDEN PLASTICS MARKET, BY APPLICATION, 2022-2024 (USD MILLION)
- TABLE 154 REST OF GCC COUNTRIES: GARDEN PLASTICS MARKET, BY APPLICATION, 2025-2030 (USD MILLION)
- TABLE 155 REST OF GCC COUNTRIES: GARDEN PLASTICS MARKET, BY APPLICATION, 2022-2024 (KILOTON)
- TABLE 156 REST OF GCC COUNTRIES: GARDEN PLASTICS MARKET, BY APPLICATION, 2025-2030 (KILOTON)
- TABLE 157 SOUTH AFRICA: GARDEN PLASTICS MARKET, BY APPLICATION, 2022-2024 (USD MILLION)
- TABLE 158 SOUTH AFRICA: GARDEN PLASTICS MARKET, BY APPLICATION, 2025-2030 (USD MILLION)
- TABLE 159 SOUTH AFRICA: GARDEN PLASTICS MARKET, BY APPLICATION, 2022-2024 (KILOTON)
- TABLE 160 SOUTH AFRICA: GARDEN PLASTICS MARKET, BY APPLICATION, 2025-2030 (KILOTON)
- TABLE 161 REST OF MIDDLE EAST & AFRICA: GARDEN PLASTICS MARKET, BY APPLICATION, 2022-2024 (USD MILLION)
- TABLE 162 REST OF MIDDLE EAST & AFRICA: GARDEN PLASTICS MARKET, BY APPLICATION, 2025-2030 (USD MILLION)
- TABLE 163 REST OF MIDDLE EAST & AFRICA: GARDEN PLASTICS MARKET, BY APPLICATION, 2022-2024 (KILOTON)
- TABLE 164 REST OF MIDDLE EAST & AFRICA: GARDEN PLASTICS MARKET, BY APPLICATION, 2025-2030 (KILOTON)
- TABLE 165 SOUTH AMERICA: GARDEN PLASTICS MARKET, BY COUNTRY, 2022-2024 (USD MILLION)
- TABLE 166 SOUTH AMERICA: GARDEN PLASTICS MARKET, BY COUNTRY, 2025-2030 (USD MILLION)
- TABLE 167 SOUTH AMERICA: GARDEN PLASTICS MARKET, BY COUNTRY, 2022-2024 (KILOTON)
- TABLE 168 SOUTH AMERICA: GARDEN PLASTICS MARKET, BY COUNTRY, 2025-2030 (KILOTON)
- TABLE 169 SOUTH AMERICA: GARDEN PLASTICS MARKET, BY PLASTIC TYPE, 2022-2024 (USD MILLION)
- TABLE 170 SOUTH AMERICA: GARDEN PLASTICS MARKET, BY PLASTIC TYPE, 2025-2030 (USD MILLION)
- TABLE 171 SOUTH AMERICA: GARDEN PLASTICS MARKET, BY PLASTIC TYPE, 2022-2024 (KILOTON)
- TABLE 172 SOUTH AMERICA: GARDEN PLASTICS MARKET, BY PLASTIC TYPE, 2025-2030 (KILOTON)
- TABLE 173 SOUTH AMERICA: GARDEN PLASTICS MARKET, BY APPLICATION, 2022-2024 (USD MILLION)
- TABLE 174 SOUTH AMERICA: GARDEN PLASTICS MARKET, BY APPLICATION, 2025-2030 (USD MILLION)
- TABLE 175 SOUTH AMERICA: GARDEN PLASTICS MARKET, BY APPLICATION, 2022-2024 (KILOTON)
- TABLE 176 SOUTH AMERICA: GARDEN PLASTICS MARKET, BY APPLICATION, 2025-2030 (KILOTON)
- TABLE 177 BRAZIL: GARDEN PLASTICS MARKET, BY APPLICATION, 2022-2024 (USD MILLION)
- TABLE 178 BRAZIL: GARDEN PLASTICS MARKET, BY APPLICATION, 2025-2030 (USD MILLION)
- TABLE 179 BRAZIL: GARDEN PLASTICS MARKET, BY APPLICATION, 2022-2024 (KILOTON)
- TABLE 180 BRAZIL: GARDEN PLASTICS MARKET, BY APPLICATION, 2025-2030 (KILOTON)
- TABLE 181 ARGENTINA: GARDEN PLASTICS MARKET, BY APPLICATION, 2022-2024 (USD MILLION)
- TABLE 182 ARGENTINA: GARDEN PLASTICS MARKET, BY APPLICATION, 2025-2030 (USD MILLION)
- TABLE 183 ARGENTINA: GARDEN PLASTICS MARKET, BY APPLICATION, 2022-2024 (KILOTON)
- TABLE 184 ARGENTINA: GARDEN PLASTICS MARKET, BY APPLICATION, 2025-2030 (KILOTON)
- TABLE 185 REST OF SOUTH AMERICA : GARDEN PLASTICS MARKET, BY APPLICATION, 2022-2024 (USD MILLION)
- TABLE 186 REST OF SOUTH AMERICA : GARDEN PLASTICS MARKET, BY APPLICATION, 2025-2030 (USD MILLION)
- TABLE 187 REST OF SOUTH AMERICA : GARDEN PLASTICS MARKET, BY APPLICATION, 2022-2024 (KILOTON)
- TABLE 188 REST OF SOUTH AMERICA : GARDEN PLASTICS MARKET, BY APPLICATION, 2025-2030 (KILOTON)
- TABLE 189 GARDEN PLASTICS MARKET: OVERVIEW OF MAJOR STRATEGIES ADOPTED BY KEY PLAYERS, JANUARY 2022-JULY 2025
- TABLE 190 GARDEN PLASTICS MARKET: DEGREE OF COMPETITION, 2024
- TABLE 191 GARDEN PLASTICS MARKET: REGION FOOTPRINT
- TABLE 192 GARDEN PLASTICS MARKET: TYPE FOOTPRINT
- TABLE 193 GARDEN PLASTICS MARKET: APPLICATION
- TABLE 194 GARDEN PLASTICS MARKET: COMPOSITION FOOTPRINT
- TABLE 195 GARDEN PLASTICS MARKET: DETAILED LIST OF KEY STARTUPS/SMES
- TABLE 196 GARDEN PLASTICS MARKET: COMPETITIVE BENCHMARKING OF KEY STARTUPS/SMES
- TABLE 197 GARDEN PLASTICS MARKET: PRODUCT LAUNCHES, JANUARY 2022-JULY 2025
- TABLE 198 GARDEN PLASTICS MARKET: DEALS, JANUARY 2022-JULY 2025
- TABLE 199 KETER: COMPANY OVERVIEW
- TABLE 200 KETER: PRODUCTS/SOLUTIONS/SERVICES OFFERED
- TABLE 201 KETER: PRODUCT LAUNCHES, JANUARY 2022-JULY 2025
- TABLE 202 KETER: DEALS, JANUARY 2022-JULY 2025
- TABLE 203 THE HC COMPANIES, INC.: COMPANY OVERVIEW
- TABLE 204 THE HC COMPANIES, INC.: PRODUCTS/SOLUTIONS/SERVICES OFFERED
- TABLE 205 THE HC COMPANIES, INC.: PRODUCT LAUNCHES, JANUARY 2022-JULY 2025
- TABLE 206 THE HC COMPANIES, INC.: DEALS, JANUARY 2022-JULY 2025
- TABLE 207 SCHEURICH GMBH & CO. KG: COMPANY OVERVIEW
- TABLE 208 SCHEURICH GMBH & CO. KG: PRODUCTS/SOLUTIONS/SERVICES OFFERED
- TABLE 209 SCHEURICH GMBH & CO. KG: DEALS, JANUARY 2022-JULY 2025
- TABLE 210 ELHO B.V.: COMPANY OVERVIEW
- TABLE 211 ELHO B.V.: PRODUCTS/SOLUTIONS/SERVICES OFFERED
- TABLE 212 ELHO B.V.: PRODUCT LAUNCHES, JANUARY 2022-JULY 2025
- TABLE 213 HORST BRANDSTATTER GROUP: COMPANY OVERVIEW
- TABLE 214 HORST BRANDSTATTER GROUP: PRODUCTS/SOLUTIONS/SERVICES OFFERED
- TABLE 215 GRIFFON CORPORATION INC.: COMPANY OVERVIEW
- TABLE 216 GRIFFON CORPORATION INC.: PRODUCTS/SOLUTIONS/SERVICES OFFERED
- TABLE 217 BERRY GLOBAL INC.: COMPANY OVERVIEW
- TABLE 218 BERRY GLOBAL INC.: PRODUCTS/SOLUTIONS/SERVICES OFFERED
- TABLE 219 BERRY GLOBAL INC.: DEALS, JANUARY 2022-JULY 2025
- TABLE 220 RKW GROUP: COMPANY OVERVIEW
- TABLE 221 RKW GROUP: PRODUCTS/SOLUTIONS/SERVICES OFFERED
- TABLE 222 BASF: COMPANY OVERVIEW
- TABLE 223 BASF: PRODUCTS/SOLUTIONS/SERVICES OFFERED
- TABLE 224 BASF: PRODUCT LAUNCHES, JANUARY 2022-JULY 2025
- TABLE 225 ARMANDO ALVAREZ GROUP: COMPANY OVERVIEW
- TABLE 226 ARMANDO ALVAREZ GROUP: PRODUCTS/SOLUTIONS/SERVICES OFFERED
- TABLE 227 LANDMARK PLASTIC INC.: COMPANY OVERVIEW
- TABLE 228 EAST JORDAN PLASTICS, INC.: COMPANY OVERVIEW
- TABLE 229 CREO GROUP: COMPANY OVERVIEW
- TABLE 230 T.O. PLASTICS, INC.: COMPANY OVERVIEW
- TABLE 231 CAPI EUROPE: COMPANY OVERVIEW
- TABLE 232 HARSHDEEP INDIA: COMPANY OVERVIEW
- TABLE 233 EURO3PLAST SPA: COMPANY OVERVIEW
- TABLE 234 SA PLASTIKOR (PTY) LTD.: COMPANY OVERVIEW
- TABLE 235 COSMOPLAST UAE : COMPANY OVERVIEW
- TABLE 236 FINOLEX PLASSON: COMPANY OVERVIEW
- TABLE 237 KISAN: COMPANY OVERVIEW
- TABLE 238 TAIZHOU SHENGERDA PLASTIC CO., LTD.: COMPANY OVERVIEW
- TABLE 239 HOSCO INDIA: COMPANY OVERVIEW
- TABLE 240 TAIZHOU KEDI PLASTIC CO., LTD.: COMPANY OVERVIEW
- TABLE 241 VIP PLASTICS: COMPANY OVERVIEW
List of Figures
- FIGURE 1 GARDEN PLASTICS MARKET SEGMENTATION
- FIGURE 2 GARDEN PLASTICS MARKET: RESEARCH DESIGN
- FIGURE 3 GARDEN PLASTICS MARKET: BOTTOM-UP APPROACH
- FIGURE 4 GARDEN PLASTICS MARKET: TOP-DOWN APPROACH
- FIGURE 5 GARDEN PLASTICS MARKET: DATA TRIANGULATION
- FIGURE 6 COMMODITY PLASTICS SEGMENT ESTIMATED TO DOMINATE MARKET IN 2025
- FIGURE 7 UNFILLED SEGMENT ESTIMATED TO DOMINATE MARKET IN 2025
- FIGURE 8 MULCH FILMS SEGMENT TO REGISTER HIGHEST CAGR DURING FORECAST PERIOD
- FIGURE 9 ASIA PACIFIC TO REGISTER HIGHEST CAGR DURING FORECAST PERIOD
- FIGURE 10 INCREASING GLOBAL EMPHASIS ON SUSTAINABLE AND ECO-FRIENDLY SOLUTIONS OFFERS SIGNIFICANT OPPORTUNITIES
- FIGURE 11 COMMODITY PLASTICS SEGMENT TO LEAD MARKET DURING FORECAST PERIOD
- FIGURE 12 UNFILLED SEGMENT TO DOMINATE MARKET DURING FORECAST PERIOD
- FIGURE 13 MULCH FILMS SEGMENT TO RECORD HIGHEST GROWTH DURING FORECAST PERIOD
- FIGURE 14 MARKET IN INDIA TO GROW AT HIGHEST CAGR DURING FORECAST PERIOD
- FIGURE 15 DRIVERS, RESTRAINTS, OPPORTUNITIES, AND CHALLENGES IN GARDEN PLASTICS MARKET
- FIGURE 16 URBAN POPULATION TREND (2000-2030)
- FIGURE 17 PORTER'S FIVE FORCES ANALYSIS OF GARDEN PLASTICS MARKET
- FIGURE 18 TRENDS/DISRUPTIONS IMPACTING CUSTOMER BUSINESS IN GARDEN PLASTICS MARKET
- FIGURE 19 GARDEN PLASTICS MARKET: ECOSYSTEM
- FIGURE 20 GARDEN PLASTICS MARKET: VALUE CHAIN ANALYSIS
- FIGURE 21 IMPORT DATA RELATED TO HS CODE 391733-COMPLIANT PRODUCTS, BY KEY COUNTRY, 2020-2024 (USD MILLION)
- FIGURE 22 EXPORT DATA RELATED TO HS CODE 391733-COMPLIANT PRODUCTS, BY KEY COUNTRY, 2020-2024 (USD MILLION)
- FIGURE 23 EXPORT DATA RELATED TO HS CODE 392690-COMPLIANT PRODUCTS, BY KEY COUNTRY, 2020-2024 (USD MILLION)
- FIGURE 24 IMPORT DATA RELATED TO HS CODE 392690-COMPLIANT PRODUCTS, BY KEY COUNTRY, 2020-2024 (USD MILLION)
- FIGURE 25 AVERAGE SELLING PRICE TREND OF GARDEN PLASTICS OFFERED BY KEY PLAYERS, 2024 (USD/KG)
- FIGURE 26 AVERAGE SELLING PRICE TREND OF GARDEN PLASTICS, BY REGION, 2024-2030 (USD/KG)
- FIGURE 27 GARDEN PLASTICS MARKET: GRANTED PATENTS, 2015-2024
- FIGURE 28 NUMBER OF PATENTS PER YEAR, 2015-2024
- FIGURE 29 LEGAL STATUS OF PATENTS, 2015-2024
- FIGURE 30 TOP JURISDICTION, BY DOCUMENT, 2015-2024
- FIGURE 31 TOP 10 PATENT APPLICANTS, 2015-2024
- FIGURE 32 GARDEN PLASTICS MARKET: INVESTOR DEALS AND FUNDING TRENDS, 2018-2024 (USD MILLION)
- FIGURE 33 INFLUENCE OF STAKEHOLDERS ON BUYING PROCESS, BY APPLICATION
- FIGURE 34 KEY BUYING CRITERIA FOR KEY APPLICATIONS
- FIGURE 35 COMMODITY PLASTICS TO BE LEADING PLASTIC TYPE SEGMENT DURING FORECAST PERIOD
- FIGURE 36 UNFILLED TO BE LARGEST SEGMENT OF GARDEN PLASTICS MARKET DURING FORECAST PERIOD
- FIGURE 37 MULCH FILMS SEGMENT ESTIMATED TO ACCOUNT FOR LARGEST MARKET SHARE IN 2025
- FIGURE 38 INDIA TO BE FASTEST-GROWING MARKET FOR GARDEN PLASTICS DURING FORECAST PERIOD
- FIGURE 39 NORTH AMERICA: GARDEN PLASTICS MARKET SNAPSHOT
- FIGURE 40 MULCH FILMS TO BE LARGEST APPLICATION SEGMENT IN EUROPE DURING FORECAST PERIOD
- FIGURE 41 ASIA PACIFIC: GARDEN PLASTICS MARKET SNAPSHOT
- FIGURE 42 GARDEN PLASTICS MARKET SHARE ANALYSIS, 2024
- FIGURE 43 GARDEN PLASTICS MARKET: REVENUE ANALYSIS OF KEY COMPANIES FOR LAST FIVE YEARS, 2020-2024 (USD BILLION)
- FIGURE 44 GARDEN PLASTICS MARKET: COMPANY VALUATION, 2024 (USD BILLION)
- FIGURE 45 GARDEN PLASTICS MARKET: FINANCIAL MATRIX: EV/EBITDA RATIO, 2024
- FIGURE 46 GARDEN PLASTICS MARKET: YEAR-TO-DATE PRICE AND FIVE-YEAR STOCK BETA, 2024
- FIGURE 47 GARDEN PLASTICS MARKET: PRODUCT/BRAND COMPARISON
- FIGURE 48 GARDEN PLASTICS MARKET: COMPANY EVALUATION MATRIX, KEY PLAYERS, 2024
- FIGURE 49 GARDEN PLASTICS MARKET: COMPANY FOOTPRINT
- FIGURE 50 GARDEN PLASTICS MARKET: COMPANY EVALUATION MATRIX, STARTUPS/SMES, 2024
- FIGURE 51 KETER: COMPANY SNAPSHOT
- FIGURE 52 GRIFFON CORPORATION INC.: COMPANY SNAPSHOT
- FIGURE 53 BERRY GLOBAL INC.: COMPANY SNAPSHOT
- FIGURE 54 BASF: COMPANY SNAPSHOT
 磁性塑膠市場:2026-2032年全球市場預測(按類型、樹脂類型、形狀、製造程序和磁性塑膠應用分類)
 2026-2030年全球塑膠市場
 塑膠市場規模、佔有率、趨勢和預測:按類型、應用、最終用戶和地區分類,2026-2034年塑膠市場:依形狀、等級、製造流程、類型、應用和分銷管道分類-2026-2032年全球市場預測
 塑膠市場分析及預測(至2035年):類型、產品、應用、材料類型、技術、最終用戶、製程、組件、安裝類型
 東南亞塑膠市場:市場佔有率分析、產業趨勢與統計、成長預測(2026-2031)泰國塑膠:市場佔有率分析、產業趨勢與統計、成長預測(2026-2031)越南塑膠市場:市場佔有率分析、產業趨勢與統計、成長預測(2026-2031)
 2026-2034年全球塑膠分解細菌市場規模、佔有率、趨勢和成長分析報告2026-2034年全球電氣設備塑膠市場規模、佔有率、趨勢和成長分析報告