


 |
市場調查報告書
商品編碼
1795411
全球超級電容市場(按類型、電容範圍、最終用途和地區)預測(至 2030 年)Supercapacitor Market by Type, Capacitance Range, Electrode Material - Global Forecast to 2030 |
||||||
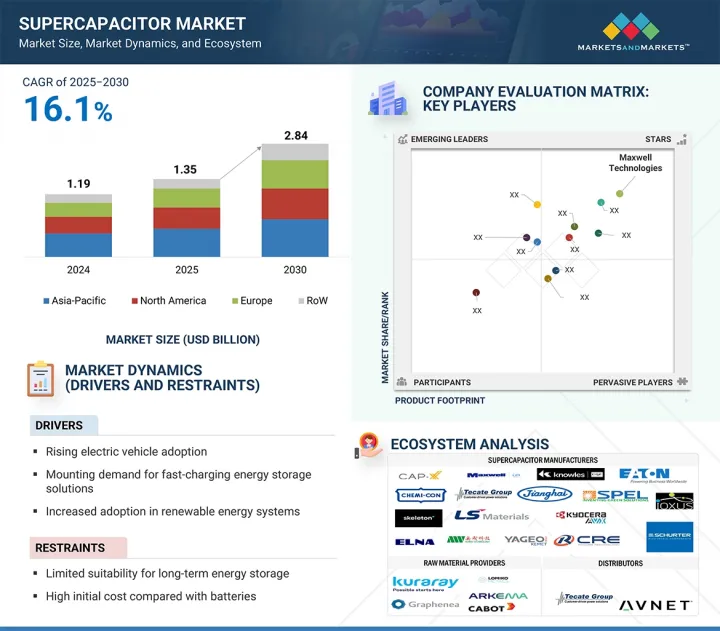
全球超級電容市場預計將從 2025 年的 13.5 億美元成長到 2030 年的 28.4 億美元,複合年成長率為 16.1%。
汽車產業繼續成為主要驅動力,超級電容因其能夠支援快速充放電循環和峰值功率需求,在電動車(EV)、混合動力系統和啟動停止應用中的應用日益廣泛。
| 調查範圍 | |
|---|---|
| 調查年份 | 2021-2030 |
| 基準年 | 2024 |
| 預測期 | 2025-2030 |
| 對價單位 | 金額(十億美元) |
| 按細分市場 | 按類型、電容範圍、最終用途和地區 |
| 目標區域 | 北美、歐洲、亞太地區及其他地區 |
除了移動出行領域,家用電器、工業自動化和能源領域的需求也在不斷成長,這些領域要求高功率密度、更長的循環壽命和快速反應。超級電容正部署在備用電源系統、電壓穩定和電網側能源儲存,尤其是在可再生能源併網領域。在攜帶式設備和物聯網基礎設施中,它們提供快速充電、長壽命和可靠的效能。電極材料的技術進步,尤其是碳基和混合設計,正在提高能量密度,並擴大其在更廣泛應用中的效用。隨著各行各業越來越重視電氣化、效率和彈性,對高效能超級電容解決方案的需求將在各個終端應用領域顯著成長。
1,000 F+ 細分市場預計將在預測期內呈現最高的複合年成長率,因為其在需要高能源儲存緩衝、快速充電/放電循環和長壽命的應用中的作用不斷擴大。這些高容量超級電容擴大被用於傳統電池無法滿足突波功率和壽命要求的領域,例如電網儲能、軌道交通、工業自動化和備用電源系統。它們在惡劣使用條件下表現穩定,且維護需求減少,使其成為任務關鍵型高負載環境的理想選擇。此外,將 1,000 F+ 電池整合到混合能源系統(尤其是微電網和再生煞車解決方案)的持續努力,進一步加速了它們的採用。這種成長也得益於對大尺寸尺寸超級電容器模組的投資,這些外形規格處理高電壓和能量吞吐量。隨著各行各業優先考慮效率、運作和電源可靠性,預計這一細分市場將呈現最強勁的成長軌跡。
受電動和混合動力汽車對高效能源儲存和快速供電需求不斷成長的推動,汽車和運輸行業預計將在預測期內引領超級電容市場。超級電容擴大被整合到車輛系統中,用於再生煞車、啟動停止系統和電源穩定等功能,並且在更長的使用壽命、更高的功率密度和更好的低溫性能方面比傳統電池更具優勢。在商用車隊、火車和電動公車中,超級電容能夠實現快速的能源回收和更短的充電週期,這與全球減少排放和提高燃油效率的努力一致。向電氣化的轉變、政府的支持性法規以及對永續行動基礎設施的投資正在為超級電容技術創造巨大的成長機會。隨著原始設備製造商優先考慮輕量、高效的能源系統,預計該產業將引領市場。
預計在預測期內,亞太地區的超級電容市場複合年成長率最高,這得益於工業活動加速、對節能技術的需求不斷成長以及電動車 (EV) 普及率不斷提高。中國、日本、韓國和印度等國家在交通運輸、家電和可再生能源等關鍵領域部署超級電容方面處於領先地位。中國是電動車生產和電池製造的全球領導者,為該地區的需求做出了重大貢獻。同時,日本和韓國持續投資高性能能源儲存技術。同時,東南亞正在進行的公共交通電氣化和電網現代化進一步增強了該地區的前景。憑藉熟練的製造地和不斷成長的國內可攜式電子產品和汽車技術消費,亞太地區完全有能力成為未來幾年超級電容市場擴張的主要驅動力。
本報告研究了全球超級電容市場,並按類型、電容範圍、最終用途、區域趨勢和參與市場的公司概況對其進行細分。
目錄
第1章 引言
第2章調查方法
第3章執行摘要
第4章重要考察
第5章市場概述
- 介紹
- 市場動態
- 價值鏈分析
- 定價分析
- 生態系分析
- 技術分析
- 案例研究分析
- 貿易分析
- 專利分析
- 人工智慧對超級電容市場的影響
- 2025年美國關稅對超級電容市場的影響
第6章超級電容電極材料
- 介紹
- 碳
- 複合材料
- 其他電極材料
第7章超級電容市場(按類型)
- 介紹
- 電雙層電容器
- 混合電容器
- 偽電容器(定性)
第8章超級電容市場(依電容範圍)
- 介紹
- 低於 100F
- 100~1,000F
- 超過 1,000F
第9章超級電容市場(依最終用途)
- 介紹
- 汽車和運輸
- 能源與電力
- 家電
- 工業
- 其他
第 10 章超級電容市場(按區域)
- 介紹
- 北美洲
- 美國
- 加拿大
- 墨西哥
- 歐洲
- 德國
- 英國
- 法國
- 義大利
- 其他
- 亞太地區
- 中國
- 日本
- 韓國
- 印度
- 其他
- 其他地區
- 南美洲
- 中東
- 非洲
第11章競爭格局
- 概述
- 主要參與企業的策略/優勢,2021-2025
- 2024年市場佔有率分析
- 2020-2024年收益分析
- 公司估值矩陣:2024 年關鍵參與企業
- 公司估值矩陣:Start-Ups/中小企業,2024 年
- 競爭場景
第12章:公司簡介
- 主要參與企業
- MAXWELL TECHNOLOGIES
- LS MATERIALS
- NIPPON CHEMI-CON CORPORATION
- EATON
- CAP-XX
- TECATE GROUP
- CORNELL DUBILIER
- IOXUS
- SKELETON TECHNOLOGIES
- KORCHIP CORPORATION
- NANTONG JIANGHAI CAPACITOR CO., LTD.
- 其他公司
- KYOCERA AVX COMPONENTS CORPORATION
- KEMET CORPORATION
- SPEL TECHNOLOGIES PRIVATE LTD.
- VINATECH CO., LTD.
- KELTRON COMPONENT COMPLEX LTD
- WUXI CRE NEW ENERGY TECHNOLOGY CO., LTD.
- JINZHOU KAIMEI POWER CO.LTD
- SHENZHEN CHUANGSHIDING ELECTRONICS CO.,LTD
- ELNA CO., LTD.
- AOWEI TECHNOLOGY SHANGHAI
- ZHONGTIAN SUPERCAPACITOR TECHNOLOGY CO., LTD.
- SCHURTER
- SHANGHAI GREEN TECH CO., LTD.
- WURTH ELEKTRONIK EISOS GMBH & CO. KG
第13章 附錄
At a CAGR of 16.1%, the global supercapacitor market is projected to grow from USD 1.35 billion in 2025 to USD 2.84 billion by 2030. The automotive sector remains the primary driver, with supercapacitors increasingly adopted in electric vehicles (EVs), hybrid systems, and start-stop applications to support rapid charge-discharge cycles and peak power demands.
| Scope of the Report | |
|---|---|
| Years Considered for the Study | 2021-2030 |
| Base Year | 2024 |
| Forecast Period | 2025-2030 |
| Units Considered | Value (USD Billion) |
| Segments | By Type, Capacitance Range, End User, and Region |
| Regions covered | North America, Europe, APAC, RoW |
Beyond mobility, demand is also rising across consumer electronics, industrial automation, and energy sectors where the need for high-power density, extended cycle life, and fast response times is critical. Supercapacitors are deployed in backup power systems, voltage stabilization, and grid-side energy storage, especially in renewable integrations. In portable devices and IoT infrastructure, they offer quick charging, extended lifespan, and reliable performance. Technological advancements in electrode materials, particularly carbon-based and hybrid designs, improve energy density and expand their utility across broader applications. As industries increasingly prioritize electrification, efficiency, and resilience, the demand for high-performance supercapacitor solutions is set to grow significantly across diverse end-use segments.
">1,000 F segment is projected to exhibit the highest CAGR between 2025 and 2030."
The >1,000 F segment is expected to witness the highest CAGR during the forecast period, driven by its expanding role in applications that demand high energy buffering, rapid charge-discharge cycles, and extended service life. These high-capacitance supercapacitors are increasingly adopted in sectors such as grid energy storage, rail transportation, industrial automation, and backup power systems, where conventional batteries fall short in meeting surge power and longevity requirements. Their ability to deliver stable performance in extreme operating conditions and reduce maintenance needs makes them ideal for mission-critical and high-load environments. Additionally, ongoing efforts to integrate >1,000 F into hybrid energy systems, particularly in microgrids and regenerative braking solutions, further accelerate their adoption. The growth is also supported by investments in large-format supercapacitor modules designed to handle higher voltages and energy throughput in compact form factors. As industries prioritize efficiency, uptime, and power reliability, this segment is set to witness the strongest growth trajectory.
"Automotive & transportation segment to account for the largest share of the supercapacitor market during the forecast period."
The automotive & transportation segment is projected to lead the supercapacitor market during the forecast period, fueled by the rising demand for efficient energy storage and rapid power delivery in electric and hybrid vehicles. Supercapacitors are increasingly integrated into vehicle systems for functions such as regenerative braking, start-stop systems, and power stabilization, offering advantages over traditional batteries in terms of longer lifecycle, higher power density, and superior low-temperature performance. In commercial fleets, railways, and electric buses, supercapacitors enable rapid energy recovery and short charging cycles, aligning with global efforts to reduce emissions and enhance fuel economy. The shift toward electrification, supportive government regulations, and investment in sustainable mobility infrastructure creates substantial growth opportunities for supercapacitor technologies. As OEMs prioritize lightweight, high-efficiency energy systems, the segment is expected to lead the market.
"Asia Pacific is expected to register the highest CAGR in the supercapacitor market from 2025 to 2030."
Asia Pacific is expected to register the highest CAGR in the supercapacitor market during the forecast period, fueled by accelerating industrial activity, growing demand for energy-efficient technologies, and rising adoption of electric vehicles (EVs). Countries such as China, Japan, South Korea, and India are at the forefront of deploying supercapacitors across key sectors, including transportation, consumer electronics, and renewable energy. China, being the global leader in EV production and battery manufacturing, is significantly contributing to the regional demand. At the same time, Japan and South Korea continue to invest in high-performance energy storage technologies. Meanwhile, the electrification of public transport systems and grid modernization efforts in Southeast Asia further enhance the regional outlook. The availability of skilled manufacturing hubs and expanding domestic consumption of portable electronics and automotive technologies position Asia Pacific as a key driver for supercapacitor market expansion over the coming years.
Breakdown of primaries
Various executives from key organizations operating in the Supercapacitor market were interviewed in-depth, including CEOs, marketing directors, and innovation and technology directors.
- By Company Type: Tier 1 -45%, Tier 2 - 35%, and Tier 3 - 20%
- By Designation: Directors - 45%, C-level - 30%, and Others - 25%
- By Region: Asia Pacific - 45%, North America - 25%, Europe - 20%, and RoW - 10%
Note: Other designations include sales and product managers. The three tiers of the companies are defined based on their total revenue in 2024: Tier 1 - revenue greater than or equal to USD 500 million; Tier 2 - revenue between USD 100 million and USD 500 million; and Tier 3 revenue less than or equal to USD 100 million.
Major players profiled in this report are as follows: Maxwell Technologies (US), LS Materials (South Korea), Nippon Chemi-Con Corporation (Japan), Eaton (Ireland), CAP-XX (Australia), Nantong Jianghai capacitor Co., Ltd.(China), KYOCERA AVX Components Corporation (US), KEMET Corporation (US), Tecate Group (US), Cornell Dubilier (US), IOXUS (US), Skeleton Technologies (Estonia), KORCHIP CORPORATION (South Korea), Jinzhou Kaimei Power Co.Ltd (China), ELNA CO., LTD. (Japan), SCHURTER (Switzerland), Zhongtian Supercapacitor Technology Co., Ltd. (China), VINATech Co.,Ltd. (South Korea), Wurth Elektronik eiSos GmbH & Co. KG (Germany), AOWEI TECHNOLOGY Shanghai (China), Wuxi CRE New Energy Technology Co., Ltd. (China), SPEL TECHNOLOGIES PRIVATE LIMITED (India), shenzhen chuangshiding electronics co.,ltd, (China), Shanghai Green Tech Co.,Ltd. (China) and Keltron Component Complex Ltd (India). These leading companies possess a wide portfolio of products, establishing a prominent presence in established as well as emerging markets.
The study provides a detailed competitive analysis of these key players in the supercapacitor market, presenting their company profiles, most recent developments, and key market strategies.
Research Coverage
In this report, the supercapacitor market has been segmented based on type, capacitance range, end user, and region. The type segment includes electric double layer capacitors (EDLCs) and hybrid capacitors. The capacitance range segment is categorized into <100 F, 100-1,000 F, and >1,000 F. Based on end users, the market is segmented into consumer electronics, automotive & transportation, energy & power, industrial, and other end users (aerospace and medical devices). The regional analysis covers North America, Europe, Asia Pacific, and RoW.
Reasons to buy the report
The report will help the leaders/new entrants in this market with information on the closest approximations of the revenue numbers for the overall market and the sub-segments. This report will help stakeholders understand the competitive landscape and gain more insights to position their businesses better and plan suitable go-to-market strategies. The report also helps stakeholders understand the supercapacitor market's pulse and provides information on key market drivers, restraints, challenges, and opportunities.
Key Benefits of Buying the Report
- Analysis of key drivers (Rising EV Adoption, Rising Demand for Fast-Charging Energy Storage Solutions, Increased Adoption in Renewable Energy Systems, Rising Industrial Automation and Robotics, High Power Density Enabling Instantaneous Energy Delivery), restraints (Limited Suitability for Long-Term Energy Storage, High Initial Cost Compared to Batteries), opportunities (Expanding Integration of Supercapacitors in Next-Generation Aircraft Systems, Rising Use of Supercapacitors as a Sustainable Alternative to Conventional Batteries, Advancements in Materials and Manufacturing Technologies, Emerging Applications in Wearables and IoT Devices), and challenges (Lack of Standardization Across Manufacturers, Temperature Sensitivity and Durability Concerns) influencing the growth of the supercapacitor market.
- Product Development/Innovation: Detailed insights on upcoming technologies, research and development activities, and new product launches in the supercapacitor market.
- Market Development: Comprehensive information about lucrative markets-the report analyses the supercapacitor market across varied regions.
- Market Diversification: Exhaustive information about new products/services, untapped geographies, recent developments, and investments in the supercapacitor market.
- Competitive Assessment: In-depth assessment of market shares, growth strategies, and service offerings of leading players, such as Maxwell Technologies (US), LS Materials (South Korea), Nippon Chemi-Con Corporation (Japan), Eaton (Ireland), and CAP-XX (Australia).
TABLE OF CONTENTS
1 INTRODUCTION
- 1.1 STUDY OBJECTIVES
- 1.2 MARKET DEFINITION
- 1.3 STUDY SCOPE
- 1.3.1 MARKETS COVERED AND REGIONAL SCOPE
- 1.3.2 YEARS CONSIDERED
- 1.3.3 INCLUSIONS AND EXCLUSIONS
- 1.4 CURRENCY CONSIDERED
- 1.5 UNIT CONSIDERED
- 1.6 STAKEHOLDERS
- 1.7 LIMITATIONS
- 1.8 SUMMARY OF CHANGES
2 RESEARCH METHODOLOGY
- 2.1 RESEARCH DATA
- 2.1.1 SECONDARY AND PRIMARY RESEARCH
- 2.1.2 SECONDARY DATA
- 2.1.2.1 List of key secondary sources
- 2.1.2.2 Key data from secondary sources
- 2.1.3 PRIMARY DATA
- 2.1.3.1 Key data from primary sources
- 2.1.3.2 Key industry insights
- 2.1.3.3 List of primary interview participants
- 2.1.3.4 Breakdown of primaries
- 2.2 MARKET SIZE ESTIMATION
- 2.2.1 BOTTOM-UP APPROACH
- 2.2.1.1 Approach to arrive at market size using bottom-up analysis (demand side)
- 2.2.2 TOP-DOWN APPROACH
- 2.2.2.1 Approach to arrive at market size using top-down analysis (supply side)
- 2.2.1 BOTTOM-UP APPROACH
- 2.3 MARKET BREAKDOWN AND DATA TRIANGULATION
- 2.4 RESEARCH ASSUMPTIONS
- 2.5 RESEARCH LIMITATIONS
- 2.6 RISK ANALYSIS
3 EXECUTIVE SUMMARY
4 PREMIUM INSIGHTS
- 4.1 ATTRACTIVE OPPORTUNITIES FOR PLAYERS IN SUPERCAPACITOR MARKET
- 4.2 SUPERCAPACITOR MARKET, BY TYPE
- 4.3 SUPERCAPACITOR MARKET, BY CAPACITANCE RANGE
- 4.4 SUPERCAPACITOR MARKET, BY END USE
- 4.5 SUPERCAPACITOR MARKET, BY GEOGRAPHY
5 MARKET OVERVIEW
- 5.1 INTRODUCTION
- 5.2 MARKET DYNAMICS
- 5.2.1 DRIVERS
- 5.2.1.1 Increasing need for advanced energy storage components for electric vehicles
- 5.2.1.2 Mounting demand for fast-charging energy storage solutions
- 5.2.1.3 Rapid expansion of renewable energy capacity
- 5.2.1.4 Growing focus on automation to optimize industrial operations
- 5.2.1.5 Increasing demand for fast and efficient energy delivery in industries
- 5.2.2 RESTRAINTS
- 5.2.2.1 Limited suitability for long-term energy storage
- 5.2.2.2 High initial costs compared with conventional batteries
- 5.2.3 OPPORTUNITIES
- 5.2.3.1 Rising integration of supercapacitors into next-generation aircraft systems
- 5.2.3.2 Emergence of supercapacitors as sustainable alternative to smaller conventional batteries
- 5.2.3.3 Continuous innovation in materials science and manufacturing processes
- 5.2.3.4 Mounting deployment of wearables and IoT devices
- 5.2.4 CHALLENGES
- 5.2.4.1 Lack of standardized performance benchmarks, testing protocols, and safety certifications
- 5.2.4.2 Temperature sensitivity and durability concerns
- 5.2.1 DRIVERS
- 5.3 VALUE CHAIN ANALYSIS
- 5.4 PRICING ANALYSIS
- 5.4.1 PRICING RANGE OF SUPERCAPACITOR CELLS OFFERED BY KEY PLAYERS, 2024
- 5.4.2 AVERAGE SELLING PRICE TREND OF SUPERCAPACITOR CELLS, BY CAPACITANCE RANGE, 2021-2024
- 5.4.3 AVERAGE SELLING PRICE TREND OF <100 F SUPERCAPACITOR CELLS, BY REGION, 2021-2024
- 5.5 ECOSYSTEM ANALYSIS
- 5.6 TECHNOLOGY ANALYSIS
- 5.6.1 KEY TECHNOLOGIES
- 5.6.1.1 Advanced electrode materials
- 5.6.1.2 Solid-state electrolytes
- 5.6.2 COMPLEMENTARY TECHNOLOGIES
- 5.6.2.1 Regenerative braking systems
- 5.6.2.2 Wireless charging systems
- 5.6.3 ADJACENT TECHNOLOGIES
- 5.6.3.1 Lithium-ion batteries
- 5.6.3.2 Power electronics
- 5.6.1 KEY TECHNOLOGIES
- 5.7 CASE STUDY ANALYSIS
- 5.7.1 247 ENERGY AND CE+T POWER HELP INTEGRATE SUPERCAPACITOR-BASED ENERGY STORAGE SYSTEMS IN LOGISTICS COMPANY IN NETHERLANDS
- 5.7.2 NIDEC CONVERSION DESIGNS PROPULSION SYSTEM POWERED BY 128 SUPERCAPACITORS FOR ALL-ELECTRIC PASSENGER FERRY IN FRANCE
- 5.7.3 MATERIAL HANDLING OEM INTEGRATES EATON'S XTM-18 SUPERCAPACITOR MODULES TO OPTIMIZE WAREHOUSE AUTOMATION
- 5.8 TRADE ANALYSIS
- 5.8.1 IMPORT SCENARIO (HS CODE 853229)
- 5.8.2 EXPORT SCENARIO (HS CODE 853229)
- 5.9 PATENT ANALYSIS
- 5.10 IMPACT OF AI ON SUPERCAPACITOR MARKET
- 5.10.1 INTRODUCTION
- 5.10.2 IMPACT OF AI ON KEY END USES OF SUPERCAPACITORS
- 5.10.2.1 Automotive
- 5.10.2.2 Energy storage
- 5.10.2.3 Industrial
- 5.10.3 AI USE CASES IN SUPERCAPACITOR MARKET
- 5.10.4 FUTURE OF AI IN SUPERCAPACITOR ECOSYSTEM
- 5.11 IMPACT OF 2025 US TARIFF ON SUPERCAPACITOR MARKET
- 5.11.1 INTRODUCTION
- 5.11.2 KEY TARIFF RATES
- 5.11.3 PRICE IMPACT ANALYSIS
- 5.11.4 IMPACT ON COUNTRIES/REGIONS
- 5.11.4.1 US
- 5.11.4.2 Europe
- 5.11.4.3 Asia Pacific
- 5.11.5 IMPACT ON END USES
6 ELECTRODE MATERIALS FOR SUPERCAPACITORS
- 6.1 INTRODUCTION
- 6.2 CARBON
- 6.2.1 ACTIVATED CARBON
- 6.2.2 CARBON NANOTUBES
- 6.2.3 GRAPHENE
- 6.2.4 CARBIDE-DERIVED CARBON
- 6.2.5 CARBON AEROGELS
- 6.3 COMPOSITES
- 6.3.1 CARBON-METAL OXIDE
- 6.3.2 CARBON CONDUCTING POLYMERS
- 6.4 OTHER ELECTRODE MATERIALS
- 6.4.1 METAL OXIDES
- 6.4.1.1 Ruthenium oxide
- 6.4.1.2 Nickel oxide
- 6.4.1.3 Manganese oxide
- 6.4.2 CONDUCTING POLYMERS
- 6.4.2.1 Polyaniline
- 6.4.2.2 Polypyrrole
- 6.4.2.3 Polyacene
- 6.4.2.4 Polyacetylene
- 6.4.1 METAL OXIDES
7 SUPERCAPACITOR MARKET, BY TYPE
- 7.1 INTRODUCTION
- 7.2 ELECTRIC DOUBLE-LAYER CAPACITORS
- 7.2.1 SURGING ADOPTION OF ELECTRIC VEHICLES AND TECHNOLOGICAL ADVANCEMENTS TO FUEL SEGMENTAL GROWTH
- 7.3 HYBRID CAPACITORS
- 7.3.1 INCREASING PRODUCTION FOR COMPACT, HIGH-DEMAND APPLICATIONS TO DRIVE MARKET
- 7.4 PSEUDOCAPACITORS (QUALITATIVE)
8 SUPERCAPACITOR MARKET, BY CAPACITANCE RANGE
- 8.1 INTRODUCTION
- 8.2 <100 F
- 8.2.1 HIGH EFFECTIVENESS IN DEVICES REQUIRING RAPID ENERGY DISCHARGE AND MINIMAL MAINTENANCE TO FUEL SEGMENTAL GROWTH
- 8.3 100-1,000 F
- 8.3.1 IDEAL BALANCE OF ENERGY DENSITY, POWER OUTPUT, AND DESIGN FLEXIBILITY TO CONTRIBUTE TO SEGMENTAL GROWTH
- 8.4 >1,000 F
- 8.4.1 ABILITY TO OFFER RAPID ENERGY BURSTS AND LOAD BALANCING TO BOLSTER SEGMENTAL GROWTH
9 SUPERCAPACITOR MARKET, BY END USE
- 9.1 INTRODUCTION
- 9.2 AUTOMOTIVE & TRANSPORTATION
- 9.2.1 ABILITY TO IMPROVE ACCELERATION, REDUCE STRESS, AND EXTEND LIFE OF BATTERIES TO DRIVE MARKET
- 9.3 ENERGY & POWER
- 9.3.1 INCREASING INVESTMENT IN BATTERY SYSTEMS AND RENEWABLE ENERGY ADOPTION TO DRIVE MARKET
- 9.4 CONSUMER ELECTRONICS
- 9.4.1 RISING ADOPTION OF SUPERCAPACITORS TO ENHANCE POWER EFFICIENCY AND REDUCE BATTERY STRESS TO BOOST SEGMENTAL GROWTH
- 9.5 INDUSTRIAL
- 9.5.1 INCREASING USE OF SUPERCAPACITORS TO ENHANCE RELIABILITY AND BACKUP POWER PERFORMANCE TO AUGMENT SEGMENTAL GROWTH
- 9.6 OTHER END USES
10 SUPERCAPACITOR MARKET, BY REGION
- 10.1 INTRODUCTION
- 10.2 NORTH AMERICA
- 10.2.1 US
- 10.2.1.1 Rising adoption of plug-in electric vehicles to contribute to market growth
- 10.2.2 CANADA
- 10.2.2.1 Increasing investment in renewable energy and transportation infrastructure to accelerate market growth
- 10.2.3 MEXICO
- 10.2.3.1 Escalating sales of hybrid and fully electric vehicles to bolster market growth
- 10.2.1 US
- 10.3 EUROPE
- 10.3.1 GERMANY
- 10.3.1.1 Rising advanced manufacturing and aerospace innovation to expedite market growth
- 10.3.2 UK
- 10.3.2.1 Supportive medical device regulatory frameworks to contribute to market growth
- 10.3.3 FRANCE
- 10.3.3.1 Increasing investment in next-generation energy storage solutions to boost market growth
- 10.3.4 ITALY
- 10.3.4.1 Growing emphasis on sustainable urban mobility and modernization of public transport systems to drive market
- 10.3.5 REST OF EUROPE
- 10.3.1 GERMANY
- 10.4 ASIA PACIFIC
- 10.4.1 CHINA
- 10.4.1.1 Strong focus on industrialization and digital infrastructure development to augment market growth
- 10.4.2 JAPAN
- 10.4.2.1 Mounting automobile production to contribute to market growth
- 10.4.3 SOUTH KOREA
- 10.4.3.1 Increasing R&D spending to support manufacturing innovation to fuel market growth
- 10.4.4 INDIA
- 10.4.4.1 Ongoing energy transition and infrastructure modernization to drive market
- 10.4.5 REST OF ASIA PACIFIC
- 10.4.1 CHINA
- 10.5 ROW
- 10.5.1 SOUTH AMERICA
- 10.5.1.1 Government support for clean energy to augment market growth
- 10.5.2 MIDDLE EAST
- 10.5.2.1 Increasing investment in renewable energy, electric mobility, and smart infrastructure to drive market
- 10.5.2.2 GCC countries
- 10.5.2.3 Rest of Middle East
- 10.5.3 AFRICA
- 10.5.3.1 Rapid urbanization and thriving automotive sector to bolster market growth
- 10.5.1 SOUTH AMERICA
11 COMPETITIVE LANDSCAPE
- 11.1 OVERVIEW
- 11.2 KEY PLAYER STRATEGIES/RIGHT TO WIN, 2021-2025
- 11.3 MARKET SHARE ANALYSIS, 2024
- 11.4 REVENUE ANALYSIS, 2020-2024
- 11.5 COMPANY EVALUATION MATRIX: KEY PLAYERS, 2024
- 11.5.1 STARS
- 11.5.2 EMERGING LEADERS
- 11.5.3 PERVASIVE PLAYERS
- 11.5.4 PARTICIPANTS
- 11.5.5 COMPANY FOOTPRINT: KEY PLAYERS, 2024
- 11.5.5.1 Company footprint
- 11.5.5.2 Region footprint
- 11.5.5.3 Type footprint
- 11.5.5.4 Capacitance range footprint
- 11.5.5.5 End use footprint
- 11.6 COMPANY EVALUATION MATRIX: STARTUPS/SMES, 2024
- 11.6.1 PROGRESSIVE COMPANIES
- 11.6.2 RESPONSIVE COMPANIES
- 11.6.3 DYNAMIC COMPANIES
- 11.6.4 STARTING BLOCKS
- 11.7 COMPETITIVE SCENARIO
- 11.7.1 PRODUCT LAUNCHES
- 11.7.2 DEALS
12 COMPANY PROFILES
- 12.1 KEY PLAYERS
- 12.1.1 MAXWELL TECHNOLOGIES
- 12.1.1.1 Business overview
- 12.1.1.2 Products/Solutions/Services offered
- 12.1.1.3 MnM view
- 12.1.1.3.1 Key strengths/Right to win
- 12.1.1.3.2 Strategic choices
- 12.1.1.3.3 Weaknesses/Competitive threats
- 12.1.2 LS MATERIALS
- 12.1.2.1 Business overview
- 12.1.2.2 Products/Solutions/Services offered
- 12.1.2.3 Recent developments
- 12.1.2.3.1 Product launches
- 12.1.2.4 MnM view
- 12.1.2.4.1 Key strengths/Right to win
- 12.1.2.4.2 Strategic choices
- 12.1.2.4.3 Weaknesses/Competitive threats
- 12.1.3 NIPPON CHEMI-CON CORPORATION
- 12.1.3.1 Business overview
- 12.1.3.2 Products/Solutions/Services offered
- 12.1.3.3 Recent developments
- 12.1.3.3.1 Product launches
- 12.1.3.3.2 Deals
- 12.1.3.4 MnM view
- 12.1.3.4.1 Key strengths/Right to win
- 12.1.3.4.2 Strategic choices
- 12.1.3.4.3 Weaknesses/Competitive threats
- 12.1.4 EATON
- 12.1.4.1 Business overview
- 12.1.4.2 Products/Solutions/Services offered
- 12.1.4.3 Recent developments
- 12.1.4.3.1 Deals
- 12.1.4.4 MnM view
- 12.1.4.4.1 Key strengths/Right to win
- 12.1.4.4.2 Strategic choices
- 12.1.4.4.3 Weaknesses/Competitive threats
- 12.1.5 CAP-XX
- 12.1.5.1 Business overview
- 12.1.5.2 Products/Solutions/Services offered
- 12.1.5.3 Recent developments
- 12.1.5.3.1 Deals
- 12.1.5.3.2 Other developments
- 12.1.5.4 MnM view
- 12.1.5.4.1 Key strengths/Right to win
- 12.1.5.4.2 Strategic choices
- 12.1.5.4.3 Weaknesses/Competitive threats
- 12.1.6 TECATE GROUP
- 12.1.6.1 Business overview
- 12.1.6.2 Products/Solutions/Services offered
- 12.1.7 CORNELL DUBILIER
- 12.1.7.1 Business overview
- 12.1.7.2 Products/Solutions/Services offered
- 12.1.7.3 Recent developments
- 12.1.7.3.1 Deals
- 12.1.8 IOXUS
- 12.1.8.1 Business overview
- 12.1.8.2 Products/Solutions/Services offered
- 12.1.9 SKELETON TECHNOLOGIES
- 12.1.9.1 Business overview
- 12.1.9.2 Products/Solutions/Services offered
- 12.1.9.3 Recent developments
- 12.1.9.3.1 Product launches
- 12.1.9.3.2 Deals
- 12.1.9.3.3 Expansions
- 12.1.9.3.4 Other developments
- 12.1.10 KORCHIP CORPORATION
- 12.1.10.1 Business overview
- 12.1.10.2 Products/Solutions/Services offered
- 12.1.11 NANTONG JIANGHAI CAPACITOR CO., LTD.
- 12.1.11.1 Business overview
- 12.1.11.2 Products/Solutions/Services offered
- 12.1.1 MAXWELL TECHNOLOGIES
- 12.2 OTHER PLAYERS
- 12.2.1 KYOCERA AVX COMPONENTS CORPORATION
- 12.2.2 KEMET CORPORATION
- 12.2.3 SPEL TECHNOLOGIES PRIVATE LTD.
- 12.2.4 VINATECH CO., LTD.
- 12.2.5 KELTRON COMPONENT COMPLEX LTD
- 12.2.6 WUXI CRE NEW ENERGY TECHNOLOGY CO., LTD.
- 12.2.7 JINZHOU KAIMEI POWER CO.LTD
- 12.2.8 SHENZHEN CHUANGSHIDING ELECTRONICS CO.,LTD
- 12.2.9 ELNA CO., LTD.
- 12.2.10 AOWEI TECHNOLOGY SHANGHAI
- 12.2.11 ZHONGTIAN SUPERCAPACITOR TECHNOLOGY CO., LTD.
- 12.2.12 SCHURTER
- 12.2.13 SHANGHAI GREEN TECH CO., LTD.
- 12.2.14 WURTH ELEKTRONIK EISOS GMBH & CO. KG
13 APPENDIX
- 13.1 DISCUSSION GUIDE
- 13.2 KNOWLEDGESTORE: MARKETSANDMARKETS' SUBSCRIPTION PORTAL
- 13.3 CUSTOMIZATION OPTIONS
- 13.4 RELATED REPORTS
- 13.5 AUTHOR DETAILS
List of Tables
- TABLE 1 INCLUSIONS AND EXCLUSIONS IN SUPERCAPACITOR MARKET REPORT
- TABLE 2 MAJOR SECONDARY SOURCES
- TABLE 3 PRIMARY INTERVIEW PARTICIPANT DETAILS, BY COMPANY/ORGANIZATION
- TABLE 4 SUPERCAPACITOR MARKET: RESEARCH ASSUMPTIONS
- TABLE 5 SUPERCAPACITOR MARKET: RISK ANALYSIS
- TABLE 6 COMPARISON BETWEEN SUPERCAPACITORS, ORDINARY CAPACITORS, AND BATTERIES
- TABLE 7 PRICING RANGE OF SUPERCAPACITOR CELLS OFFERED BY KEY PLAYERS, 2024
- TABLE 8 AVERAGE SELLING PRICE TREND OF SUPERCAPACITOR CELLS, BY CAPACITANCE RANGE, 2021-2024 (USD)
- TABLE 9 AVERAGE SELLING PRICE TREND OF <100 F SUPERCAPACITOR CELLS, BY REGION, 2021-2024 (USD)
- TABLE 10 ROLE OF COMPANIES IN SUPERCAPACITOR ECOSYSTEM
- TABLE 11 IMPORT DATA FOR HS CODE 853229-COMPLIANT PRODUCTS, BY COUNTRY, 2020-2024 (USD MILLION)
- TABLE 12 EXPORT DATA FOR HS CODE 853229-COMPLIANT PRODUCTS, BY COUNTRY, 2020-2024 (USD MILLION)
- TABLE 13 LIST OF MAJOR PATENTS, 2021-2024
- TABLE 14 US-ADJUSTED RECIPROCAL TARIFF RATES
- TABLE 15 SUPERCAPACITOR MARKET, BY TYPE, 2021-2024 (USD MILLION)
- TABLE 16 SUPERCAPACITOR MARKET, BY TYPE, 2025-2030 (USD MILLION)
- TABLE 17 ELECTRIC DOUBLE-LAYER CAPACITORS: SUPERCAPACITOR MARKET, BY END USE, 2021-2024 (USD MILLION)
- TABLE 18 ELECTRIC DOUBLE-LAYER CAPACITORS: SUPERCAPACITOR MARKET, BY END USE, 2025-2030 (USD MILLION)
- TABLE 19 HYBRID CAPACITORS: SUPERCAPACITOR MARKET, BY END USE, 2021-2024 (USD MILLION)
- TABLE 20 HYBRID CAPACITORS: SUPERCAPACITOR MARKET, BY END USE, 2025-2030 (USD MILLION)
- TABLE 21 SUPERCAPACITOR MARKET, BY CAPACITANCE RANGE, 2021-2024 (USD MILLION)
- TABLE 22 SUPERCAPACITOR MARKET, BY CAPACITANCE RANGE, 2025-2030 (USD MILLION)
- TABLE 23 SUPERCAPACITOR MARKET, BY CAPACITANCE RANGE, 2021-2024 (MILLION UNITS)
- TABLE 24 SUPERCAPACITOR MARKET, BY CAPACITANCE RANGE, 2025-2030 (MILLION UNITS)
- TABLE 25 SUPERCAPACITOR MARKET, BY END USE, 2021-2024 (USD MILLION)
- TABLE 26 SUPERCAPACITOR MARKET, BY END USE, 2025-2030 (USD MILLION)
- TABLE 27 AUTOMOTIVE & TRANSPORTATION: SUPERCAPACITOR MARKET, BY TYPE, 2021-2024 (USD MILLION)
- TABLE 28 AUTOMOTIVE & TRANSPORTATION: SUPERCAPACITOR MARKET, BY TYPE, 2025-2030 (USD MILLION)
- TABLE 29 AUTOMOTIVE & TRANSPORTATION: SUPERCAPACITOR MARKET, BY REGION, 2021-2024 (USD MILLION)
- TABLE 30 AUTOMOTIVE & TRANSPORTATION: SUPERCAPACITOR MARKET, BY REGION, 2025-2030 (USD MILLION)
- TABLE 31 AUTOMOTIVE & TRANSPORTATION: SUPERCAPACITOR MARKET IN NORTH AMERICA, BY COUNTRY, 2021-2024 (USD MILLION)
- TABLE 32 AUTOMOTIVE & TRANSPORTATION: SUPERCAPACITOR MARKET IN NORTH AMERICA, BY COUNTRY, 2025-2030 (USD MILLION)
- TABLE 33 AUTOMOTIVE & TRANSPORTATION: SUPERCAPACITOR MARKET IN EUROPE, BY COUNTRY, 2021-2024 (USD MILLION)
- TABLE 34 AUTOMOTIVE & TRANSPORTATION: SUPERCAPACITOR MARKET IN EUROPE, BY COUNTRY, 2025-2030 (USD MILLION)
- TABLE 35 AUTOMOTIVE & TRANSPORTATION: SUPERCAPACITOR MARKET IN ASIA PACIFIC, BY COUNTRY, 2021-2024 (USD MILLION)
- TABLE 36 AUTOMOTIVE & TRANSPORTATION: SUPERCAPACITOR MARKET IN ASIA PACIFIC, BY COUNTRY, 2025-2030 (USD MILLION)
- TABLE 37 AUTOMOTIVE & TRANSPORTATION: SUPERCAPACITOR MARKET IN ROW, BY REGION, 2021-2024 (USD MILLION)
- TABLE 38 AUTOMOTIVE & TRANSPORTATION: SUPERCAPACITOR MARKET IN ROW, BY REGION, 2025-2030 (USD MILLION)
- TABLE 39 ENERGY & POWER: SUPERCAPACITOR MARKET, BY TYPE, 2021-2024 (USD MILLION)
- TABLE 40 ENERGY & POWER: SUPERCAPACITOR MARKET, BY TYPE, 2025-2030 (USD MILLION)
- TABLE 41 ENERGY & POWER: SUPERCAPACITOR MARKET, BY REGION, 2021-2024 (USD MILLION)
- TABLE 42 ENERGY & POWER: SUPERCAPACITOR MARKET, BY REGION, 2025-2030 (USD MILLION)
- TABLE 43 ENERGY & POWER: SUPERCAPACITOR MARKET IN NORTH AMERICA, BY COUNTRY, 2021-2024 (USD MILLION)
- TABLE 44 ENERGY & POWER: SUPERCAPACITOR MARKET IN NORTH AMERICA, BY COUNTRY, 2025-2030 (USD MILLION)
- TABLE 45 ENERGY & POWER: SUPERCAPACITOR MARKET IN EUROPE, BY COUNTRY, 2021-2024 (USD MILLION)
- TABLE 46 ENERGY & POWER: SUPERCAPACITOR MARKET IN EUROPE, BY COUNTRY, 2025-2030 (USD MILLION)
- TABLE 47 ENERGY & POWER: SUPERCAPACITOR MARKET IN ASIA PACIFIC, BY COUNTRY, 2021-2024 (USD MILLION)
- TABLE 48 ENERGY & POWER: SUPERCAPACITOR MARKET IN ASIA PACIFIC, BY COUNTRY, 2025-2030 (USD MILLION)
- TABLE 49 ENERGY & POWER: SUPERCAPACITOR MARKET IN ROW, BY REGION, 2021-2024 (USD MILLION)
- TABLE 50 ENERGY & POWER: SUPERCAPACITOR MARKET IN ROW, BY REGION, 2025-2030 (USD MILLION)
- TABLE 51 CONSUMER ELECTRONICS: SUPERCAPACITOR MARKET, BY TYPE, 2021-2024 (USD MILLION)
- TABLE 52 CONSUMER ELECTRONICS: SUPERCAPACITOR MARKET, BY TYPE, 2025-2030 (USD MILLION)
- TABLE 53 CONSUMER ELECTRONICS: SUPERCAPACITOR MARKET, BY REGION, 2021-2024 (USD MILLION)
- TABLE 54 CONSUMER ELECTRONICS: SUPERCAPACITOR MARKET, BY REGION, 2025-2030 (USD MILLION)
- TABLE 55 CONSUMER ELECTRONICS: SUPERCAPACITOR MARKET IN NORTH AMERICA, BY COUNTRY, 2021-2024 (USD MILLION)
- TABLE 56 CONSUMER ELECTRONICS: SUPERCAPACITOR MARKET IN NORTH AMERICA, BY COUNTRY, 2025-2030 (USD MILLION)
- TABLE 57 CONSUMER ELECTRONICS: SUPERCAPACITOR MARKET IN EUROPE, BY COUNTRY, 2021-2024 (USD MILLION)
- TABLE 58 CONSUMER ELECTRONICS: SUPERCAPACITOR MARKET IN EUROPE, BY COUNTRY, 2025-2030 (USD MILLION)
- TABLE 59 CONSUMER ELECTRONICS: SUPERCAPACITOR MARKET IN ASIA PACIFIC, BY COUNTRY, 2021-2024 (USD MILLION)
- TABLE 60 CONSUMER ELECTRONICS: SUPERCAPACITOR MARKET IN ASIA PACIFIC, BY COUNTRY, 2025-2030 (USD MILLION)
- TABLE 61 CONSUMER ELECTRONICS: SUPERCAPACITOR MARKET IN ROW, BY REGION, 2021-2024 (USD MILLION)
- TABLE 62 CONSUMER ELECTRONICS: SUPERCAPACITOR MARKET IN ROW, BY REGION, 2025-2030 (USD MILLION)
- TABLE 63 INDUSTRIAL: SUPERCAPACITOR MARKET, BY TYPE, 2021-2024 (USD MILLION)
- TABLE 64 INDUSTRIAL: SUPERCAPACITOR MARKET, BY TYPE, 2025-2030 (USD MILLION)
- TABLE 65 INDUSTRIAL: SUPERCAPACITOR MARKET, BY REGION, 2021-2024 (USD MILLION)
- TABLE 66 INDUSTRIAL: SUPERCAPACITOR MARKET, BY REGION, 2025-2030 (USD MILLION)
- TABLE 67 INDUSTRIAL: SUPERCAPACITOR MARKET IN NORTH AMERICA, BY COUNTRY, 2021-2024 (USD MILLION)
- TABLE 68 INDUSTRIAL: SUPERCAPACITOR MARKET IN NORTH AMERICA, BY COUNTRY, 2025-2030 (USD MILLION)
- TABLE 69 INDUSTRIAL: SUPERCAPACITOR MARKET IN EUROPE, BY COUNTRY, 2021-2024 (USD MILLION)
- TABLE 70 INDUSTRIAL: SUPERCAPACITOR MARKET IN EUROPE, BY COUNTRY, 2025-2030 (USD MILLION)
- TABLE 71 INDUSTRIAL: SUPERCAPACITOR MARKET IN ASIA PACIFIC, BY COUNTRY, 2021-2024 (USD MILLION)
- TABLE 72 INDUSTRIAL: SUPERCAPACITOR MARKET IN ASIA PACIFIC, BY COUNTRY, 2025-2030 (USD MILLION)
- TABLE 73 INDUSTRIAL: SUPERCAPACITOR MARKET IN ROW, BY REGION, 2021-2024 (USD MILLION)
- TABLE 74 INDUSTRIAL: SUPERCAPACITOR MARKET IN ROW, BY REGION, 2025-2030 (USD MILLION)
- TABLE 75 OTHER END USES: SUPERCAPACITOR MARKET, BY TYPE, 2021-2024 (USD MILLION)
- TABLE 76 OTHER END USES: SUPERCAPACITOR MARKET, BY TYPE, 2025-2030 (USD MILLION)
- TABLE 77 OTHER END USES: SUPERCAPACITOR MARKET, BY REGION, 2021-2024 (USD MILLION)
- TABLE 78 OTHER END USES: SUPERCAPACITOR MARKET, BY REGION, 2025-2030 (USD MILLION)
- TABLE 79 OTHER END USES: SUPERCAPACITOR MARKET IN NORTH AMERICA, BY COUNTRY, 2021-2024 (USD MILLION)
- TABLE 80 OTHER END USES: SUPERCAPACITOR MARKET IN NORTH AMERICA, BY COUNTRY, 2025-2030 (USD MILLION)
- TABLE 81 OTHER END USES: SUPERCAPACITOR MARKET IN EUROPE, BY COUNTRY, 2021-2024 (USD MILLION)
- TABLE 82 OTHER END USES: SUPERCAPACITOR MARKET IN EUROPE, BY COUNTRY, 2025-2030 (USD MILLION)
- TABLE 83 OTHER END USES: SUPERCAPACITOR MARKET IN ASIA PACIFIC, BY COUNTRY, 2021-2024 (USD MILLION)
- TABLE 84 OTHER END USES: SUPERCAPACITOR MARKET IN ASIA PACIFIC, BY COUNTRY, 2025-2030 (USD MILLION)
- TABLE 85 OTHER END USES: SUPERCAPACITOR MARKET IN ROW, BY REGION, 2021-2024 (USD MILLION)
- TABLE 86 OTHER END USES: SUPERCAPACITOR MARKET IN ROW, BY REGION, 2025-2030 (USD MILLION)
- TABLE 87 SUPERCAPACITOR MARKET, BY REGION, 2021-2024 (USD MILLION)
- TABLE 88 SUPERCAPACITOR MARKET, BY REGION, 2025-2030 (USD MILLION)
- TABLE 89 NORTH AMERICA: SUPERCAPACITOR MARKET, BY END USE, 2021-2024 (USD MILLION)
- TABLE 90 NORTH AMERICA: SUPERCAPACITOR MARKET, BY END USE, 2025-2030 (USD MILLION)
- TABLE 91 NORTH AMERICA: SUPERCAPACITOR MARKET, BY COUNTRY, 2021-2024 (USD MILLION)
- TABLE 92 NORTH AMERICA: SUPERCAPACITOR MARKET, BY COUNTRY, 2025-2030 (USD MILLION)
- TABLE 93 US: SUPERCAPACITOR MARKET, BY END USE, 2021-2024 (USD MILLION)
- TABLE 94 US: SUPERCAPACITOR MARKET, BY END USE, 2025-2030 (USD MILLION)
- TABLE 95 CANADA: SUPERCAPACITOR MARKET, BY END USE, 2021-2024 (USD MILLION)
- TABLE 96 CANADA: SUPERCAPACITOR MARKET, BY END USE, 2025-2030 (USD MILLION)
- TABLE 97 MEXICO: SUPERCAPACITOR MARKET, BY END USE, 2021-2024 (USD MILLION)
- TABLE 98 MEXICO: SUPERCAPACITOR MARKET, BY END USE, 2025-2030 (USD MILLION)
- TABLE 99 EUROPE: SUPERCAPACITOR MARKET, BY END USE, 2021-2024 (USD MILLION)
- TABLE 100 EUROPE: SUPERCAPACITOR MARKET, BY END USE, 2025-2030 (USD MILLION)
- TABLE 101 EUROPE: SUPERCAPACITOR MARKET, BY COUNTRY, 2021-2024 (USD MILLION)
- TABLE 102 EUROPE: SUPERCAPACITOR MARKET, BY COUNTRY, 2025-2030 (USD MILLION)
- TABLE 103 GERMANY: SUPERCAPACITOR MARKET, BY END USE, 2021-2024 (USD MILLION)
- TABLE 104 GERMANY: SUPERCAPACITOR MARKET, BY END USE, 2025-2030 (USD MILLION)
- TABLE 105 UK: SUPERCAPACITOR MARKET, BY END USE, 2021-2024 (USD MILLION)
- TABLE 106 UK: SUPERCAPACITOR MARKET, BY END USE, 2025-2030 (USD MILLION)
- TABLE 107 FRANCE: SUPERCAPACITOR MARKET, BY END USE, 2021-2024 (USD MILLION)
- TABLE 108 FRANCE: SUPERCAPACITOR MARKET, BY END USE, 2025-2030 (USD MILLION)
- TABLE 109 ITALY: SUPERCAPACITOR MARKET, BY END USE, 2021-2024 (USD MILLION)
- TABLE 110 ITALY: SUPERCAPACITOR MARKET, BY END USE, 2025-2030 (USD MILLION)
- TABLE 111 REST OF EUROPE: SUPERCAPACITOR MARKET, BY END USE, 2021-2024 (USD MILLION)
- TABLE 112 REST OF EUROPE: SUPERCAPACITOR MARKET, BY END USE, 2025-2030 (USD MILLION)
- TABLE 113 ASIA PACIFIC: SUPERCAPACITOR MARKET, BY END USE, 2021-2024 (USD MILLION)
- TABLE 114 ASIA PACIFIC: SUPERCAPACITOR MARKET, BY END USE, 2025-2030 (USD MILLION)
- TABLE 115 ASIA PACIFIC: SUPERCAPACITOR MARKET, BY COUNTRY, 2021-2024 (USD MILLION)
- TABLE 116 ASIA PACIFIC: SUPERCAPACITOR MARKET, BY COUNTRY, 2025-2030 (USD MILLION)
- TABLE 117 CHINA: SUPERCAPACITOR MARKET, BY END USE, 2021-2024 (USD MILLION)
- TABLE 118 CHINA: SUPERCAPACITOR MARKET, BY END USE, 2025-2030 (USD MILLION)
- TABLE 119 PRODUCTION OF ELECTRONIC EQUIPMENT IN JAPAN (APRIL 2025)
- TABLE 120 JAPAN: SUPERCAPACITOR MARKET, BY END USE, 2021-2024 (USD MILLION)
- TABLE 121 JAPAN: SUPERCAPACITOR MARKET, BY END USE, 2025-2030 (USD MILLION)
- TABLE 122 SOUTH KOREA: SUPERCAPACITOR MARKET, BY END USE, 2021-2024 (USD MILLION)
- TABLE 123 SOUTH KOREA: SUPERCAPACITOR MARKET, BY END USE, 2025-2030 (USD MILLION)
- TABLE 124 INDIA: SUPERCAPACITOR MARKET, BY END USE, 2021-2024 (USD MILLION)
- TABLE 125 INDIA: SUPERCAPACITOR MARKET, BY END USE, 2025-2030 (USD MILLION)
- TABLE 126 REST OF ASIA PACIFIC: SUPERCAPACITOR MARKET, BY END USE, 2021-2024 (USD MILLION)
- TABLE 127 REST OF ASIA PACIFIC: SUPERCAPACITOR MARKET, BY END USE, 2025-2030 (USD MILLION)
- TABLE 128 ROW: SUPERCAPACITOR MARKET, BY END USE, 2021-2024 (USD MILLION)
- TABLE 129 ROW: SUPERCAPACITOR MARKET, BY END USE, 2025-2030 (USD MILLION)
- TABLE 130 ROW: SUPERCAPACITOR MARKET, BY REGION, 2021-2024 (USD MILLION)
- TABLE 131 ROW: SUPERCAPACITOR MARKET, BY REGION, 2025-2030 (USD MILLION)
- TABLE 132 SOUTH AMERICA: SUPERCAPACITOR MARKET, BY END USE, 2021-2024 (USD MILLION)
- TABLE 133 SOUTH AMERICA: SUPERCAPACITOR MARKET, BY END USE, 2025-2030 (USD MILLION)
- TABLE 134 MIDDLE EAST: SUPERCAPACITOR MARKET, BY END USE, 2021-2024 (USD MILLION)
- TABLE 135 MIDDLE EAST: SUPERCAPACITOR MARKET, BY END USE, 2025-2030 (USD MILLION)
- TABLE 136 MIDDLE EAST: SUPERCAPACITOR MARKET, BY COUNTRY, 2021-2024 (USD MILLION)
- TABLE 137 MIDDLE EAST: SUPERCAPACITOR MARKET, BY COUNTRY, 2025-2030 (USD MILLION)
- TABLE 138 AFRICA: SUPERCAPACITOR MARKET, BY END USE, 2021-2024 (USD MILLION)
- TABLE 139 AFRICA: SUPERCAPACITOR MARKET, BY END USE, 2025-2030 (USD MILLION)
- TABLE 140 SUPERCAPACITOR MARKET: OVERVIEW OF STRATEGIES ADOPTED BY KEY PLAYERS, MARCH 2021-MARCH 2025
- TABLE 141 SUPERCAPACITOR MARKET: DEGREE OF COMPETITION, 2024
- TABLE 142 SUPERCAPACITOR MARKET: REGION FOOTPRINT
- TABLE 143 SUPERCAPACITOR MARKET: TYPE FOOTPRINT
- TABLE 144 SUPERCAPACITOR MARKET: CAPACITANCE RANGE FOOTPRINT
- TABLE 145 SUPERCAPACITOR MARKET: END USE FOOTPRINT
- TABLE 146 SUPERCAPACITOR MARKET: PRODUCT LAUNCHES, MARCH 2021-MARCH 2025
- TABLE 147 SUPERCAPACITOR MARKET: DEALS, MARCH 2021-MARCH 2025
- TABLE 148 MAXWELL TECHNOLOGIES: COMPANY OVERVIEW
- TABLE 149 MAXWELL TECHNOLOGIES: PRODUCTS/SOLUTIONS/SERVICES OFFERED
- TABLE 150 LS MATERIALS: COMPANY OVERVIEW
- TABLE 151 LS MATERIALS: PRODUCTS/SOLUTIONS/SERVICES OFFERED
- TABLE 152 LS MATERIALS: PRODUCT LAUNCHES
- TABLE 153 NIPPON CHEMI-CON CORPORATION: COMPANY OVERVIEW
- TABLE 154 NIPPON CHEMI-CON CORPORATION: PRODUCTS/SOLUTIONS/SERVICES OFFERED
- TABLE 155 NIPPON CHEMI-CON CORPORATION: PRODUCT LAUNCHES
- TABLE 156 NIPPON CHEMI-CON CORPORATION: DEALS
- TABLE 157 EATON: COMPANY OVERVIEW
- TABLE 158 EATON: PRODUCTS/SOLUTIONS/SERVICES OFFERED
- TABLE 159 EATON: DEALS
- TABLE 160 CAP-XX: COMPANY OVERVIEW
- TABLE 161 CAP-XX: PRODUCTS/SOLUTIONS/SERVICES OFFERED
- TABLE 162 CAP-XX: DEALS
- TABLE 163 CAP-XX: OTHER DEVELOPMENTS
- TABLE 164 TECATE GROUP: COMPANY OVERVIEW
- TABLE 165 TECATE GROUP: PRODUCTS/SOLUTIONS/SERVICES OFFERED
- TABLE 166 CORNELL DUBILIER: COMPANY OVERVIEW
- TABLE 167 CORNELL DUBILIER: PRODUCTS/SOLUTIONS/SERVICES OFFERED
- TABLE 168 CORNELL DUBILIER: DEALS
- TABLE 169 IOXUS: COMPANY OVERVIEW
- TABLE 170 IOXUS: PRODUCTS/SOLUTIONS/SERVICES OFFERED
- TABLE 171 SKELETON TECHNOLOGIES: COMPANY OVERVIEW
- TABLE 172 SKELETON TECHNOLOGIES: PRODUCTS/SOLUTIONS/SERVICES OFFERED
- TABLE 173 SKELETON TECHNOLOGIES: PRODUCT LAUNCHES
- TABLE 174 SKELETON TECHNOLOGIES: DEALS
- TABLE 175 SKELETON TECHNOLOGIES: EXPANSIONS
- TABLE 176 SKELETON TECHNOLOGIES: OTHER DEVELOPMENTS
- TABLE 177 KORCHIP CORPORATION: COMPANY OVERVIEW
- TABLE 178 KORCHIP CORPORATION: PRODUCTS/SOLUTIONS/SERVICES OFFERED
- TABLE 179 NANTONG JIANGHAI CAPACITOR CO., LTD.: COMPANY OVERVIEW
- TABLE 180 NANTONG JIANGHAI CAPACITOR CO., LTD.: PRODUCTS/SOLUTIONS/SERVICES OFFERED
- TABLE 181 KYOCERA AVX COMPONENTS CORPORATION: COMPANY OVERVIEW
- TABLE 182 KEMET CORPORATION: COMPANY OVERVIEW
- TABLE 183 SPEL TECHNOLOGIES PRIVATE LTD.: COMPANY OVERVIEW
- TABLE 184 VINATECH CO., LTD.: COMPANY OVERVIEW
- TABLE 185 KELTRON COMPONENT COMPLEX LTD: COMPANY OVERVIEW
- TABLE 186 WUXI CRE NEW ENERGY TECHNOLOGY CO., LTD.: COMPANY OVERVIEW
- TABLE 187 JINZHOU KAIMEI POWER CO.LTD: COMPANY OVERVIEW
- TABLE 188 SHENZHEN CHUANGSHIDING ELECTRONICS CO.,LTD: COMPANY OVERVIEW
- TABLE 189 ELNA CO., LTD.: COMPANY OVERVIEW
- TABLE 190 AOWEI TECHNOLOGY SHANGHAI: COMPANY OVERVIEW
- TABLE 191 ZHONGTIAN SUPERCAPACITOR TECHNOLOGY CO., LTD.: COMPANY OVERVIEW
- TABLE 192 SCHURTER: COMPANY OVERVIEW
- TABLE 193 SHANGHAI GREEN TECH CO., LTD.: COMPANY OVERVIEW
- TABLE 194 WURTH ELEKTRONIK EISOS GMBH & CO. KG: COMPANY OVERVIEW
List of Figures
- FIGURE 1 SUPERCAPACITOR MARKET SEGMENTATION AND REGIONAL SCOPE
- FIGURE 2 SUPERCAPACITOR MARKET: RESEARCH DESIGN
- FIGURE 3 SUPERCAPACITOR MARKET: RESEARCH APPROACH
- FIGURE 4 DATA CAPTURED FROM SECONDARY SOURCES
- FIGURE 5 DATA CAPTURED FROM PRIMARY SOURCES
- FIGURE 6 CORE FINDINGS FROM INDUSTRY EXPERTS
- FIGURE 7 BREAKDOWN OF PRIMARY INTERVIEWS, BY COMPANY TYPE, DESIGNATION, AND REGION
- FIGURE 8 SUPERCAPACITOR MARKET: BOTTOM-UP APPROACH
- FIGURE 9 SUPERCAPACITOR MARKET: TOP-DOWN APPROACH
- FIGURE 10 SUPERCAPACITOR MARKET SIZE ESTIMATION (SUPPLY SIDE)
- FIGURE 11 SUPERCAPACITOR MARKET: DATA TRIANGULATION
- FIGURE 12 ELECTRIC DOUBLE-LAYER CAPACITORS SEGMENT TO DOMINATE SUPERCAPACITOR MARKET BETWEEN 2025 AND 2030
- FIGURE 13 <100 F SEGMENT TO CAPTURE LARGEST MARKET SHARE IN 2030
- FIGURE 14 AUTOMOTIVE & TRANSPORTATION SEGMENT TO REGISTER HIGHEST CAGR IN SUPERCAPACITOR MARKET DURING FORECAST PERIOD
- FIGURE 15 ASIA PACIFIC HELD LARGEST SHARE OF SUPERCAPACITOR MARKET IN 2024
- FIGURE 16 RAPID ELECTRIFICATION AND INDUSTRIAL AUTOMATION TO CREATE LUCRATIVE OPPORTUNITIES FOR PLAYERS IN SUPERCAPACITOR MARKET
- FIGURE 17 HYBRID CAPACITORS SEGMENT TO EXHIBIT HIGHEST CAGR BETWEEN 2025 AND 2030
- FIGURE 18 <100 F SEGMENT TO CAPTURE LARGEST MARKET SHARE IN 2025
- FIGURE 19 AUTOMOTIVE & TRANSPORTATION SEGMENT TO HOLD LARGEST MARKET SHARE IN 2025
- FIGURE 20 CHINA TO EXHIBIT HIGHEST CAGR IN GLOBAL SUPERCAPACITOR MARKET DURING FORECAST PERIOD
- FIGURE 21 DRIVERS, RESTRAINTS, OPPORTUNITIES, AND CHALLENGES
- FIGURE 22 DRIVERS: IMPACT ANALYSIS
- FIGURE 23 RESTRAINTS: IMPACT ANALYSIS
- FIGURE 24 OPPORTUNITIES: IMPACT ANALYSIS
- FIGURE 25 CHALLENGES: IMPACT ANALYSIS
- FIGURE 26 VALUE CHAIN ANALYSIS
- FIGURE 27 AVERAGE SELLING PRICE TREND OF SUPERCAPACITOR CELLS, BY CAPACITANCE RANGE, 2021-2024
- FIGURE 28 AVERAGE SELLING PRICE TREND OF <100 F SUPERCAPACITOR CELLS, BY REGION, 2021-2024
- FIGURE 29 SUPERCAPACITOR ECOSYSTEM
- FIGURE 30 IMPORT DATA FOR HS CODE 853229-COMPLIANT PRODUCTS FOR TOP FIVE COUNTRIES, 2020-2024
- FIGURE 31 EXPORT DATA FOR HS CODE 853229-COMPLIANT PRODUCTS FOR TOP FIVE COUNTRIES, 2020-2024
- FIGURE 32 PATENTS APPLIED AND GRANTED, 2015-2024
- FIGURE 33 AI USE CASES IN SUPERCAPACITOR MARKET
- FIGURE 34 ELECTRODE MATERIALS OF SUPERCAPACITORS
- FIGURE 35 CARBON-MOST CONTRIBUTING ELECTRODE MATERIAL IN SUPERCAPACITORS
- FIGURE 36 SUPERCAPACITOR MARKET, BY TYPE
- FIGURE 37 ELECTRIC DOUBLE-LAYER CAPACITORS SEGMENT TO DOMINATE SUPERCAPACITOR MARKET FROM 2025 TO 2030
- FIGURE 38 SUPERCAPACITOR MARKET, BY CAPACITANCE RANGE
- FIGURE 39 <100 F SEGMENT TO DOMINATE SUPERCAPACITOR MARKET DURING FORECAST PERIOD
- FIGURE 40 SUPERCAPACITOR MARKET, BY END USE
- FIGURE 41 AUTOMOTIVE & TRANSPORTATION SEGMENT TO HOLD LARGEST SHARE OF SUPERCAPACITOR MARKET IN 2025
- FIGURE 42 CHINA TO EXHIBIT HIGHEST CAGR IN GLOBAL SUPERCAPACITOR MARKET FROM 2025 TO 2030
- FIGURE 43 ASIA PACIFIC TO HOLD LARGEST SHARE OF SUPERCAPACITOR MARKET IN 2030
- FIGURE 44 NORTH AMERICA: SUPERCAPACITOR MARKET SNAPSHOT
- FIGURE 45 EUROPE: SUPERCAPACITOR MARKET SNAPSHOT
- FIGURE 46 ASIA PACIFIC: SUPERCAPACITOR MARKET SNAPSHOT
- FIGURE 47 MARKET SHARE ANALYSIS OF COMPANIES OFFERING SUPERCAPACITORS, 2024
- FIGURE 48 SUPERCAPACITOR MARKET: REVENUE ANALYSIS OF KEY PLAYERS, 2020-2024
- FIGURE 49 SUPERCAPACITOR MARKET: COMPANY EVALUATION MATRIX (KEY PLAYERS), 2024
- FIGURE 50 SUPERCAPACITOR MARKET: COMPANY FOOTPRINT
- FIGURE 51 SUPERCAPACITOR MARKET: COMPANY EVALUATION MATRIX (STARTUPS/SMES), 2024
- FIGURE 52 LS MATERIALS: COMPANY SNAPSHOT
- FIGURE 53 NIPPON CHEMI-CON CORPORATION: COMPANY SNAPSHOT
- FIGURE 54 EATON: COMPANY SNAPSHOT
- FIGURE 55 CAP-XX: COMPANY SNAPSHOT
 超級電容市場:2026年至2032年全球市場預測(按類型、電極材料、形狀、電壓範圍、應用和銷售管道)汽車超級電容市場:2026-2032年全球市場預測(按模組、車輛類型、技術、應用和最終用途分類)
 石墨烯基超級超級電容市場分析及預測(至2035年):類型、產品、技術、組件、應用、形式、材料類型、製程、最終用戶、功能
 超級電容:市場佔有率分析、產業趨勢與統計、成長預測(2026-2031)SMD超級電容市場按電壓範圍、產品類型、電解液類型、銷售管道、應用和終端用戶產業分類-全球預測(2026-2032年)超級電容材料市場(按電極材料類型、電解質類型、結構類型、封裝類型和最終用途分類)-2026-2032年全球預測
 全球超級電容材料市場預測(至2032年):依材料類型、裝置配置、最終用戶和地區分類
 日本超級電容器市場報告(按產品類型、模組類型、材料類型、最終用途產業和地區分類,2026-2034年)
 全球超級電容器市場:按類型、電極材料、電容、產業和地區劃分 - 產業動態、市場規模、機會分析和預測(2026-2035 年)
 超級電容電池市場規模、佔有率和成長分析(按產品類型、材料類型、容量、應用、最終用戶和地區分類)-2026-2033年產業預測