


 |
市場調查報告書
商品編碼
1754849
共享移動市場:2025-2030年Shared Mobility Market: 2025-2030 |
||||||
共享移動服務,2028年之前世界人口的4分之一引進
| 主要統計 | |
|---|---|
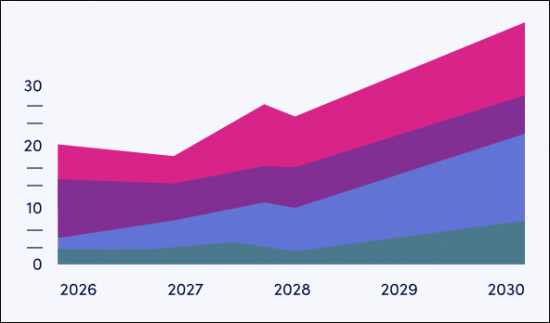
| 2025年的全球共享移動的市場規模 | 1,040億美元 |
| 2030年的全球共享移動的市場規模 | 2,050億美元 |
| 2025年~2030年的共享移動市場整體成長率 | 98% |
| 預測期間 | 2025-2030年 |
本研究資料包對快速變化的共享旅遊市場進行了詳細分析。共享旅遊服務提供者可以透過本研究了解主要的出行趨勢和課題、潛在的成長機會以及競爭格局。
我們的研究套組包含描繪共享旅遊市場未來成長的數據。這項詳細的研究揭示了市場中的最新機會和趨勢,並透過對15家共享旅遊服務提供者的廣泛分析提供了深刻的見解。報告探討了公眾認知、多式聯運規劃能力以及無障礙出行課題等。
主要特點
- 市場動態:我們深入了解共享出行市場的主要出行趨勢和市場擴張課題。我們探討了公私部門之間的分歧、監管的複雜性、持續的營運成本以及無障礙出行問題帶來的課題,並分析了採用共享出行的多種用例。該研究進一步展望了共享出行的未來。
- 關鍵要點和策略建議:詳細分析了主要的市場機會和研究結果,並為共享旅遊服務提供者提供了關於新興趨勢和未來市場發展的策略建議。
- 基準產業預測:此預測涵蓋共享出行數據,細分為叫車、汽車共享、電動滑板車和自行車共享。預測內容包括每個細分市場的行程次數和行駛距離等指標。此外,該預測還涵蓋了 MaaS(旅遊即服務)和公共交通的數據,細分為消費者用戶和企業用戶,以及收入和節省金額。
- Juniper Research 競爭力排行榜:此排行榜評估了 15 家共享旅遊供應商的能力,重點在於共享旅遊產業的關鍵參與者。
樣品view
市場資料·預測報告
樣品
市場趨勢·策略報告
市場資料&預測報告
研究套組包含一整套預測數據,包含 132 個表格和超過 60,000 個數據點。此研究套組包含以下指標:
- 共享移動和MaaS的整體用戶數
- 共享移動和MaaS服務的總支出額
- 共享移動和MaaS的行車距離
研究套組的共享移動部分中,包含以下指標:
- 共享移動的用戶數
- 共享移動服務的總支出額
- 共享移動的行車數
- 共享移動的行車距離
以下指標由市場提供:
- 召車
- 汽車共享
- EScooter
- 摩托車共享
調查的MaaS部分中包含以下指標:
- MaaS及MaaS支援大眾運輸的用戶數
- 來自MaaS及MaaS支援大眾交通工具使用者的收益
- MaaS及MaaS支援大眾運輸的行車數
以下指標由市場提供:
- 消費者 MaaS 用戶及收入
- 企業 MaaS 用戶及收入
- 消費者 MaaS 節省的費用
- 企業 MaaS 節省的費用
- 公車和鐵路服務
Juniper Research 的互動式預測 (Excel) 包含以下功能:
- 統計分析:您可以搜尋資料期間所有地區和國家顯示的特定指標。圖表可以輕鬆修改並匯出到剪貼簿。
- 國家/地區資料工具:此工具可讓使用者查看預測期間內所有地區和國家的指標。使用者可以使用搜尋欄縮小顯示指標的範圍。
- 國家比較工具:可以選擇每個國家進行比較。此工具包含匯出圖表的功能。
- 假設分析:使用者可以在此將預測指標與自己的假設進行比較。
競爭排行榜報告
競爭排行榜報告對共享出行解決方案領域的 15 家領先供應商進行了詳細的評估和市場定位。根據供應商的產能和能力評估、他們提供的共享出行模式以及他們擁有的與競爭對手不同的技術,這些供應商被定位為既定領導者、領先的課題者或顛覆者和課題者。
目錄
市場趨勢與策略
第1章 重要點和策略性建議
- 重要點
- 策略性建議
第2章 市場形勢
- 共享移動的歷史
- 共享移動為何必要?
- 共享移動的種類
- 調配車輛服務
- 微行動
- 電動滑板車
- 自行車共享
- 共乘
- 微型公車和接駁車服務
- 微轉運
- 接駁車服務
- 城市空中交通 (UAM)
- 大眾運輸
- 巴士
- 巴士高速運輸系統(BRT)
- 電車
- 有軌電車
- 地鐵系統
- 渡輪
- Mobility-as-a-Service
第3章 市場區隔分析
- 調配車輛服務
- 目前情形
- 最近的趨勢
- 課題
- 未來預測
- 共享微出行
- 目前情形
- 最近的趨勢
- 課題
- 未來預測
- 共乘
- 目前情形
- 最近的趨勢
- 課題
- 未來預測
- 城市空中交通 (UAM)
- 目前情形
- 最近的趨勢
- 課題
- 未來預測
- 大眾運輸
- 目前情形
- 最近的趨勢
- 課題
- 未來預測
- Mobility-as-a-Service
- 目前情形
- 最近的趨勢
- 課題
- 未來預測
第4章 各國準備指數
- 各國準備指數:簡介
- 焦點市場
- 成長市場
- 飽和市場
- 新興國家市場
競爭排行榜
第1章 Juniper Research的競爭排行榜
第2章 企業簡介
- 業者簡介
- Bird Global
- BlaBlaCar
- Bolt
- Cabify
- DiDi Chuxing
- Ford Smart Mobility
- Grab
- Hertz
- Lime
- Lyft
- Ola
- Siemens Mobility
- Uber Technologies
- Zipcar
- Zoomcar
- 相關調查
資料與預測
第1章 簡介與調查手法
第2章 市場摘要
- 共享移動
- 共享移動的用戶數
- 共享移動的利用回數
- 共享移動的服務支出額
第3章 市場區隔分割
- 調配車輛服務
- 用戶數
- 服務支出額
- 汽車共享
- 用戶數
- 服務支出額
- 電動滑板車
- 用戶數
- 服務支出額
- 自行車共享
- 用戶數
- 服務支出額
- MaaS和大眾運輸
- 用戶數
- 服務支出額
'Shared Mobility Services to be Adopted by One Quarter of Global Population by 2028'
| KEY STATISTICS | |
|---|---|
| Shared mobility market value globally in 2025: | $104bn |
| Shared mobility market value globally in 2030: | $205bn |
| Total shared mobility market value growth between 2025 & 2030: | 98% |
| Forecast period: | 2025-2030 |
Overview
Our "Shared Mobility" Market research suite provides detailed analysis of this rapidly changing market; allowing shared mobility service providers to gain an understanding of key mobility trends and challenges, potential growth opportunities, and the competitive environment.
Providing multiple options which can be purchased separately, the research suite includes access to data mapping the future growth of the shared mobility market. The detailed study reveals the latest opportunities and trends within the market, and an insightful document containing an extensive analysis of 15 shared mobility service providers within the space. Aspects such as public attitudes, multimodal planning capabilities, and challenges to accessibility are explored throughout the report. The coverage can also be purchased as a Full Research Suite, which contains all these elements and includes a substantial discount.
Collectively, these elements provide an effective tool for understanding this rapidly evolving market; allowing shared mobility vendors to set out their future strategies to provide effective and efficient mobility services to their customers. Its unparalleled coverage makes this research suite an incredibly useful resource for gauging the future of this complex market.
Key Features
- Market Dynamics: Insights into key mobility trends and market expansion challenges within the shared mobility market. It addresses the challenges posed by fragmentation between public and private sectors, regulatory complexity, maintaining operational costs, and accessibility problems, and also analyses multiple use cases where shared mobility is employed. Furthermore, the research provides a future outlook on the landscape of shared mobility.
- Key Takeaways & Strategic Recommendations: In-depth analysis of key development opportunities and findings within the market, accompanied by key strategic recommendations for shared mobility service providers on emerging trends and how the market is expected to evolve.
- Benchmark Industry Forecasts: The forecasts include data on shared mobility, split by ride-hailing, car sharing, e-scooter, and bike sharing. This includes metrics such as the number of journeys and distance covered for each segment. The forecast also includes data on Mobility-as-a-Service (MaaS) and public transport, split into consumer and corporate users, revenue, and savings.
- Juniper Research Competitor Leaderboard: Key player capability and capacity assessment for 15 shared mobility vendors, via the Juniper Research Competitor Leaderboard; featuring analysis around major players in the shared mobility industry.
SAMPLE VIEW
Market Data & Forecasting Report
The numbers tell you what's happening, but our written report details why, alongside the methodologies.
SAMPLE VIEW
Market Trends & Strategies Report
A comprehensive analysis of the current market landscape, alongside strategic recommendations.
Market Data & Forecasting Report
The market-leading research suite for the "shared mobility" market includes access to the full set of forecast data, consisting of 132 tables and over 60,000 datapoints. Metrics in the research suite include:
- Total Volume of Shared Mobility & MaaS Users
- Total Spend on Shared Mobility & MaaS Services
- Total Number of Shared Mobility & MaaS Journeys
The shared mobility portion of the research suite includes the following metrics:
- Total Volume of Shared Mobility Users
- Total Spend on Shared Mobility Services
- Total Number of Shared Mobility Journeys
- Total Distance Covered by Shared Mobility Journeys
These metrics are provided for the following key market verticals:
- Ride-hailing
- Car sharing
- E-scooters
- Bike sharing
The MaaS portion of the research suite includes the following metrics:
- Total Number of MaaS & MaaS-enabled Public Transport Users
- Total Revenue From MaaS & MaaS-enabled Public Transport Users
- Total Number of MaaS & MaaS-enabled Public Transport Journeys
These metrics are provided for the following market verticals:
- Consumer MaaS Users & Revenue
- Corporate MaaS Users & Revenue
- Consumer MaaS Savings
- Corporate MaaS Savings
- Bus & Train Services
The Juniper Research Interactive Forecast Excel contains the following functionality:
- Statistics Analysis: Users benefit from the ability to search for specific metrics, displayed for all regions and countries across the data period. Graphs are easily modified and can be exported to the clipboard.
- Country Data Tool: This tool allows the user to review metrics for all regions and countries in the forecast period. Users can refine the metrics displayed via the search bar.
- Country Comparison Tool: Users can select and compare each of the countries. The ability to export graphs is included in this tool.
- What-if Analysis: Here, users can compare forecast metrics against their own assumptions. 5 interactive scenarios.
Market Trends & Strategies Report
This report examines the "shared mobility" market landscape in detail. It assesses different market trends and factors that are shaping the evolution of this diverse market, such as collaboration between public services and private shared mobility providers, the trialling of autonomy in specific markets, and methods of first- and last-mile journey coverage; addressing key vertical and developing challenges, and how vendors should navigate these. As well as looking into shared mobility use cases, it also includes evaluation of the different methods of shared mobility with the highest usage rates, and those which some vendors are experimenting with; in order to assess their viability in this market.
Competitor Leaderboard Report
The Competitor Leaderboard report provides a detailed evaluation and market positioning for 15 leading vendors in the shared mobility solution space. These vendors are positioned as an established leader, leading challenger, or disruptor and challenger based on capacity and capability assessments, which modes of shared mobility they offer, and any technologies which set them apart from their competitors. The 15 vendors consist of:
|
|
|
This document is centred around the Juniper Research Competitor Leaderboard; a vendor positioning tool that provides an at-a-glance view of the competitive landscape, backed by a robust methodology.
Table of Contents
Market Trends & Strategies
1. Key Takeaways & Strategic Recommendations
- 1.1. Key Takeaways
- 1.2. Strategic Recommendations
2. Market Landscape
- 2.1. Introduction
- 2.2. Shared Mobility History
- 2.3. Why Do We Need Shared Mobility?
- 2.4. Types of Shared Mobility
- 2.4.1. Ride-hailing
- 2.4.2. Micromobility
- i. E-scooters
- Figure 2.1: Example of Dockless E-scooter Parking Zone
- ii. Bike Sharing
- Figure 2.2: Example of Docked Bike Sharing Bikes
- i. E-scooters
- 2.4.3. Ride Sharing
- 2.4.4. Microtransit & Shuttle Services
- i. Microtransit
- ii. Shuttle Services
- 2.4.5. Urban Aerial Mobility
- Figure 2.3: An Electric Air Taxi Taking Off
- 2.5. Public Transport
- i. Buses
- ii. Bus Rapid Transit (BRT)
- iii. Trains
- iv. Trams
- v. Metro Systems
- vi. Ferries
- 2.6. Mobility-as-a-Service
3. Segment Analysis
- 3.1. Ride-hailing
- 3.1.1. Current Status
- 3.1.2. Recent Developments
- 3.1.3. Challenges
- 3.1.4. Future Outlook
- Figure 3.1: Total Number of Ride-hailing Service Users (m), Globally, Split by 8 Key Regions, 2025-2030
- 3.2. Shared Micromobility
- 3.2.1. Current Status
- 3.2.2. Recent Developments
- 3.2.3. Challenges
- 3.2.4. Future Outlook
- Figure 3.2: Total Number of Shared Micromobility Users (m), Globally, Split by Key Regions, 2025-2030
- 3.3. Ride Sharing
- 3.3.1. Current Status
- 3.3.2. Recent Developments
- 3.3.3. Challenges
- 3.3.4. Future Outlook
- 3.4. Urban Aerial Mobility
- 3.4.1. Current Status
- 3.4.2. Recent Developments
- 3.4.3. Challenges
- 3.4.4. Future Outlook
- 3.5. Public Transport
- 3.5.1. Current Status
- 3.5.2. Recent Developments
- 3.5.3. Challenges
- 3.5.4. Future Outlook
- 3.6. Mobility-as-a-Service
- 3.6.1. Current Status
- Figure 3.3: Total Number of MaaS Users (m), Globally, Split by 8 Key Regions, 2025-2030
- 3.6.2. Recent Developments
- 3.6.3. Challenges
- 3.6.4. Future Outlook
- Figure 3.4: Total Number of MaaS & MaaS-enabled Public Transport Users (m), Globally, Split by 8 Key Regions, 2025-2030
- 3.6.1. Current Status
4. Country Readiness Index
- 4.1. Introduction to Country Readiness Index
- Figure 4.1: Shared Mobility Country Readiness Index: Regional Definitions
- Table 4.2: Juniper Research's Country Readiness Index Scoring Criteria: Shared Mobility
- Figure 4.3: Juniper Research's Country Readiness Index: Shared Mobility
- Figure 4.4: Shared Mobility Country Readiness Index: Market Segments
- 4.1.1. Focus Markets
- i. Youth-driven Adoption
- Figure 4.5: Total Spend on Bike Sharing Services ($m), Split by 8 Key Regions, 2025-2030
- ii. Increasing Accessibility to Public Transportation
- i. Youth-driven Adoption
- 4.1.2. Growth Markets
- i. Potential to Introduce Emerging Forms of Shared Mobility
- Figure 4.6: Total Number of Shared Mobility Users (m), Split by Six Growth Markets, 2025-2030
- ii. Strong Investment Opportunities
- Figure 4.7: Total Spend on Shared Mobility ($m), Split by Six Growth Markets, 2025-2030
- i. Potential to Introduce Emerging Forms of Shared Mobility
- 4.1.3. Saturated Markets
- Figure 4.8: Total Volume of Ride-hailing Users (m), Split by Four Saturated Markets, 2025-2030
- 4.1.4. Developing Markets
- Figure 4.9: Total Spend on Shared Mobility Services ($m), Split by Top Eight Developing Markets, 2025-2030
Competitor Leaderboard
1. Juniper Research Competitor Leaderboard
- 1.1. Why Read This Report
- Figure 1.1: Juniper Research's Competitor Leaderboard: Shared Mobility Vendors Included & Product Portfolios
- Figure 1.2: Juniper Research's Competitor Leaderboard for the Shared Mobility Market
- Table 1.3: Shared Mobility Market: Vendors & Positioning
- Table 1.4: Juniper Research's Competitor Leaderboard Heatmap for Shared Mobility Vendors
2. Company Profiles
- 2.1. Vendor Profiles
- 2.1.1. Bird Global
- i. Corporate
- Table 2.1: Bird Global's Funding Rounds ($m), 2018-2022
- ii. Geographical Spread
- iii. Key Clients & Strategic Partnerships
- iv. High-level View of Offerings
- v. Juniper Research's View: Key Strengths & Strategic Development Opportunities
- i. Corporate
- 2.1.2. BlaBlaCar
- i. Corporate
- Table 2.2: BlaBlaCar's Funding Rounds ($m), 2010-2024
- ii. Geographical Spread
- iii. Key Clients & Strategic Partnerships
- iv. High-level View of Offerings
- Figure 2.3: BlaBlaCar App
- v. Juniper Research's View: Key Strengths & Strategic Development Opportunities
- i. Corporate
- 2.1.3. Bolt
- i. Corporate
- Figure 2.4: Bolt's Funding Rounds ($m), 2020-2024
- ii. Geographical Spread
- iii. Key Clients & Strategic Partnerships
- iv. High-level View of Offerings
- v. Juniper Research's View: Key Strengths & Strategic Development Opportunities
- i. Corporate
- 2.1.4. Cabify
- i. Corporate
- Table 2.5: Cabify's Funding Rounds ($m), 2015-2024
- ii. Geographical Spread
- iii. Key Clients & Strategic Partnerships
- iv. High-level View of Offerings
- v. Juniper Research's View: Key Strengths & Strategic Development Opportunities
- i. Corporate
- 2.1.5. DiDi Chuxing
- i. Corporate
- Table 2.6: DiDi Chuxing's Financial Snapshot ($m), 2023-2024
- ii. Geographical Spread
- iii. Key Clients & Strategic Partnerships
- iv. High-level View of Offerings
- v. Juniper Research's View: Key Strengths & Strategic Development Opportunities
- i. Corporate
- 2.1.6. Ford Smart Mobility
- i. Corporate
- Table 2.7: Ford Smart Mobility's Funding Rounds ($m), 2016-2018
- ii. Geographical Spread
- iii. Key Clients & Strategic Opportunities
- iv. High-level View of Offerings
- v. Juniper Research's View: Key Strengths & Strategic Development Opportunities
- i. Corporate
- 2.1.7. Grab
- i. Corporate
- Figure 2.8: Grab's Financial Snapshot ($m), 2023-2024
- ii. Geographical Spread
- iii. Key Clients & Strategic Partnerships
- iv. High-level View of Offerings
- v. Juniper Research's View: Key Strengths & Strategic Devlopment Opportunities
- i. Corporate
- 2.1.8. Hertz
- i. Corporate
- Figure 2.9: Hertz's Financial Snapshot ($m), 2023-2024
- ii. Geographical Spread
- iii. Key Clients & Strategic Partnerships
- iv. High-level View of Offerings
- v. Juniper Research's View: Key Strengths & Strategic Development Opportunities
- i. Corporate
- 2.1.9. Lime
- i. Corporate
- Figure 2.10: Lime's Funding Rounds ($m), 2018-2021
- ii. Geographical Spread
- iii. Key Clients & Strategic Partnerships
- iv. High-level View of Offerings
- Figure 2.11: Lime's Gen 4 E-scooter
- v. Juniper Research's View: Key Strengths & Strategic Development Opportunities
- i. Corporate
- 2.1.10. Lyft
- i. Corporate
- Figure 2.12: Lyft's Financial Snapshot ($m), 2023-2024
- ii. Geographical Spread
- iii. Key Clients & Strategic Partnerships
- iv. High-level View of Offerings
- v. Juniper Research's View: Key Strengths & Strategic Development Opportunities
- i. Corporate
- 2.1.11. Ola
- i. Corporate
- Table 2.13: Ola's Funding Rounds ($m), 2019-2022
- ii. Geographical Spread
- iii. Key Clients & Strategic Partnerships
- iv. High-level View of Offerings
- v. Juniper Research's View: Key Strengths & Strategic Opportunities
- i. Corporate
- 2.1.12. Siemens Mobility
- i. Corporate
- Figure 2.14: Siemens Mobility Financial Snapshot ($m), 2023-2024
- ii. Geographical Spread
- iii. Key Clients & Strategic Partnerships
- iv. High-level View of Offerings
- v. Juniper Research's View: Key Strengths & Strategic Opportunities
- i. Corporate
- 2.1.13. Uber Technologies
- i. Corporate
- Figure 2.15: Uber Technologies Financial Snapshot ($m), 2023-2024
- ii. Geographical Spread
- iii. Key Clients & Strategic Partnerships
- iv. High-level View of Offerings
- Figure 2.16: How UberX Share Looks in the Uber App
- v. Juniper Research's View: Key Strengths & Strategic Opportunities
- i. Corporate
- 2.1.14. Zipcar
- i. Corporate
- ii. Geographical Spread
- iii. Key Clients & Strategic Partnerships
- iv. High-level View of Offerings
- v. Juniper Research's View: Key Strengths & Strategic Opportunities
- 2.1.15. Zoomcar
- i. Corporate
- Figure 2.17: Zoomcar Financial Snapshot ($m), 2023-2024
- ii. Geographical Spread
- iii. Key Clients & Strategic Partnerships
- iv. High-level View of Offerings
- v. Juniper Research's View: Key Strengths & Strategic Opportunities
- i. Corporate
- 2.1.1. Bird Global
- 2.2. Related Research
Data & Forecasting
1. Introduction & Methodology
- 1.1. Introduction
- 1.2. Methodology & Assumptions
- Figure 1.1: Ride-hailing Forecast Methodology
- Figure 1.2: Car Sharing Forecast Methodology
- Figure 1.3: E-scooter Forecast Methodology
- Figure 1.4: Bike Sharing Forecast Methodology
- Figure 1.5: MaaS & MaaS-enabled Public Transport Forecast Methodology
2. Market Summary
- 2.1. Shared Mobility
- 2.1.1. Total Volume of Shared Mobility Users
- Figure & Table 2.1: Total Volume of Shared Mobility Users (m), Globally, Split by 8 Key Regions, 2025-2030
- 2.1.2. Total Number of Shared Mobility Journeys
- Figure & Table 2.2: Total Number of Shared Mobility Journeys (m), Globally, Split by 8 Key Regions, 2025-2030
- 2.1.3. Total Spend on Shared Mobility Services
- Figure & Table 2.3: Total Spend on Shared Mobility Services ($m), Globally, Split by 8 Key Regions, 2025-2030
- 2.1.1. Total Volume of Shared Mobility Users
3. Segment Splits
- 3.1. Ride-hailing
- 3.1.1. Total Number of Ride-hailing Users
- Figure & Table 3.1: Total Number of Ride-hailing Users (m), Globally, Split by 8 Key Regions, 2025-2030
- 3.1.2. Total Spend on Ride-hailing Services
- Figure & Table 3.2: Total Spend on Ride-hailing Services ($m), Globally, Split by 8 Key Regions, 2025-2030
- 3.1.1. Total Number of Ride-hailing Users
- 3.2. Car Sharing
- 3.2.1. Total Number of Car Sharing Users
- Figure & Table 3.3: Total Number of Car Sharing Users (m), Globally, Split by 8 Key Regions, 2025-2030
- 3.2.2. Total Spend on Car Sharing Services
- Figure & Table 3.4: Total Spend on Car Sharing Services ($m), Split by 8 Key Regions, 2025-2030
- 3.2.1. Total Number of Car Sharing Users
- 3.3. E-scooters
- 3.3.1. Total Number of E-scooter Users
- Figure & Table 3.5: Total Number of E-scooter Users (m), Split by 8 Key Regions, 2025-2030
- 3.3.2. Total Spend on E-scooter Services
- Figure & Table 3.6: Total Spend on E-scooter Services ($m), Split by 8 Key Regions, 2025-2030
- 3.3.1. Total Number of E-scooter Users
- 3.4. Bike Sharing
- 3.4.1. Total Number of Bike Sharing Users
- Figure & Table 3.7: Total Number of Bike Sharing Users (m), Split by 8 Key Regions, 2025-2030
- 3.4.2. Total Spend on Bike Sharing Services
- Figure & Table 3.8: Total Spend on Bike Sharing Services ($m), Split by 8 Key Regions, 2025-2030
- 3.4.1. Total Number of Bike Sharing Users
- 3.5. MaaS & Public Transport
- 3.5.1. Total Number of MaaS & MaaS-enabled Public Transport Users
- Figure & Table 3.9: Total Number of MaaS & MaaS-enabled Public Transport Users (m), Globally, Split by 8 Key Regions, 2025-2030
- 3.5.2. Total Spend on MaaS & MaaS-enabled Public Transport Services
- Figure & Table 3.10: Total Spend on MaaS & MaaS-enabled Public Transport Services ($m), Globally, Split by 8 Key Regions, 2025-2030
- 3.5.1. Total Number of MaaS & MaaS-enabled Public Transport Users
 2034 年獲利型共乘市場預測-按車輛類型、服務類型、預訂方式、支付方式、動力系統、應用、最終用戶和地區進行全球分析。循環城市出行和車輛共享平台市場預測至2034年-按平台類型、車輛類型、服務模式、收入模式、最終用戶和地區分類的全球分析循環建築廢棄物管理平台市場預測至2034年-按平台類型、廢棄物分類、技術整合、服務模式、最終用戶和地區分類的全球分析循環車隊管理和共享旅遊平台市場預測至2034年—按車隊類型、循環策略、技術整合、服務模式、最終用戶和區域分類的全球分析城市共用物流市場預測至2034年-全球服務類型、共用模式、資產類型、技術、配送速度、最終用戶和區域分析共享旅遊市場預測至2034年:按服務模式、車輛類型、分銷管道和區域分類的全球分析
 共享旅遊市場:依服務模式、車輛類型、經營模式、銷售管道、產業類型和地區分類
 2026年全球共享旅遊市場報告2034年農村和郊區共用出行市場預測:按交通方式、用戶層、營運商類型、定價模式、服務類型和區域分類的全球分析共用旅遊和共乘平台市場預測:至 2034 年—按服務類型、車輛類型、技術屬性、經營模式、最終用戶和地區分類的全球分析