


 |
市場調查報告書
商品編碼
1703509
CPaaS - 全球市場 2025-2029Global CPaaS Market: 2025-2029 |
||||||
廣告科技合作推動成長,CPaaS 營收預計明年將超過 340 億美元
| 關鍵統計數據 | |
|---|---|
| 2025 年市值: | 302億美元 |
| 2029 年市值: | 481億美元 |
| 2025年至2029年的市場成長率 | 60% |
| 預測期: | 2025-2029 |
該研究包對未來 12 個月推動通訊平台即服務 (CPaaS) 市場發展的關鍵因素進行了全面的分析。特別是,它關注 CPaaS 平台如何轉變其服務以滿足對富媒體管道和對話訊息日益增長的需求。隨著訊息傳遞市場動盪,包括價格上漲和圍繞簡訊的詐欺行為,本報告成為利益相關者瞭解未來一年 CPaaS 關鍵投資機會的重要工具。
本報告提供了 11 個管道和 6 個垂直領域的 CPaaS 流量和收入預測,並針對最新的市場趨勢和機會進行了深入研究。它還包括一個具有廣泛分析的競爭排行榜,並以對 CPaaS 領域 15 位關鍵參與者的訪談為後盾。
主要特點
- 市場動態:提供 CPaaS 市場格局的詳細見解,並評估未來市場成長的關鍵推動因素,包括富媒體和對話式訊息服務對市場帶來的顛覆。它強調了 CPaaS 公司應關注的關鍵增值服務和合作夥伴關係,以便在未來的市場上取得成功,以及 CPaaS 支援服務的機會。該報告還研究了銀行、政府和公共服務、醫療保健、旅遊、零售和電子商務以及票務等主要行業的企業採用 CPaaS 的趨勢。此外,該報告還提供了國家準備指數,評估了 61 個國家的市場機會,確定了 CPaaS 供應商今年應該關注哪些國家。
- 關鍵要點和策略建議:深入分析 CPaaS 市場的關鍵發展機會、產業趨勢和見解,以及為利害關係人提供關鍵策略建議。
- 基準產業預測:提供 CPaaS 市場規模和預測,包括 CPaaS 總流量的五年預測,以及按通路和產業劃分的收入預測,包括銀行、政府和公共服務、醫療保健、旅遊和旅遊業、零售和電子商務、票務等。它還預測了使用 CPaaS 平台的公司總數和 CPaaS 訂閱總收入。
- Juniper Research 競爭排行榜:評估 18 家 CPaaS 供應商的能力。
樣本視圖
市場數據和預測報告
樣本
市場趨勢/策略報告
市場數據及預測報告
我們的研究套件包括一整套市場預測數據,其中包含 380 個表格和超過 263,000 個數據點。該調查套件包括以下指標:
- CPaaS 流量和收入(按管道)
- 電子郵件
- MMS
- 行動身份API
- 推播通知
- 線上和行動聊天機器人
- OTT 商業訊息傳遞
- RCS 商業訊息傳遞
- 簡訊
- 社交媒體
- 影片
- 聲音的
- CPaaS 流量和收入(按行業劃分)
- 銀行
- 政府和公共服務
- 衛生保健
- 零售/電子商務
- 門票銷售
- 旅遊/觀光
- 使用 CPaaS 平台的公司總數
- CPaaS 訂閱總收入
Juniper Research 互動式預測 (Excel) 具有以下功能:
- 統計分析:顯示數據期間內所有地區和國家的數據,並允許您搜尋特定指標。可以輕鬆修改圖表並將其匯出到剪貼簿。
- 國家資料工具:此工具可讓您查看預測期間內所有主要地區和國家的指標。您可以使用搜尋欄縮小想要查看的指標範圍。
- 國家比較工具:您可以選擇不同的國家進行比較。該工具包括匯出圖表的功能。
- 假設分析:透過五個互動式場景將預測指標與您自己的假設進行比較。
競技排行榜報告
競爭排行榜報告對 CPaaS 領域的 18 家主要供應商進行了詳細的評估和市場定位。
|
|
目錄
市場趨勢/策略
第1章 重點與策略建議
- 關鍵要點和策略建議
- 很重要的一點
- 戰略建議
第2章 未來市場展望
- CPaaS 市場:簡介
- CPaaS 市場的未來前景
- CPaaS 商業模式
- 增值服務
- CPaaS 合作夥伴關係
- 啟用 CPaaS
第3章:產業趨勢與未來成長
- 行業概況
- 銀行業務
- 衛生保健
- 零售/電子商務
- 旅行和旅遊
第4章 國家儲備指數
- 國家儲備指數:簡介
- 受矚目的市場
- 不斷成長的市場
- 飽和的市場
- 新興市場
競爭排行榜
第1章 競爭排行榜
第2章 公司簡介
- Bandwidth
- CEQUENS
- Cisco Webex
- CM.com
- Comviva
- GMS (Global Message Services)
- Infobip
- LINK Mobility
- Monty Mobile
- Route Mobile (Proximus Group)
- Sinch
- Soprano Design
- Syniverse
- Tanla Platforms
- Tata Communications
- Twilio
- Vonage
- 相關研究
數據/預測
第1章 市場預測及重點
- CPaaS 預測:簡介
- CPaaS 市場總價值
- CPaaS 流量收入(按通路)
- CPaaS 流量收入(按行業)
第2章 CPaaS 移動訊息傳遞預測
- CPaaS SMS 與 MMS 預測:簡介
- CPaaS SMS 和 MMS:預測方法
- CPaaS SMS 市場整體狀況
- CPaaS MMS 市場整體狀況
- CPaaS RCS 訊息市場
- 預測方法
- 總收入
- CPaaS OTT 訊息市場
- 預測方法
- 總收入
- CPaaS 身份 API 市場
- 預測方法
- 總收入
第3章 語音與視訊市場預測
- CPaaS 音訊視訊:簡介
- 預測方法
- CPaaS語音總收入
- CPaaS 影片總收入
'CPaaS Revenue to Exceed $34bn Next Year, as AdTech Partnerships Drive Growth'
| KEY STATISTICS | |
|---|---|
| Total market value in 2025: | $30.2bn |
| Total market value in 2029: | $48.1bn |
| Market growth 2025-2029: | 60% |
| Forecast period: | 2025-2029 |
Overview
Our latest "Communications Platform-as-a-Service (CPaaS)" research suite comprises a comprehensive analysis of the key factors driving this evolving market over the next 12 months; emphasising how CPaaS platforms must pivot their services as demand for rich media channels and conversational messaging grows. With the recent disruption within the messaging market, including the high price and fraud surrounding SMS, the report is an essential tool for stakeholders to understand where the key investment opportunities are for CPaaS over the next year.
The CPaaS market report includes several different options that can be purchased separately. This includes access to a market forecast of CPaaS traffic and revenue, split by 11 channels and six industries, and a detailed study highlighting the latest market trends and opportunities. It also includes a Competitor Leaderboard document containing an extensive analysis of the major players in the CPaaS space, backed by 15 interviews with leading market players. The coverage can also be purchased as a full research suite, containing all these elements and including a substantial discount.
The study will provide stakeholders with key information on how to succeed in the CPaaS market; including how growth in rich media and conversational messaging must impact CPaaS players' future strategies. It assesses the key value-added services that CPaaS players must offer, including rich media tools, chatbots, and network application programming interfaces (APIs). Its extensive coverage makes the CPaaS research suite an incredibly valuable resource for examining the future of this market.
All report content is delivered in the English language.
Key Features
- Market Dynamics: Provides detailed insight into the outlook of the CPaaS market; assessing key drivers to future market growth, including the disruption that rich media and conversational messaging services will have on the market. It addresses the key value-added services and partnerships that CPaaS players must focus on for future success in the market, as well as the opportunity for CPaaS enablement services. The research also explores enterprise adoption of CPaaS across key industries, including banking, government & public services, healthcare, travel & tourism, retail & eCommerce, and ticketing. Moreover, it includes a Country Readiness Index which assesses the market opportunities across 61 countries; identifying countries which must be of focus for CPaaS vendors this year.
- Key Takeaways & Strategic Recommendations: In-depth analysis of key development opportunities, industry trends, and findings within the CPaaS market; accompanied by key strategic recommendations for stakeholders.
- Benchmark Industry Forecasts: This provides market sizing and forecasts for CPaaS, including five-year forecasts for total CPaaS traffic, and revenue split by channel and sector, including banking, government & public services, healthcare, travel & tourism, retail & eCommerce, and ticketing. It also forecasts the total number of businesses using CPaaS platforms and the total CPaaS subscription revenue.
- Juniper Research Competitor Leaderboard: Key industry player capability and capacity assessment for 18 CPaaS vendors, via the Juniper Research Competitor Leaderboard.
SAMPLE VIEW
Market Data & Forecasting Report
The numbers tell you what's happening, but our written report details why, alongside the methodologies.
SAMPLE VIEW
Market Trends & Strategies Report
A comprehensive analysis of the current market landscape, alongside strategic recommendations.
Market Data & Forecasting Report
The market-leading research suite for the "CPaaS" market includes access to the full set of market forecast data of 380 tables and over 263,000 datapoints. Metrics in the research suite include:
- Total CPaaS traffic and revenue, split by channel:
- MMS
- Mobile Identity APIs
- Push Notifications
- Online & Mobile Chatbots
- OTT Business Messaging
- RCS Business Messaging
- SMS
- Social Media
- Video
- Voice
- Total CPaaS traffic and revenue is then further split by sector:
- Banking
- Government & Public Services
- Healthcare
- Retail & eCommerce
- Ticketing
- Travel & Tourism
- Total Number of Businesses Using CPaaS Platforms
- Total CPaaS Subscription Revenue
Juniper Research Interactive Forecast Excel contains the following functionality:
- Statistics Analysis: Users benefit from the ability to search for specific metrics, displayed for all regions and countries across the data period. Graphs are easily modified and can be exported to the clipboard.
- Country Data Tool: This tool lets users look at metrics for all key regions and countries in the forecast period. Users can refine the metrics displayed via a search bar.
- Country Comparison Tool: Users can select and compare different countries. The ability to export graphs is included in this tool.
- What-if Analysis: Here, users can compare forecast metrics against their own assumptions, via five interactive scenarios.
Market Trends & Strategies Report
This market study examines the "CPaaS" landscape in detail; assessing how disruption within the messaging market will impact the future growth of the CPaaS market, as well as which channels will be key to this growth. The report delivers an in-depth analysis of the strategic opportunities for vendors, addressing key partnership opportunities, industry demand, and the potential of CPaaS enablement services.
It also evaluates country level opportunities for CPaaS growth, via Juniper Research's Country Readiness Index; identifying the key markets where enterprises are expected to adopt the advanced capabilities of CPaaS which will lead to higher profit margins for CPaaS vendors, and therefore the markets that vendors should focus on next year.
Competitor Leaderboard Report
The Competitor Leaderboard report provides a detailed evaluation and market positioning for 18 leading vendors in the "CPaaS" space. The vendors are positioned as either established leaders, leading challengers or disruptors and challengers based on capacity and capability assessments:
|
|
This document is centred around the Juniper Research Competitor Leaderboard; a vendor positioning tool that provides an at-a-glance view of the competitive landscape in a market, backed by a robust methodology.
Table of Contents
Market Trends & Strategies
1. Key Takeaways & Strategic Recommendations
- 1.1. Key Takeaways & Strategic Recommendations
- 1.2. Key Takeaways
- 1.3. Strategic Recommendations
2. Future Market Outlook
- 2.1. CPaaS Market Introduction
- 2.2. Future Outlook For the CPaaS Market
- Figure 2.1: Global CPaaS Market Value in 2025, Split by 8 Key Regions: $30.1 billion
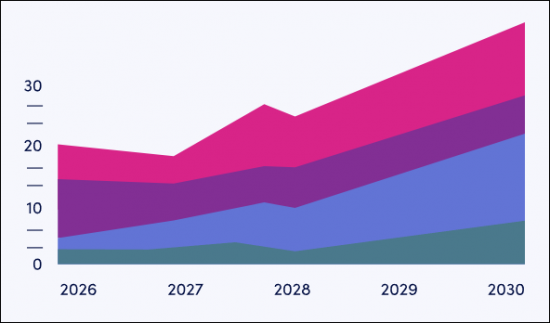
- Figure 2.2: CPaaS Revenue by Channel ($m), 2025-2029
- 2.3. CPaaS Business Model
- 2.3.1. Value-added Services
- i. Rich Messaging Channel Tools
- Figure 2.3: Marketing Message in Rich Media and SMS Format
- ii. Network APIs
- iii. Chatbots
- i. Rich Messaging Channel Tools
- 2.3.2. CPaaS Partnerships
- 2.3.3. CPaaS Enablement
- 2.3.1. Value-added Services
3. Industry Trends & Future Growth
- 3.1. Industry Overview
- Figure 3.1: CPaaS Market Share by Industry, 2025
- 3.1.1. Banking
- Figure 3.2: CPaaS Revenue in the Banking Industry ($m), Split by Channel, 2025-2029
- 3.1.2. Healthcare
- Figure 3.3: CPaaS Revenue in the Healthcare Industry ($m), Split by Channel, 2025-2029
- 3.1.3. Retail & eCommerce
- Figure 3.4: CPaaS Revenue in the Retail & eCommerce Industry ($m), Split by Channel, 2025-2029
- 3.1.4. Travel & Tourism
- Figure 3.5: CPaaS Revenue in the Travel & Tourism Industry ($m), Split by Channel, 2025-2029
- Figure 3.6: Example WhatsApp Message For Travel & Tourism
4. Country Readiness Index
- 4.1. Introduction to the Country Readiness Index
- Figure 4.1: Country Readiness Index Regional Definitions
- Table 4.2: Juniper Research Country Readiness Index Scoring Criteria: CPaaS Disruption
- Figure 4.3: Juniper Research Country Readiness Index: CPaaS
- Table 4.4: Juniper Research CPaaS Country Readiness Index: List of Country Categorisation
- 4.2. Focus Markets
- 4.2.1. Investment in 5G and Cloud Services Provides Basis for CPaaS Adoption in Focus Markets
- Figure 4.5: Proportion of SIMs that are 5G in Key Focus Markets in 2025 (%)
- 4.2.2. Clarity of Regulations Simplifies Compliance, Encouraging Enterprise Adoption
- 4.2.3. High Number of Rich Media Messaging Users in Focus Markets to Boost Adoption for Marketing Use Cases
- Figure 4.6: Proportion of Mobile Subscribers that Subscribe to OTT Messaging Applications in Key Focus Markets in 2025 (%)
- 4.2.1. Investment in 5G and Cloud Services Provides Basis for CPaaS Adoption in Focus Markets
- 4.3. Growth Markets
- 4.3.1. High Advertising Spend and Penetration of Rich Messaging Channels Indicates Future Demand for Marketing Use Cases
- Table 4.7: Average Spend per Business on Digital Advertising in Israel and Malaysia ($)
- 4.3.1. High Advertising Spend and Penetration of Rich Messaging Channels Indicates Future Demand for Marketing Use Cases
- 4.4. Saturated Markets
- 4.4.1. High Existing CPaaS Traffic, but Limited Opportunity for Growth with Rich Media Use Cases
- 4.5. Developing Markets
- 4.5.1. Vague or Highly Stringent Regulatory Frameworks
- 4.5.2. Low Demand for Advanced Capabilities of CPaaS Platforms
- Figure 4.8: Average Number of Chatbot Accesses per User per Month in Key Developing Markets in 2025
- Table 4.9: Juniper Research Competitor Leaderboard Scoring Heatmap: North America
- Table 4.10: Juniper Research Competitor Leaderboard Scoring Heatmap: Latin America
- Table 4.11: Juniper Research Competitor Leaderboard Scoring Heatmap: West Europe
- Table 4.12: Juniper Research Competitor Leaderboard Scoring Heatmap: Central & East Europe
- Table 4.13: Juniper Research Competitor Leaderboard Scoring Heatmap: Far East & China
- Table 4.14: Juniper Research Competitor Leaderboard Scoring Heatmap: Indian Subcontinent
- Table 4.15: Juniper Research Competitor Leaderboard Scoring Heatmap: Rest of Asia Pacific
- Table 4.16: Juniper Research Competitor Leaderboard Scoring Heatmap: Africa & Middle East
Competitor Leaderboard
1. Competitor Leaderboard
2. Company Profiles
- 2.1.1. Bandwidth
- i. Corporate Information
- Table 2.1: Bandwidth's Select Financial Information ($m), 2023-2024
- ii. Geographical Spread
- iii. Key Clients & Strategic Partnerships
- iv. High-level View of Offerings
- v. Juniper Research's View: Key Strengths & Strategic Development Opportunities
- i. Corporate Information
- 2.1.2. CEQUENS
- 2.1.3. Cisco Webex
- Table 2.3: Cisco's Selected Financial Information ($bn), Fiscal Year 2022-2024
- v. Juniper Research's View: Key Strengths & Strategic Development Opportunities
- 2.1.4. CM.com
- i. Corporate Information
- Table 2.4: Relevant Acquisitions Made by CM.com, 2020-present
- Table 2.5: CM.com's Select Financial Information (Euro-m), 2022-2024
- ii. Geographical Spread
- iii. Key Clients & Strategic Partners
- iv. High-level View of Offerings
- v. Juniper Research's View: Key Strengths & Strategic Development Opportunities
- i. Corporate Information
- 2.1.5. Comviva
- i. Corporate Information
- ii. Geographical Spread
- iii. Key Clients & Strategic Recommendations
- iv. High-level View of Offerings
- v. Juniper Research's View: Key Strengths & Strategic Development Opportunities
- 2.1.6. GMS (Global Message Services)
- i. Corporate Information
- ii. Geographical Spread
- iii. Key Clients & Strategic Partners
- iv. High-level View of Offerings
- v. Juniper Research's View: Key Strengths & Strategic Development Opportunities
- 2.1.7. Infobip
- i. Corporate Information
- Table 2.6: Infobip's Acquisitions - April 2021 to Present
- ii. Geographical Spread
- iii. Key Clients & Strategic Partnerships
- iv. High-level View of Offerings
- v. Juniper Research's View: Key Strengths & Strategic Development Opportunities
- i. Corporate Information
- 2.1.8. LINK Mobility
- i. Corporate Information
- iv. High-level View of Offerings
- v. Juniper Research's View: Key Strengths & Strategic Development Opportunities
- v. Juniper Research's View: Key Strengths & Strategic Development Opportunities
- 2.1.10. Monty Mobile
- 2.1.11. Route Mobile (Proximus Group)
- i. Corporate Information
- Table 2.7: Route Mobile's Financial Information (Indian Rupee- Cr), FY 2021-22 - FY 2023-24
- ii. Geographical Spread
- iii. Key Clients & Strategic Partners
- iv. High-level View of Offerings
- v. Juniper Research's View: Key Strengths & Strategic Development Opportunities
- i. Corporate Information
- 2.1.12. Sinch
- i. Corporate Information
- Table 2.8: Sinch's Most Recent Acquisitions, 2020-2021
- Table 2.9: Sinch's Select Financial Information (SEKm), 2022-2024
- ii. Geographical Spread
- iii. Key Clients & Strategic Partnerships
- iv. High-level View of Offerings
- v. Juniper Research's View: Key Strengths & Strategic Development Opportunities
- i. Corporate Information
- 2.1.13. Soprano Design
- i. Corporate Information
- ii. Geographical Spread
- Figure 2.10: Soprano Design's Global Reach and Support Network
- iii. Key Clients & Strategic Partnerships
- iv. High-level View of Offerings
- v. Juniper Research's View: Key Strengths & Strategic Development Opportunities
- 2.1.14. Syniverse
- i. Corporate Information
- ii. Geographical Spread
- iii. Key Customers & Strategic Partnerships
- iv. High-level View of Offerings
- v. Juniper Research's View: Key Strengths & Strategic Development Opportunities
- 2.1.15. Tanla Platforms
- i. Corporate Information
- ii. Geographical Spread
- iii. Key Clients & Strategic Partnerships
- iv. High-level View of Offerings
- v. Juniper Research's View: Key Strengths & Strategic Development Opportunities
- 2.1.16. Tata Communications
- i. Corporate Information
- Table 2.11: Tata Communications' Select Financial Information (Indian Rupee- in crore), FY 2022-23 & FY 2023-24
- ii. Geographical Spread
- iii. Key Clients & Strategic Partnerships
- v. Juniper Research's View: Key Strengths & Strategic Development Opportunities
- i. Corporate Information
- 2.1.17. Twilio
- i. Corporate Information
- Table 2.12: Twilio's Revenue Information 2021-present
- ii. Geographical Spread
- iii. Key Clients & Strategic Partnerships
- iv. High-level View of Offerings
- v. Juniper Research's View: Key Strengths & Strategic Development Opportunities
- i. Corporate Information
- 2.1.19. Vonage
- i. Corporate Information
- ii. Geographical Spread
- iii. Key Clients & Strategic Partnerships
- iv. High-level View of Offerings
- v. Juniper Research's View: Key Strengths & Strategic Development Opportunities
- Table 2.13: Juniper Research Competitor Leaderboard Scoring Criteria
- 2.2. Related Research
Data & Forecasting
1. Market Forecasts & Key Takeaways
- 1.1. Introduction to CPaaS Forecasts
- Figure 1.1: Key CPaaS Forecast Information
- 1.1.1. Total CPaaS Market Value
- Figure & Table 1.2: Total CPaaS Market Value ($m), Split by 8 Key Regions 2025-2029
- 1.1.2. Total CPaaS Traffic Revenue by Channel
- Figure & Table 1.3: Total CPaaS Traffic Revenue ($m), Split by 11 Key Channels, 2025-2029
- 1.1.3. CPaaS Traffic Revenue by Sector
- Figure & Table 1.4: Total CPaaS Traffic Revenue ($m), Split by 6 Key Sectors, 2025-2029
2. CPaaS Mobile Messaging Forecasts
- 2.1. Introduction to CPaaS SMS & MMS Forecasts
- 2.1.1. CPaaS SMS & MMS Forecast Methodology
- Figure 2.1: CPaaS SMS Forecast Methodology
- Figure 2.2: CPaaS MMS Forecast Methodology
- 2.1.2. Total CPaaS SMS Market
- Figure & Table 2.3: Total CPaaS SMS Revenue ($m), Split by 8 Key Regions, 2025-2029
- 2.1.3. Total CPaaS MMS Market
- Figure & Table 2.4: Total CPaaS SMS Revenue ($m), Split by 8 Key Regions, 2025-2029
- 2.1.1. CPaaS SMS & MMS Forecast Methodology
- 2.2. CPaaS RCS Messaging Market
- 2.2.1. RCS Business Messaging Forecast Methodology
- Figure 2.5: RCS Business Messaging Forecast Methodology
- 2.2.2. Total CPaaS RCS Revenue
- Figure & Table 2.6: Total CPaaS RCS Revenue ($m), Split by 8 Key Regions, 2025-2029
- 2.2.1. RCS Business Messaging Forecast Methodology
- 2.3. CPaaS OTT Messaging Market
- 2.3.1. OTT Business Messaging Forecast Methodology
- Figure 2.7: OTT Business Messaging Forecast Methodology
- 2.3.2. Total CPaaS OTT Business Messaging Revenue
- Figure & Table 2.8: Total CPaaS Revenue from OTT Business Messaging Traffic ($m), Split by 8 Key Regions, 2025-2029
- 2.3.1. OTT Business Messaging Forecast Methodology
- 2.4. CPaaS Identity API Market
- 2.4.1. Identity API Forecast Methodology
- Figure 2.9: Identity API Forecast Methodology
- 2.4.2. Total CPaaS Identity API Revenue
- Figure & Table 2.10: Total CPaaS Revenue from Mobile Identity API Calls ($m), Split by 8 Key Regions, 2025-2029
- 2.4.1. Identity API Forecast Methodology
3. Voice & Video Market Forecasts
- 3.1. Introduction to CPaaS Voice & Video
- 3.1.1. Voice & Video Forecast Methodology
- Figure 3.1: CPaaS Voice Forecast Methodology
- Figure 3.2: CPaaS Video Forecast Methodology
- 3.1.2. Total CPaaS Voice Revenue
- Figure & Table 3.3: Total CPaaS Voice Service Revenue ($m), Split by 8 Key Regions, 2025-2029
- 3.1.3. Total CPaaS Video Revenue
- Figure & Table 3.4: Total CPaaS Video Service Revenue ($m), Split by 8 Key Regions, 2025-2029
- 3.1.1. Voice & Video Forecast Methodology
 通訊平台即服務 (CPaaS) 市場規模、佔有率和成長分析:按服務類型、企業規模、應用領域、最終用戶產業、銷售管道和地區分類-2026-2033 年產業預測
 通訊平台即服務 (CPaaS) 市場:按最終用戶產業和地區分類
 2026年全球通訊平台(MaaP)市場報告
 通訊平台即服務 (CPaaS) 市場預測至 2034 年—按組件、通訊管道、部署模式、企業規模、應用程式、最終用戶和地區分類的全球分析電信平台即服務 (TPaaS) 市場預測至 2034 年—按組件、部署模式、平台類型、企業用例、最終用戶和區域分類的全球分析
 通訊平台即服務 (CPaaS) 市場:2026 年至 2032 年全球市場預測(按服務類型、部署模式、組織規模、應用程式和最終用戶分類)
 通訊平台即服務 (CPaaS) 市場規模、佔有率、趨勢和預測:按組件、企業規模、行業和地區分類,2026-2034 年2026年全球通訊平台即服務(CPaaS)市場報告
 CPaaS(通訊平台即服務):市場佔有率分析、產業趨勢與統計資料、成長預測(2026-2031 年)印度通訊平台即服務 (CPaaS) 市場佔有率分析、行業趨勢、統計數據和成長預測 (2026-2031)