


 |
市場調查報告書
商品編碼
2109272
回收杯市場:商業機會、成長要素、產業趨勢分析及2026-2035年預測Recyclable Cups Market Opportunity, Growth Drivers, Industry Trend Analysis, and Forecast 2026 - 2035 |
||||||

全球可再生盃市場預計到 2025 年將價值 211 億美元,年複合成長率為 6.3%,到 2035 年將達到 387 億美元。
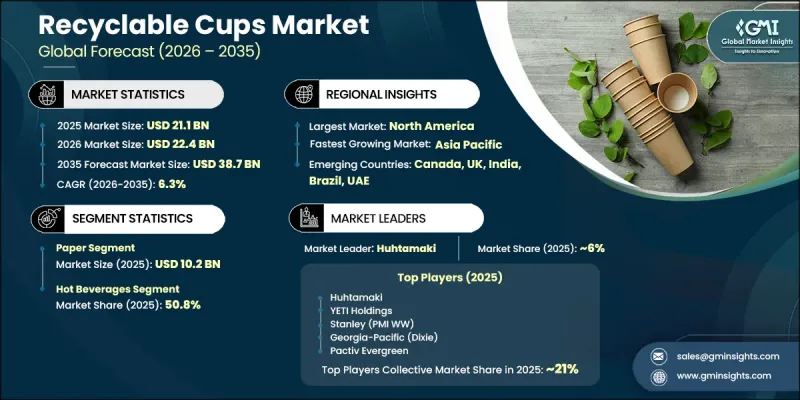
市場擴張的驅動力不僅在於消費量的成長,還在於監管政策轉向新型材料的轉變。對傳統塑膠製品日益嚴格的監管正在加速主要市場向經認證的可回收杯的過渡。企業永續發展措施的增加、消費者環保意識的提升以及廢棄物管理實踐的改進,都進一步推動了可回收包裝的普及。隨著企業在保持營運效率的同時努力滿足環保標準,可回收杯正成為現代食品服務包裝策略的重要組成部分。政府法規和永續發展措施的共同作用,為紙杯和其他可回收杯材料創造了長期發展機會。預計全球供應鏈對環保杯解決方案的需求將進一步成長,持續減少對塑膠替代品的依賴。
| 市場範圍 | |
|---|---|
| 開始年份 | 2025 |
| 預測期 | 2026-2035 |
| 上市時的市場規模 | 211億美元 |
| 預測金額 | 387億美元 |
| 複合年成長率 | 6.3% |
預計到2025年,紙杯市場規模將達到102億美元,並在2035年之前以5.7%的複合年成長率成長。紙杯憑藉其完善的生產系統、廣泛的供應管道以及在永續性包裝框架中的高認可度,繼續保持主導地位。隨著企業尋求符合回收基礎設施和環保目標的替代方案,對纖維基紙杯的需求持續成長。此細分市場的成長主要得益於經認證的可回收阻隔塗層紙杯的日益普及,與採用傳統塑膠內襯的紙杯相比,這類紙杯通常具有更高的附加價值。需求成長的驅動力既來自對替代產品的需求,也來自對更優質、可回收包裝解決方案日益成長的偏好。
預計到2025年,熱飲細分市場將佔據50.8%的市場佔有率,並在2035年之前以6.1%的複合年成長率成長。此細分市場強勁的市場地位得益於咖啡零售商、餐飲服務商和飲料連鎖店的穩定需求,這些企業對可回收包裝的採用率已顯著提高。用於熱飲的紙杯設計不斷改進,兼具隔熱、耐用和防潮等功能,推動了可回收紙杯行業的創新。此外,專為熱飲應用開發的阻隔塗層技術的進步,也透過提升性能標準,促進了其在其他飲料類別中的更廣泛應用。
預計到2025年,北美可回收杯市場規模將達到91億美元,市佔率將達43.2%。這主要得益於成熟的快餐連鎖店和咖啡零售網路的強勁需求,以及針對傳統一次性塑膠包裝日益成長的監管壓力。企業和機構對永續採購慣例的日益重視,也推動了可回收杯的普及。此外,環保政策和減少廢棄物的舉措,透過增加商業和機構應用中對紡織品和其他可回收包裝形式的需求,進一步加速了市場轉型。
目錄
第1章:調查方法和範圍
第2章執行摘要
第3章 行業洞察
- 產業生態系分析
- 供應商情況
- 利潤率
- 每個階段增加的價值
- 影響價值鏈的因素
- 影響產業的因素
- 促進因素
- 嚴格的監管禁令和對一次性塑膠課稅正在促進材料替代。
- 消費者越來越偏好選擇環保和永續的包裝
- 餐飲連鎖店的ESG舉措與永續發展承諾
- 食品配送、外帶文化和行動消費的興起。
- 產業潛在風險與挑戰
- 各地的堆肥和回收認證標準零散且不一致。
- 消費者對杯子標籤上的「可回收」、「可堆肥」和「可生物分解」等概念感到困惑。
- 原料價格波動(紙漿、PLA樹脂、鋁、竹纖維)
- 在環境監管市場中,與可重複使用杯解決方案競爭
- 機會
- 水性及生物基阻隔塗層的創新,實現了真正的可回收性
- 押金回饋系統(DRS)正在為可重複使用和可回收的杯子創造一種新的市場結構。
- 新興國家飲料產業的擴張正在推動銷售量的需求。
- 在杯子製造中採用再生材料(PCR)
- 促進因素
- 成長潛力分析
- 未來市場趨勢
- 技術與創新展望
- 最新科技趨勢
- 新興技術
- 監理情勢
- 標準和合規要求
- 區域監理框架
- 認證標準
- 貿易數據分析
- 進出口量及進口額趨勢
- 主要貿易路線及關稅的影響
- 價格分析
- 對過去價格趨勢的分析
- 按業務類型(高階/低階/大眾市場)分類的定價策略
- 人工智慧和生成式人工智慧對市場的影響
- 利用人工智慧改造現有經營模式
- 按細分市場分類的生成式人工智慧用例和部署藍圖
- 風險、限制和監管考量
- 波特的分析
- PESTLE分析
第4章 競爭情勢
- 介紹
- 企業市佔率分析
- 按地區
- 企業矩陣分析
- 主要市場公司的競爭分析
- 競爭定位矩陣
- 主要進展
- 併購
- 夥伴關係和聯盟
- 新產品發布
- 業務拓展計劃
第5章 市場估算與預測:依材料類型分類,2022-2035年
- 紙
- 生質塑膠
- 玻璃
- 竹子
- 金屬
第6章 市場估計與預測:依產能分類,2022-2035年
- 8盎司或更少
- 9-16盎司
- 17-24盎司
- 24盎司或以上
第7章 市場估算與預測:依封閉系統分類,2022-2035年
- 平蓋
- 圓頂形蓋子
- 無吸管蓋
- 無蓋(敞口)
第8章 市場估計與預測:依應用領域分類,2022-2035年
- 熱飲
- 冷飲
- 食品包裝
第9章 市場估價與預測:依最終用戶分類,2022-2035年
- 食品服務業
- 餐廳
- 咖啡店
- 咖啡連鎖店
- 速食店(QSR)
- 對機構而言
- 學校
- 大學
- 醫院
- 零售
- 家
第10章 市場估價與預測:依通路分類,2022-2035年
- 線上
- 每家公司的網站
- 電子商務
- 離線
- 超級市場和大賣場
- 專賣店
- 其他(食品服務業供應商等)
第11章 市場估價與預測:按地區分類,2022-2035年
- 北美洲
- 美國
- 加拿大
- 歐洲
- 德國
- 英國
- 法國
- 義大利
- 西班牙
- 亞太地區
- 中國
- 印度
- 日本
- 韓國
- 澳洲
- 印尼
- 馬來西亞
- 拉丁美洲
- 巴西
- 墨西哥
- 阿根廷
- 中東和非洲
- 沙烏地阿拉伯
- UAE
- 南非
第12章:公司簡介
- Huhtamaki Oyj
- Dart Container Corporation(Solo Cup)
- Berry Global Group, Inc.
- Pactiv Evergreen Inc.
- Georgia-Pacific LLC(Koch Industries)
- Graphic Packaging International
- Stora Enso Oyj
- Sabert Corporation
- Greiner Packaging International GmbH
- Lollicup USA Inc.
- Eco-Products(Novatek International)
- WinCup Holdings
- Footprint
- World Centric
- BioPak Pty Ltd
The Global Recyclable Cups Market was valued at USD 21.1 billion in 2025 and is estimated to grow at a CAGR of 6.3% to reach USD 38.7 billion by 2035.
The market's expansion is influenced by regulatory-driven material conversion rather than only rising consumption volumes. Growing restrictions on conventional plastic products are accelerating the transition toward certified recyclable cup solutions across major markets. Increasing corporate sustainability commitments, stronger environmental awareness among consumers, and changing waste management practices are further supporting the shift toward recyclable packaging formats. Recyclable cups are becoming an essential component of modern foodservice packaging strategies as businesses focus on meeting environmental standards while maintaining operational efficiency. The combined impact of government regulations and sustainability initiatives is creating long-term opportunities for paper-based and other recyclable cup materials. The continued transition away from plastic-based alternatives is expected to strengthen demand for environmentally responsible cup solutions across global supply chains.
| Market Scope | |
|---|---|
| Start Year | 2025 |
| Forecast Year | 2026-2035 |
| Start Value | $21.1 Billion |
| Forecast Value | $38.7 Billion |
| CAGR | 6.3% |
The paper segment generated USD 10.2 billion in 2025 and is projected to grow at a CAGR of 5.7% through 2035. Paper cups maintain a leading position due to their well-developed manufacturing ecosystem, broad availability, and favorable acceptance within sustainability-focused packaging frameworks. Fiber-based cup formats continue to gain preference as businesses seek alternatives that align with recycling infrastructure and environmental objectives. The segment's growth is supported by increasing adoption of certified recyclable barrier-coated paper cups, which generally command higher value compared with conventional plastic-lined alternatives. Demand growth is being shaped by both replacement requirements and the increasing preference for improved-performance recyclable packaging solutions.
The hot beverages sub-segment accounted for 50.8% share in 2025 and is anticipated to grow at a CAGR of 6.1% through 2035. The segment's strong market position is supported by consistent demand from coffee retailers, foodservice operators, and beverage chains where recyclable packaging adoption has progressed significantly. Paper cup designs used for hot beverages are developed to provide thermal protection, durability, and moisture resistance, making them a key driver of innovation within the recyclable cups industry. Improvements in barrier coating technologies developed for hot beverage applications are also supporting broader adoption across other beverage categories by enhancing performance standards.
North America Recyclable Cups Market reached USD 9.1 billion, capturing a 43.2% share in 2025, driven by strong demand from established QSR and coffee retail networks along with increasing regulatory pressure on conventional single-use plastic packaging. The growing focus on sustainable procurement practices among businesses and institutions is encouraging the adoption of recyclable cup alternatives. Environmental policies and waste reduction initiatives are further supporting market conversion by increasing demand for fiber-based and other recyclable packaging formats across commercial and institutional applications.
Major players operating in the global recyclable cups market are BioPak Pty Ltd, Huhtamaki Oyj, Sabert Corporation, Graphic Packaging International, Berry Global Group, Inc., World Centric, Dart Container Corporation (Solo Cup), Stora Enso Oyj, Eco-Products (Novatek International), Pactiv Evergreen Inc., Greiner Packaging International GmbH, Footprint, Georgia-Pacific LLC (Koch Industries), Lollicup USA Inc., and WinCup Holdings. Companies operating in the recyclable cups market are adopting strategies focused on sustainable product development, manufacturing expansion, partnerships, and innovation in material technologies to strengthen their competitive position. Market participants are investing in recyclable coatings, improved barrier solutions, and advanced manufacturing processes to enhance cup performance while meeting evolving environmental requirements. Companies are also expanding their product portfolios to serve diverse end-use industries, including foodservice, beverage chains, and institutional buyers. Strategic collaborations with retailers, packaging distributors, and sustainability-focused organizations are helping manufacturers improve market penetration. Businesses are emphasizing circular economy initiatives, supply chain optimization, and the development of cost-effective recyclable solutions to maintain long-term growth.
Table of Contents
Chapter 1 Methodology & Scope
- 1.1 Market scope & definitions
- 1.2 Research design
- 1.2.1 Research approach
- 1.2.2 Data collection methods
- 1.3 Base estimates and calculations
- 1.3.1 Base year calculation
- 1.3.2 Market estimates & forecasts parameters
- 1.4 Forecast Model
- 1.4.1 Key trends for market estimates
- 1.4.2 Quantified market impact analysis
- 1.4.2.1 Mathematical impact of growth parameters on forecast
- 1.4.3 Scenario analysis framework
- 1.5 Primary research and validation
- 1.5.1 Some of the primary sources (but not limited to)
- 1.6 Data mining sources
- 1.6.1 Paid Sources
- 1.7 Primary research and validation
- 1.7.1 Primary sources
- 1.8 Research Trail & confidence scoring
- 1.8.1 Research trail components
- 1.8.2 Scoring components
- 1.9 Research transparency addendum
- 1.9.1 Source attribution framework
- 1.9.2 Quality assurance metrics
- 1.10 Our commitment to trust
Chapter 2 Executive Summary
- 2.1 Industry 360° synopsis
- 2.2 Key market trends
- 2.2.1 Material type
- 2.2.2 Capacity
- 2.2.3 Closure type
- 2.2.4 Application
- 2.2.5 End-user
- 2.2.6 Distribution channel
Chapter 3 Industry Insights
- 3.1 Industry ecosystem analysis
- 3.1.1 Supplier landscape
- 3.1.2 Profit margin
- 3.1.3 Value addition at each stage
- 3.1.4 Factor affecting the value chain
- 3.2 Industry impact forces
- 3.2.1 Growth drivers
- 3.2.1.1 Stringent regulatory bans & levies on single-use plastics driving material substitution
- 3.2.1.2 Rising consumer preference for eco-friendly & sustainable packaging
- 3.2.1.3 Corporate ESG commitments & sustainability pledges by foodservice chains
- 3.2.1.4 Growth of food delivery, takeaway culture & on-the-go consumption
- 3.2.2 Industry pitfalls & challenges
- 3.2.2.1 Fragmented & inconsistent composting/recycling certification standards across regions
- 3.2.2.2 Consumer confusion between recyclable, compostable & biodegradable cup claims
- 3.2.2.3 Raw material price volatility (pulp, PLA resin, aluminum, bamboo fiber)
- 3.2.2.4 Competition from reusable cup solutions in environmentally regulated markets
- 3.2.3 Opportunities
- 3.2.3.1 Innovation in water-based & bio-based barrier coatings enabling true recyclability
- 3.2.3.2 Deposit-return schemes (DRS) creating new market structures for reusable recyclable cups
- 3.2.3.3 Expanding beverage industry in emerging economies driving volume demand
- 3.2.3.4 Adoption of post-consumer recycled (PCR) content in cup manufacturing
- 3.2.1 Growth drivers
- 3.3 Growth potential analysis
- 3.4 Future market trends
- 3.5 Technology and innovation landscape
- 3.5.1 Current technological trends
- 3.5.2 Emerging technologies
- 3.6 Regulatory landscape
- 3.6.1 Standards and compliance requirements
- 3.6.2 Regional regulatory frameworks
- 3.6.3 Certification standards
- 3.7 Trade data analysis (HS Code 3924.10)
- 3.7.1 Import/export volume & value trends
- 3.7.2 Key trade corridors & tariff impact
- 3.8 Pricing analysis
- 3.8.1 Historical price trend analysis (driven by primary research)
- 3.8.2 Pricing strategy by player type (premium / value / mass market)
- 3.9 Impact of AI & generative AI on the market
- 3.9.1 AI-driven disruption of existing business models
- 3.9.2 GenAI use cases & adoption roadmap by segment
- 3.9.3 Risks, limitations & regulatory considerations
- 3.10 Porter's analysis
- 3.11 PESTEL analysis
Chapter 4 Competitive Landscape, 2025
- 4.1 Introduction
- 4.2 Company market share analysis
- 4.2.1 By Region
- 4.2.1.1 North America
- 4.2.1.2 Europe
- 4.2.1.3 Asia Pacific
- 4.2.1.4 Latin America
- 4.2.1.5 Middle East & Africa
- 4.2.1 By Region
- 4.3 Company matrix analysis
- 4.4 Competitive analysis of major market players
- 4.5 Competitive positioning matrix
- 4.6 Key developments
- 4.6.1 Mergers & acquisitions
- 4.6.2 Partnerships & collaborations
- 4.6.3 New product launches
- 4.6.4 Expansion plans
Chapter 5 Market Estimates & Forecast, By Material Type, 2022 - 2035, (USD Billion) (Million Units)
- 5.1 Key trends
- 5.2 Paper
- 5.3 Bioplastics
- 5.4 Glass
- 5.5 Bamboo
- 5.6 Metal
Chapter 6 Market Estimates & Forecast, By Capacity, 2022 - 2035, (USD Billion) (Million Units)
- 6.1 Key trends
- 6.2 Up to 8 oz
- 6.3 9-16 oz
- 6.4 17-24 oz
- 6.5 Above 24 oz
Chapter 7 Market Estimates & Forecast, By Closure Type, 2022 - 2035, (USD Billion) (Million Units)
- 7.1 Key trends
- 7.2 Flat lids
- 7.3 Domed lids
- 7.4 Strawless lids
- 7.5 No lid (open-top)
Chapter 8 Market Estimates & Forecast, By Application, 2022 - 2035, (USD Billion) (Million Units)
- 8.1 Key trends
- 8.2 Hot beverages
- 8.3 Cold beverages
- 8.4 Food packaging
Chapter 9 Market Estimates & Forecast, By End-User, 2022 - 2035, (USD Billion) (Million Units)
- 9.1 Key trends
- 9.2 Food service
- 9.2.1 Restaurants
- 9.2.2 Cafes
- 9.2.3 Coffee chains
- 9.2.4 Quick service restaurants (QSRs)
- 9.3 Institutional
- 9.3.1 Schools
- 9.3.2 Universities
- 9.3.3 Hospitals
- 9.4 Retail
- 9.5 Household
Chapter 10 Market Estimates & Forecast, By Distribution Channel, 2022 - 2035, (USD Billion) (Million Units)
- 10.1 Key trends
- 10.2 Online
- 10.2.1 Company websites
- 10.2.2 E-commerce
- 10.3 Offline
- 10.3.1 Supermarkets/hypermarkets
- 10.3.2 Specialty stores
- 10.3.3 Others (foodservice suppliers etc.)
Chapter 11 Market Estimates & Forecast, By Region, 2022 - 2035, (USD Billion) (Million Units)
- 11.1 Key trends
- 11.2 North America
- 11.2.1 U.S.
- 11.2.2 Canada
- 11.3 Europe
- 11.3.1 Germany
- 11.3.2 UK
- 11.3.3 France
- 11.3.4 Italy
- 11.3.5 Spain
- 11.4 Asia Pacific
- 11.4.1 China
- 11.4.2 India
- 11.4.3 Japan
- 11.4.4 South Korea
- 11.4.5 Australia
- 11.4.6 Indonesia
- 11.4.7 Malaysia
- 11.5 Latin America
- 11.5.1 Brazil
- 11.5.2 Mexico
- 11.5.3 Argentina
- 11.6 MEA
- 11.6.1 Saudi Arabia
- 11.6.2 UAE
- 11.6.3 South Africa
Chapter 12 Company Profiles
- 12.1 Huhtamaki Oyj
- 12.2 Dart Container Corporation (Solo Cup)
- 12.3 Berry Global Group, Inc.
- 12.4 Pactiv Evergreen Inc.
- 12.5 Georgia-Pacific LLC (Koch Industries)
- 12.6 Graphic Packaging International
- 12.7 Stora Enso Oyj
- 12.8 Sabert Corporation
- 12.9 Greiner Packaging International GmbH
- 12.10 Lollicup USA Inc.
- 12.11 Eco-Products (Novatek International)
- 12.12 WinCup Holdings
- 12.13 Footprint
- 12.14 World Centric
- 12.15 BioPak Pty Ltd

 玻璃蓋市場:全球市場預測,2026-2032年
 杯子和杯蓋:市場佔有率分析、行業趨勢和統計數據、成長預測(2026-2031 年)一次性杯子市場:2026-2032年全球市場預測(按產品類型、產能、材料類型、最終用戶、應用和分銷管道分類)雙層保溫杯市場:按材料、應用、容量、分銷管道和最終用途分類-2026-2032年全球市場預測
 2026年全球可回收杯市場報告
 全球一次性杯子市場規模、佔有率、趨勢和成長分析報告(2026-2034年)全球發泡杯市場規模、佔有率、趨勢和成長分析報告(2026-2034年)2026年全球攜帶式杯市場報告2026年全球杯蓋包裝市場報告2026年全球杯蓋市場報告