


 |
市場調查報告書
商品編碼
2109268
2026 年至 2035 年金屬氫生產的市場機會、成長要素、產業趨勢分析與預測。Metal Hydrogen Generation Market Opportunity, Growth Drivers, Industry Trend Analysis, and Forecast 2026 - 2035 |
||||||

全球金屬氫生產市場預計到 2025 年將價值 94 億美元,預計到 2035 年將以 8% 的複合年成長率成長至 200 億美元。
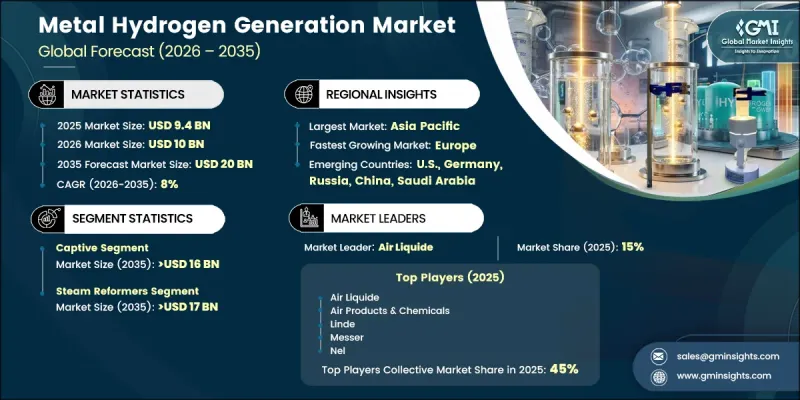
隨著各組織機構日益重視可靠、靈活且環保的氫氣技術,金屬氫氣產業正經歷持續成長。金屬氫氣產生系統透過可控的化學過程生產氫氣,提供了一種切實可行的方法,最大限度地減少了對傳統氫氣生產技術的依賴,同時確保了在需要時穩定的氫氣供應。這些系統能夠直接在用氫點供氫,使其成為儲存和運輸效率較低的應用場景的理想選擇。對氫能基礎設施和清潔能源開發的投資不斷增加,持續創造成長機會。製造商正致力於提高反應性能、材料利用率,並設計能夠滿足各種運作需求的緊湊型系統。這些系統具有操作柔軟性,能夠無縫整合到現有生產環境中,隨著各行業對氫氣需求的成長,進一步推動了市場擴張。材料、反應最佳化、數位監控和智慧控制系統等的持續技術進步,正在推動效率的提升、維護的簡化和安全性的增強,從而支持全球金屬氫氣生產市場的長期發展。
| 市場範圍 | |
|---|---|
| 開始年份 | 2025 |
| 預測期 | 2026-2035 |
| 上市時的市場規模 | 94億美元 |
| 預測金額 | 200億美元 |
| 複合年成長率 | 8% |
預計到2035年,專屬式市場規模將達160億美元。增加對現有生產設施升級改造和引進先進高效製氫系統的投資,正推動氫氣在工業領域的消費成長。各企業正整合自動化技術、先進的監控能力和最佳化的生產流程,以提高營運效率、提升生產力並降低營運成本。同時,持續投資擴大產能和技術現代化,增強了供應可靠性,確保了生產的連續性。
預計2035年,蒸氣重整市場規模將達到170億美元。對大規模氫氣生產的強勁需求以及現有生產基礎設施的不斷完善,持續推動先進蒸氣重整技術的應用。產業相關人員正透過引入高效系統和改進製程控制,對現有生產設施進行現代化改造,以最大限度地提高產量並降低營運成本。各終端用戶產業對氫氣需求的成長也推動了產能擴張和新生產項目的投資。此外,各公司正在加強原料採購並升級生產基礎設施,以確保氫氣供應的長期穩定性。
預計到2035年,美國金屬氫氣市場規模將達14億美元。市場成長的驅動力主要來自不斷擴大的工業活動以及氫能在清潔能源、發電、運輸和工業流程等領域的日益普及。企業正在採用金屬氫氣技術,以實現按需氫氣生產、提高能源可靠性、減少對傳統燃料的依賴並提升整體營運效率。此外,持續的技術改進使製造商能夠在提高氫氣產量的同時降低生產成本並提升系統性能。
目錄
第1章:調查方法和範圍
第2章執行摘要
第3章 行業洞察
- 產業生態系統
- 原物料供應及採購分析
- 生產能力評估
- 供應鏈韌性與風險因素
- 配電網路分析
- 監理情勢
- 北美洲
- 歐洲
- 亞太地區
- 中東和非洲
- 拉丁美洲
- 影響產業的因素
- 促進因素
- 產業潛在風險與挑戰
- 成長潛力分析
- 波特的分析
- PESTLE分析
- 新機會和趨勢
- 數位化和物聯網整合
- 投資分析及未來展望
第4章 競爭情勢
- 介紹
- 企業市佔率分析:按地區分類
- 北美洲
- 歐洲
- 亞太地區
- 中東和非洲
- 拉丁美洲
- 主要市場公司的競爭分析
- 競爭定位矩陣
- 主要進展
- 併購
- 夥伴關係和聯盟
- 新產品發布
- 業務拓展計劃及資金籌措
- 按公司規模進行基準測試
- 排名分類標準與遴選標準
- 按銷售額、地區和創新能力分類的層級定位矩陣。
第5章 市場規模及預測:以交付方式分類,2022-2035年
- 專屬式
- 商人
第6章 市場規模及預測:依製程分類,2022-2035年
- 蒸氣重組裝置
- 電解
- 其他
第7章 市場規模及預測:依地區分類,2022-2035年
- 北美洲
- 美國
- 加拿大
- 墨西哥
- 歐洲
- 德國
- 義大利
- 荷蘭
- 俄羅斯
- 亞太地區
- 中國
- 印度
- 日本
- 中東和非洲
- 沙烏地阿拉伯
- 伊朗
- UAE
- 南非
- 拉丁美洲
- 巴西
- 阿根廷
- 智利
第8章:公司簡介
- AFC Energy plc
- Air Liquide
- Air Products and Chemicals
- American Elements
- China Baowu Steel Group
- Enapter
- GRZ Technologies
- H Bank Technologies Inc.
- Hazer Group
- Heraeus Precious Metals
- Hydrogenera
- JSW Group
- Linde
- McPhy Energy SA
- Messer Group
- Nel Hydrogen
- Plug Power
- Reliance Industries
- Shell
- SSAB
The Global Metal Hydrogen Generation Market was valued at USD 9.4 billion in 2025 and is estimated to grow at a CAGR of 8% to reach USD 20 billion by 2035.
The metal hydrogen generation industry is witnessing sustained expansion as organizations increasingly prioritize dependable, adaptable, and environmentally responsible hydrogen production technologies. Metal-based hydrogen generation systems provide a practical approach to producing hydrogen through controlled chemical processes, minimizing reliance on conventional production techniques while ensuring a consistent supply whenever required. Their ability to deliver hydrogen at the point of use makes these systems well suited for applications where storage and transportation can be less efficient. Growing investments in hydrogen infrastructure and clean energy development continue to create favorable opportunities for market growth. Manufacturers are concentrating on improving reaction performance, enhancing material efficiency, and designing compact systems that address a wide range of operational needs. Increasing hydrogen demand across multiple industries is further supporting market expansion, as these systems offer operational flexibility and seamless integration into existing production environments. Continuous technological advancements in materials, reaction optimization, digital monitoring, and intelligent control systems are improving efficiency, simplifying maintenance, enhancing safety, and supporting the long-term development of the global metal hydrogen generation market.
| Market Scope | |
|---|---|
| Start Year | 2025 |
| Forecast Year | 2026-2035 |
| Start Value | $9.4 Billion |
| Forecast Value | $20 Billion |
| CAGR | 8% |
The captive segment is expected to reach USD 16 billion by 2035. Rising investments in upgrading existing production facilities and deploying advanced, high-efficiency hydrogen generation systems are supporting increasing hydrogen consumption across industrial operations. Companies are integrating automation technologies, advanced monitoring capabilities, and optimized production processes to improve operational efficiency, increase productivity, and lower operating expenses. At the same time, ongoing investments in production capacity expansion and technology modernization are strengthening supply reliability while ensuring uninterrupted manufacturing operations.
The steam reformers segment is anticipated to capture USD 17 billion by 2035. Strong demand for large-scale hydrogen production and the availability of established production infrastructure continue to support the deployment of advanced steam reforming technologies. Industry participants are modernizing existing production assets with higher-efficiency systems and enhanced process controls to maximize output while reducing operational costs. Rising hydrogen demand across various end-use industries is also encouraging capacity expansion and investments in new production projects. In addition, companies are strengthening feedstock availability and upgrading production infrastructure to ensure a dependable hydrogen supply over the long term.
U.S. Metal Hydrogen Generation Market is projected to reach USD 1.4 billion by 2035. Market growth is being supported by expanding industrial activities and the increasing adoption of hydrogen across clean energy, power generation, transportation, and industrial processing applications. Companies are implementing metal-based hydrogen generation technologies to produce hydrogen on demand, improve energy reliability, reduce dependence on traditional fuel sources, and enhance overall operational efficiency. Continuous investments in technology improvements are also helping manufacturers increase hydrogen output while lowering production costs and improving system performance.
Major companies operating in the global metal hydrogen generation market include AFC Energy, Air Liquide, Air Products and Chemicals, American Elements, China Baowu Steel Group, Enapter, GRZ Technologies, H Bank Technologies Inc., Hazer Group, Heraeus Precious Metals, Hydrogenera, JSW Group, Linde, McPhy Energy S.A., Messer Group, Nel Hydrogen, Plug Power, Reliance Industries, Shell, and SSAB. Companies operating in the metal hydrogen generation market are strengthening their market position through continuous investments in technology innovation, production capacity expansion, and advanced material development. Manufacturers are focusing on improving hydrogen generation efficiency, enhancing system reliability, and developing compact solutions that meet evolving industrial requirements. Many companies are expanding strategic partnerships, strengthening regional distribution networks, and increasing research and development activities to accelerate product commercialization. Businesses are also integrating digital monitoring, automation, and intelligent control technologies to improve operational performance and reduce maintenance requirements. Capacity modernization, manufacturing optimization, and investments in sustainable production processes are helping companies improve cost competitiveness while supporting long-term growth.
Table of Contents
Chapter 1 Methodology & Scope
- 1.1 Research design
- 1.2 Quality commitment
- 1.2.1 GMI AI policy & data integrity commitment
- 1.2.1.1 Source consistency protocol
- 1.2.1 GMI AI policy & data integrity commitment
- 1.3 Research trail & confidence scoring
- 1.3.1 Research trail components
- 1.3.2 Scoring components
- 1.4 Data collection
- 1.4.1 Partial list of primary sources
- 1.5 Data mining sources
- 1.5.1 Paid sources
- 1.5.1.1 Sources, by region
- 1.5.1 Paid sources
- 1.6 Base estimates and calculations
- 1.6.1 Base year calculation for any one approach
- 1.7 Forecast model
- 1.8 Research transparency addendum
- 1.8.1 Source attribution framework
- 1.8.2 Quality assurance metrics
- 1.8.3 Our commitment to trust
- 1.9 Market definitions
Chapter 2 Executive Summary
- 2.1 Industry synopsis, 2022 – 2035
- 2.2 Business trends
- 2.3 Delivery mode trends
- 2.4 Process trends
- 2.5 Regional trends
Chapter 3 Industry Insights
- 3.1 Industry ecosystem
- 3.1.1 Raw material availability & sourcing analysis
- 3.1.2 Manufacturing capacity assessment
- 3.1.3 Supply chain resilience & risk factors
- 3.1.4 Distribution network analysis
- 3.2 Regulatory landscape
- 3.2.1 North America
- 3.2.2 Europe
- 3.2.3 Asia Pacific
- 3.2.4 Middle East & Africa
- 3.2.5 Latin America
- 3.3 Industry impact forces
- 3.3.1 Growth drivers
- 3.3.2 Industry pitfalls & challenges
- 3.4 Growth potential analysis
- 3.5 Porter's analysis
- 3.5.1 Bargaining power of suppliers
- 3.5.2 Bargaining power of buyers
- 3.5.3 Threat of new entrants
- 3.5.4 Threat of substitutes
- 3.6 PESTEL analysis
- 3.6.1 Political factors
- 3.6.2 Economic factors
- 3.6.3 Social factors
- 3.6.4 Technological factors
- 3.6.5 Legal factors
- 3.6.6 Environmental factors
- 3.7 Emerging opportunities & trends
- 3.8 Digitalization & IoT integration
- 3.9 Investment analysis and future outlook
Chapter 4 Competitive landscape, 2026
- 4.1 Introduction
- 4.2 Company market share analysis, by region, 2025
- 4.2.1 North America
- 4.2.2 Europe
- 4.2.3 Asia Pacific
- 4.2.4 Middle East & Africa
- 4.2.5 Latin America
- 4.3 Competitive analysis of major market players
- 4.4 Competitive positioning matrix
- 4.5 Key developments
- 4.5.1 Mergers & acquisitions
- 4.5.2 Partnerships & collaborations
- 4.5.3 New product launches
- 4.5.4 Expansion plans & funding
- 4.6 Company tier benchmarking
- 4.6.1 Tier classification criteria & qualifying thresholds
- 4.6.2 Tier positioning matrix by revenue, geography & innovation
Chapter 5 Market Size and Forecast, By Delivery Mode, 2022 – 2035 (USD Billion)
- 5.1 Key trends
- 5.2 Captive
- 5.3 Merchant
Chapter 6 Market Size and Forecast, By Process, 2022 – 2035 (USD Billion)
- 6.1 Key trends
- 6.2 Steam Reformer
- 6.3 Electrolysis
- 6.4 Others
Chapter 7 Market Size and Forecast, By Region, 2022 – 2035 (USD Billion)
- 7.1 Key trends
- 7.2 North America
- 7.2.1 U.S.
- 7.2.2 Canada
- 7.2.3 Mexico
- 7.3 Europe
- 7.3.1 Germany
- 7.3.2 Italy
- 7.3.3 Netherlands
- 7.3.4 Russia
- 7.4 Asia Pacific
- 7.4.1 China
- 7.4.2 India
- 7.4.3 Japan
- 7.5 Middle East & Africa
- 7.5.1 Saudi Arabia
- 7.5.2 Iran
- 7.5.3 UAE
- 7.5.4 South Africa
- 7.6 Latin America
- 7.6.1 Brazil
- 7.6.2 Argentina
- 7.6.3 Chile
Chapter 8 Company Profiles
- 8.1 AFC Energy plc
- 8.2 Air Liquide
- 8.3 Air Products and Chemicals
- 8.4 American Elements
- 8.5 China Baowu Steel Group
- 8.6 Enapter
- 8.7 GRZ Technologies
- 8.8 H Bank Technologies Inc.
- 8.9 Hazer Group
- 8.10 Heraeus Precious Metals
- 8.11 Hydrogenera
- 8.12 JSW Group
- 8.13 Linde
- 8.14 McPhy Energy S.A.
- 8.15 Messer Group
- 8.16 Nel Hydrogen
- 8.17 Plug Power
- 8.18 Reliance Industries
- 8.19 Shell
- 8.20 SSAB

 固體儲氫材料市場報告:趨勢、預測及競爭分析(至2035年)
 氫氣儲存市場預測至2034年-全球分析(按儲存方法、儲存技術、物理狀態、壓力範圍、系統容量、應用、終端用戶產業和地區分類)氫氣儲存系統市場預測至2034年-全球分析(按儲存技術、儲存材料、壓力等級、系統規模、應用、最終用戶、銷售管道和地區分類)緊湊型空氣壓縮系統市場預測至2034年-全球產品類型、動力源、壓力範圍、潤滑方式、技術、通路、應用及區域分析全球儲氫材料市場預測至2034年-按材料類型、儲存機制、形態、應用、最終用戶和地區分類的分析
 液氫儲罐市場 - 全球產業規模、佔有率、趨勢、機會、預測:按類型、應用、地區和競爭格局分類,2021-2031年
 地下儲氫市場規模、佔有率和成長分析:按儲存類型、終端用戶產業和地區分類-2026-2033年產業預測
 2026 年至 2035 年液氫運輸市場的商業機會、成長要素、產業趨勢與預測。氫載體市場預測至2034年-按載體類型、形態、來源、技術、應用、分銷、最終用戶和地區分類的全球分析
 全球小型空氣壓縮系統市場:按產品類型、壓力、最終用戶和地區分類-預測(至2030年)