

 |
市場調查報告書
商品編碼
2109212
高純度金屬矽及多晶矽市場商機、成長要素、產業趨勢分析及2026-2035年預測。High-Purity Silicon Metal and Polysilicon Market Opportunity, Growth Drivers, Industry Trend Analysis, and Forecast 2026 - 2035 |
||||||

全球超高純度金屬矽和多晶矽市場預計到 2025 年將達到 139 億美元,並以 13.2% 的複合年成長率成長,到 2035 年將達到 478 億美元。
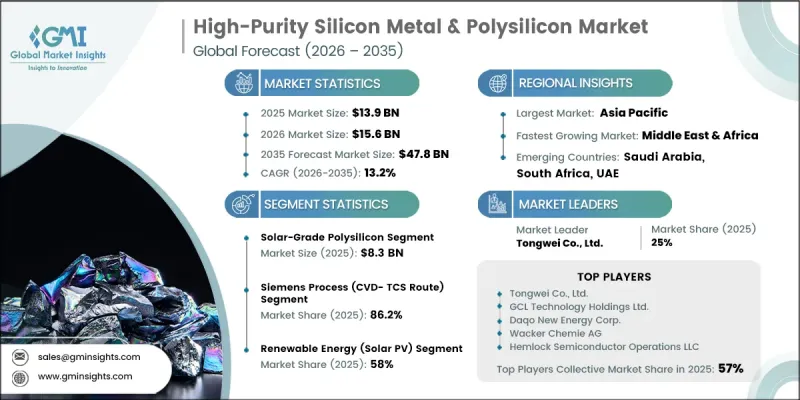
該產業正從以產能為中心的階段轉型,日益重視產品品質、技術進步和穩健的供應鏈。對高性能矽材料日益成長的需求,以及對先進製造技術的持續投入,正在推動多個終端應用產業的市場擴張。製造商優先生產符合嚴格品質標準的超高純度材料,同時提高製造效率和製程可靠性。加強本地產能、實現供應鏈多元化以及創新精煉技術,進一步鞏固了產業前景。此外,對下一代能源技術、半導體製造和先進電子應用領域的投資增加,也創造了有利的成長機會。
| 市場範圍 | |
|---|---|
| 開始年份 | 2025 |
| 預測期 | 2026-2035 |
| 上市時的市場規模 | 139億美元 |
| 預測金額 | 478億美元 |
| 複合年成長率 | 13.2% |
預計到2025年,太陽能級多晶矽市佔率將達到59.8%,並在2035年之前以12.3%的複合年成長率成長。太陽能級多晶矽是光伏製造的關鍵原料,支持高效能光伏技術的生產,從而保持其在該領域的領先地位。可再生能源基礎設施投資的增加、光伏製造流程的不斷進步以及對高品質矽材料日益成長的需求,正在推動該領域的成長。此外,製造商正致力於提高材料純度、生產效率和製造一致性,預計將進一步支撐全球市場對太陽能級多晶矽的長期需求。
預計到2025年,可再生能源(光伏)市場佔有率將達到58%。該領域持續受益於清潔能源基礎設施投資的增加、光伏系統部署的不斷擴大以及對可靠高性能矽材料需求的成長。太陽能電池效率的提高、先進光伏組件產能的擴大以及對永續發電需求的成長,進一步推動了市場擴張。此外,對能源轉型的日益重視、可再生能源發電能力的提升以及光伏製造領域的持續技術進步,預計將使該領域在整個預測期內保持主導地位。
預計到2025年,北美高純度金屬矽和多晶矽市佔率將達到9.2%。由於半導體製造領域投資增加、國內產能擴張以及在地化供應鏈的強化,該地區正成為日益重要的市場。對符合嚴格製造和監管標準的高品質矽材料的需求不斷成長,是推動該地區市場成長的主要動力。此外,對先進製造設施、技術創新和戰略供應鏈的持續投資,預計將在整個預測期內為製造商創造機遇,並鞏固北美在全球市場中的地位。
目錄
第1章:調查方法和範圍
第2章執行摘要
第3章 行業洞察
- 產業生態系分析
- 供應商情況
- 利潤率
- 每個階段增加的價值
- 影響價值鏈的因素
- 中斷
- 影響產業的因素
- 促進因素
- 產業潛在風險與挑戰
- 市場機遇
- 成長潛力分析
- 監理情勢
- 波特的分析
- PESTLE分析
- 價格趨勢
- 按地區
- 依原料類型
- 未來市場趨勢
- 技術與創新展望
- 最新科技趨勢
- 新興技術
- 專利趨勢
- 貿易統計
- 主要進口國
- 主要出口國
- 永續性和環境方面
- 永續計劃
- 減少廢棄物策略
- 生產中的能源效率
- 具有環保意識的舉措
- 考慮碳足跡
第4章 競爭情勢
- 介紹
- 企業市佔率分析
- 按地區
- 北美洲
- 歐洲
- 亞太地區
- LATAM
- 中東和非洲
- 按地區
- 主要市場公司的競爭分析
- 競爭定位矩陣
- 主要進展
- 併購
- 夥伴關係和聯盟
- 新產品發布
- 業務拓展計劃
第5章 市場估算與預測:依產品類型分類,2022-2035年
- 高純度金屬矽
- 4N(99.99%)級
- 5N(99.999%)級
- 用於太陽能電池的多晶矽
- 標準太陽能等級(6N)
- 優質太陽能等級(7N-9N)
- 電子級多晶矽
- 標準電子級(9N 至 10N)
- 適用於超高純度電子元件(11N 或更高)
第6章 市場估計與預測:依純度分類,2022-2035年
- 4N(99.99%)
- 5N(99.999%)
- 6N(99.9999%)
- 7N~9N(99.99999%~99.9999999%)
- 10N 至 11N 或更高(99.9999999999% 或更高)
第7章 市場估價與預測:依製造流程分類,2022-2035年
- 西門子方法(CVD-TCS 方法)
- 標準西門子方法
- 改良最佳化的西門子製程(節能型)
- 流體化床反應器(FBR)工藝
- 基於矽烷的FBR
- 基於TCS的FBR
- 升級冶金級(UMG)工藝
第8章 市場估計與預測:依應用領域分類,2022-2035年
- 太陽能發電(太陽能電池和組件)
- 單晶矽太陽能電池
- 多晶矽太陽能電池
- 薄膜和新興光伏發電(鈣鈦礦混合材料)
- 半導體裝置
- 積體電路(邏輯電路和記憶體)
- 微處理器和人工智慧加速器
- 離散半導體元件
- MEMS元件
- 電力電子
- 電動汽車逆變器和車載充電器
- 可再生能源逆變器和電網基礎設施
- 5G 通訊基礎設施和供電系統
- 矽酮和特殊化學品
- 工業和建築用矽膠
- 個人護理及醫藥矽酮
- 量子技術及先進研發;
- 用於量子計算的量子位元(由矽-28製成)
- 精密光學和紅外線成像
- 其他
- 生物相容性矽膠(醫療植入和診斷設備)
- 先進陶瓷和導熱界面材料
- 航太和國防零件
第9章 市場估計與預測:依最終用戶產業分類,2022-2035年
- 可再生能源(太陽能發電)
- 半導體和電子學
- 車
- 化學與材料
- 醫療保健和醫療設備
- 航太/國防
- 其他(通訊、工業自動化、量子研究)
第10章 市場估價與預測:依地區分類,2022-2035年
- 北美洲
- 美國
- 加拿大
- 歐洲
- 德國
- 英國
- 法國
- 西班牙
- 義大利
- 其他歐洲國家
- 亞太地區
- 中國
- 印度
- 日本
- 澳洲
- 韓國
- 其他亞太國家
- 拉丁美洲
- 巴西
- 墨西哥
- 阿根廷
- 其他拉丁美洲國家
- 中東和非洲
- 沙烏地阿拉伯
- 南非
- UAE
- 其他中東和非洲國家
第11章:公司簡介
- Tongwei Co., Ltd.
- GCL Technology Holdings Ltd.
- Daqo New Energy Corp.
- Wacker Chemie AG
- Hemlock Semiconductor Operations LLC
- Xinte Energy Co., Ltd.
- OCI Company Ltd.
- REC Silicon ASA
- Tokuyama Corporation
- Asia Silicon(Qinghai)Co., Ltd.
- TBEA Co., Ltd.
- High-Purity Silicon America Corp.(Mitsubishi Materials)
- Qatar Solar Technologies
- Xinjiang East Hope New Energy Co., Ltd.
- Shin-Etsu Chemical Co., Ltd.
- Siltronic AG
The Global High-Purity Silicon Metal & Polysilicon Market was valued at USD 13.9 billion in 2025 and is estimated to grow at a CAGR of 13.2% to reach USD 47.8 billion by 2035.
The industry is evolving beyond a phase centered primarily on production capacity and is increasingly emphasizing product quality, technological advancement, and resilient supply chains. Growing demand for high-performance silicon materials, coupled with continuous investments in advanced manufacturing technologies, is supporting market expansion across multiple end-use industries. Manufacturers are prioritizing the production of ultra-high-purity materials that meet stringent quality standards while improving manufacturing efficiency and process reliability. Increasing focus on localized production capabilities, supply chain diversification, and innovation in purification technologies is further strengthening the industry's outlook. In addition, expanding investments in next-generation energy technologies, semiconductor manufacturing, and advanced electronic applications are creating favorable growth opportunities.
| Market Scope | |
|---|---|
| Start Year | 2025 |
| Forecast Year | 2026-2035 |
| Start Value | $13.9 Billion |
| Forecast Value | $47.8 Billion |
| CAGR | 13.2% |
The solar-grade polysilicon segment held a 59.8% share in 2025 and is forecast to grow at a 12.3% CAGR through 2035. The segment continues to maintain its dominant position because solar-grade polysilicon serves as a critical raw material for photovoltaic manufacturing and supports the production of high-efficiency solar technologies. Increasing investments in renewable energy infrastructure, continuous advancements in photovoltaic manufacturing processes, and growing demand for high-quality silicon materials are strengthening segment growth. Manufacturers are also focusing on improving material purity, production efficiency, and manufacturing consistency, which is expected to further support long-term demand for solar-grade polysilicon across the global market.
The renewable energy (solar PV) segment recorded 58% share in 2025. The segment continues to benefit from increasing investments in clean energy infrastructure, rising deployment of photovoltaic systems, and the growing need for reliable, high-performance silicon materials. Continued improvements in solar cell efficiency, increasing production of advanced photovoltaic modules, and rising demand for sustainable electricity generation are further contributing to market expansion. In addition, the growing emphasis on energy transition, expanding renewable energy capacity, and ongoing technological advancements in solar manufacturing are expected to sustain the segment's leadership throughout the forecast period.
North America High-Purity Silicon Metal & polysilicon Market captured a 9.2% share in 2025. The region is becoming an increasingly important market due to rising investments in semiconductor manufacturing, expanding domestic production capabilities, and growing efforts to strengthen localized supply chains. Increasing demand for high-quality silicon materials that comply with stringent manufacturing and regulatory standards is supporting regional market growth. In addition, ongoing investments in advanced manufacturing facilities, technology innovation, and strategic supply chain development are expected to create favorable opportunities for manufacturers while reinforcing North America's position in the global market over the forecast period.
Major companies operating in the global high-purity silicon metal & polysilicon market include Tongwei Co., Ltd., GCL Technology Holdings Ltd., Daqo New Energy Corp., Wacker Chemie AG, Hemlock Semiconductor Operations LLC, Xinte Energy Co., Ltd., OCI Company Ltd., REC Silicon ASA, Tokuyama Corporation, Asia Silicon (Qinghai) Co., Ltd., TBEA Co., Ltd., High-Purity Silicon America Corp. (Mitsubishi Materials), Qatar Solar Technologies, Xinjiang East Hope New Energy Co., Ltd., Shin-Etsu Chemical Co., Ltd., and Siltronic AG. Companies operating in the global high-purity silicon metal & polysilicon market are reinforcing their competitive position by investing extensively in production capacity expansion, advanced purification technologies, and continuous product innovation. Leading manufacturers are prioritizing research and development to improve material purity, manufacturing efficiency, and process reliability while meeting increasingly demanding quality standards. Strategic partnerships, long-term supply agreements, and investments in localized manufacturing facilities are enabling companies to strengthen supply chain resilience and expand their global customer base. Businesses are also focusing on sustainability initiatives, energy-efficient production processes, and operational optimization to enhance competitiveness. Furthermore, companies are expanding their geographic presence, modernizing manufacturing facilities, increasing production capabilities, and developing premium-grade silicon materials to strengthen their market foothold, improve customer satisfaction, and capitalize on the growing demand across the global high-purity silicon metal & polysilicon market.
Table of Contents
Chapter 1 Methodology & Scope
- 1.1 Research approach
- 1.2 Quality Commitments
- 1.2.1 GMI AI policy & data integrity commitment
- 1.2.1.1 Source consistency protocol
- 1.2.1 GMI AI policy & data integrity commitment
- 1.3 Research Trail & Confidence Scoring
- 1.3.1 Research Trail Components
- 1.3.2 Scoring Components
- 1.4 Data Collection
- 1.4.1 Partial list of primary sources
- 1.5 Data mining sources
- 1.5.1 Paid sources
- 1.5.1.1 Sources, by region
- 1.5.1 Paid sources
- 1.6 Base estimates and calculations
- 1.6.1 Base year calculation for any one approach
- 1.7 Forecast model
- 1.7.1 Quantified market impact analysis
- 1.7.1.1 Mathematical impact of growth parameters on forecast
- 1.7.1 Quantified market impact analysis
- 1.8 Research transparency addendum
- 1.8.1 Source attribution framework
- 1.8.2 Quality assurance metrics
- 1.8.3 Our commitment to trust
Chapter 2 Executive Summary
- 2.1 Industry 360° synopsis
- 2.2 Key market trends
- 2.2.1 Regional
- 2.2.2 Product Type
- 2.2.3 Purity Grade
- 2.2.4 Manufacturing Process
- 2.2.5 Application
- 2.2.6 End-User Industry
Chapter 3 Industry Insights
- 3.1 Industry ecosystem analysis
- 3.1.1 Supplier landscape
- 3.1.2 Profit margin
- 3.1.3 Value addition at each stage
- 3.1.4 Factor affecting the value chain
- 3.1.5 Disruptions
- 3.2 Industry impact forces
- 3.2.1 Growth drivers
- 3.2.2 Industry pitfalls and challenges
- 3.2.3 Market opportunities
- 3.3 Growth potential analysis
- 3.4 Regulatory landscape
- 3.4.1 North America
- 3.4.2 Europe
- 3.4.3 Asia Pacific
- 3.4.4 Latin America
- 3.4.5 Middle East & Africa
- 3.5 Porter’s analysis
- 3.6 PESTEL analysis
- 3.7 Price trends
- 3.7.1 By region
- 3.7.2 By feedstock type
- 3.8 Future market trends
- 3.9 Technology and innovation landscape
- 3.9.1 Current technological trends
- 3.9.2 Emerging technologies
- 3.10 Patent Landscape
- 3.11 Trade statistics (HS code)
- 3.11.1 Major importing countries
- 3.11.2 Major exporting countries
- 3.12 Sustainability and environmental aspects
- 3.12.1 Sustainable practices
- 3.12.2 Waste reduction strategies
- 3.12.3 Energy efficiency in production
- 3.12.4 Eco-friendly initiatives
- 3.13 Carbon footprint consideration
Chapter 4 Competitive Landscape, 2025
- 4.1 Introduction
- 4.2 Company market share analysis
- 4.2.1 By region
- 4.2.1.1 North America
- 4.2.1.2 Europe
- 4.2.1.3 Asia Pacific
- 4.2.1.4 LATAM
- 4.2.1.5 MEA
- 4.2.1 By region
- 4.3 Competitive analysis of major market players
- 4.4 Competitive positioning matrix
- 4.5 Key developments
- 4.5.1 Mergers & acquisitions
- 4.5.2 Partnerships & collaborations
- 4.5.3 New Product Launches
- 4.5.4 Expansion Plans
Chapter 5 Market Estimates and Forecast, By Product Type, 2022–2035 (USD Billion) (Kilo Tons)
- 5.1 Key trends
- 5.2 High-Purity Silicon Metal
- 5.2.1 4N (99.99%) Grade
- 5.2.2 5N (99.999%) Grade
- 5.3 Solar-Grade Polysilicon
- 5.3.1 Standard Solar-Grade (6N)
- 5.3.2 Premium Solar-Grade (7N–9N)
- 5.4 Electronic-Grade Polysilicon
- 5.4.1 Standard Electronic-Grade (9N–10N)
- 5.4.2 Ultra-High-Purity Electronic-Grade (11N & Above)
Chapter 6 Market Estimates and Forecast, By Purity Grade, 2022–2035 (USD Billion) (Kilo Tons)
- 6.1 Key trends
- 6.2 4N (99.99%)
- 6.3 5N (99.999%)
- 6.4 6N (99.9999%)
- 6.5 7N–9N (99.99999%–99.9999999%)
- 6.6 10N–11N & Above (≥99.9999999999%)
Chapter 7 Market Estimates and Forecast, By Manufacturing Process, 2022–2035 (USD Billion) (Kilo Tons)
- 7.1 Key trends
- 7.2 Siemens Process (CVD- TCS Route)
- 7.2.1 Standard Siemens Process
- 7.2.2 Modified/Optimized Siemens Process (Energy-Reduced Variants)
- 7.3 Fluidized Bed Reactor (FBR) Process
- 7.3.1 Silane-Based FBR
- 7.3.2 TCS-Based FBR
- 7.4 Upgraded Metallurgical-Grade (UMG) Process
Chapter 8 Market Estimates and Forecast, By Application, 2022–2035 (USD Billion) (Kilo Tons)
- 8.1 Key trends
- 8.2 Photovoltaics (Solar Cells & Modules)
- 8.2.1 Monocrystalline Silicon Solar Cells
- 8.2.2 Multicrystalline Silicon Solar Cells
- 8.2.3 Thin-Film & Emerging PV (Perovskite Hybrid)
- 8.3 Semiconductor Devices
- 8.3.1 Integrated Circuits (Logic & Memory)
- 8.3.2 Microprocessors & AI Accelerators
- 8.3.3 Discrete Semiconductor Components
- 8.3.4 MEMS Devices
- 8.4 Power Electronics
- 8.4.1 Electric Vehicle Inverters & Onboard Chargers
- 8.4.2 Renewable Energy Inverters & Grid Infrastructure
- 8.4.3 5G Infrastructure & Telecom Power Systems
- 8.5 Silicones & Specialty Chemicals
- 8.5.1 Industrial & Construction Silicones
- 8.5.2 Personal Care & Pharmaceutical Silicones
- 8.6 Quantum Technologies & Advanced R&D
- 8.6.1 Quantum Computing Qubits (Silicon-28 Feedstock)
- 8.6.2 Precision Optics & Infrared Imaging
- 8.7 Others
- 8.7.1 Biocompatible Silicon (Medical Implants & Diagnostics)
- 8.7.2 Advanced Ceramics & Thermal Interface Materials
- 8.7.3 Aerospace & Defense Components
Chapter 9 Market Estimates and Forecast, By End-User Industry, 2022–2035 (USD Billion) (Kilo Tons)
- 9.1 Key trends
- 9.2 Renewable Energy (Solar PV)
- 9.3 Semiconductor & Electronics
- 9.4 Automotive
- 9.5 Chemicals & Materials
- 9.6 Healthcare & Medical Devices
- 9.7 Aerospace & Defense
- 9.8 Others (Telecom, Industrial Automation, Quantum Research)
Chapter 10 Market Estimates and Forecast, By Region, 2022–2035 (USD Billion) (Kilo Tons)
- 10.1 Key trends
- 10.2 North America
- 10.2.1 U.S.
- 10.2.2 Canada
- 10.3 Europe
- 10.3.1 Germany
- 10.3.2 UK
- 10.3.3 France
- 10.3.4 Spain
- 10.3.5 Italy
- 10.3.6 Rest of Europe
- 10.4 Asia Pacific
- 10.4.1 China
- 10.4.2 India
- 10.4.3 Japan
- 10.4.4 Australia
- 10.4.5 South Korea
- 10.4.6 Rest of Asia Pacific
- 10.5 Latin America
- 10.5.1 Brazil
- 10.5.2 Mexico
- 10.5.3 Argentina
- 10.5.4 Rest of Latin America
- 10.6 Middle East and Africa
- 10.6.1 Saudi Arabia
- 10.6.2 South Africa
- 10.6.3 UAE
- 10.6.4 Rest of Middle East and Africa
Chapter 11 Company Profiles
- 11.1 Tongwei Co., Ltd.
- 11.2 GCL Technology Holdings Ltd.
- 11.3 Daqo New Energy Corp.
- 11.4 Wacker Chemie AG
- 11.5 Hemlock Semiconductor Operations LLC
- 11.6 Xinte Energy Co., Ltd.
- 11.7 OCI Company Ltd.
- 11.8 REC Silicon ASA
- 11.9 Tokuyama Corporation
- 11.10 Asia Silicon (Qinghai) Co., Ltd.
- 11.11 TBEA Co., Ltd.
- 11.12 High-Purity Silicon America Corp. (Mitsubishi Materials)
- 11.13 Qatar Solar Technologies
- 11.14 Xinjiang East Hope New Energy Co., Ltd.
- 11.15 Shin-Etsu Chemical Co., Ltd.
- 11.16 Siltronic AG

 矽晶圓市場規模、市場佔有率、成長率、全球產業分析、區域趨勢以及 2026 年至 2034 年的預測。
 半導體矽晶圓市場報告:趨勢、預測與競爭分析(至2035年)
 矽晶圓市場:預測至 2034 年 - 全球分析(按晶圓直徑、晶圓類型、製造流程、摻雜類型、應用、終端用戶產業、等級、銷售管道和地區分類)半導體矽晶圓市場預測至2034年-按類型、產品、晶圓尺寸、晶體生長方法、摻雜類型、應用、終端用戶產業和地區分類的全球分析
 矽晶圓市場-全球產業規模、佔有率、趨勢、機會和預測:按晶圓尺寸、類型、應用、最終用戶、地區和競爭格局分類,2021-2031年
 300mm矽晶圓:市場佔有率分析、產業趨勢與統計、成長預測(2026-2031年)北美半導體矽晶圓:市場佔有率分析、產業趨勢與統計及成長預測(2026-2031 年)美國半導體矽晶圓:市場佔有率分析、行業趨勢和統計數據以及成長預測(2026-2031 年)
 矽晶圓市場規模、佔有率、趨勢和預測:按晶圓尺寸、類型、應用、最終用途和地區分類,2026-2034 年
 半導體矽晶圓回收市場:依回收製程、晶圓類型、晶圓尺寸、應用領域、產業及最終用戶分類-2026-2032年全球市場預測