


 |
市場調查報告書
商品編碼
2109206
作物缺水緩解劑及噴劑的市場機會、成長促進因素、產業趨勢分析及2026-2035年預測Anti-Transpirant and Crop Water-Stress Mitigation Sprays Market Opportunity, Growth Drivers, Industry Trend Analysis, and Forecast 2026 - 2035 |
||||||

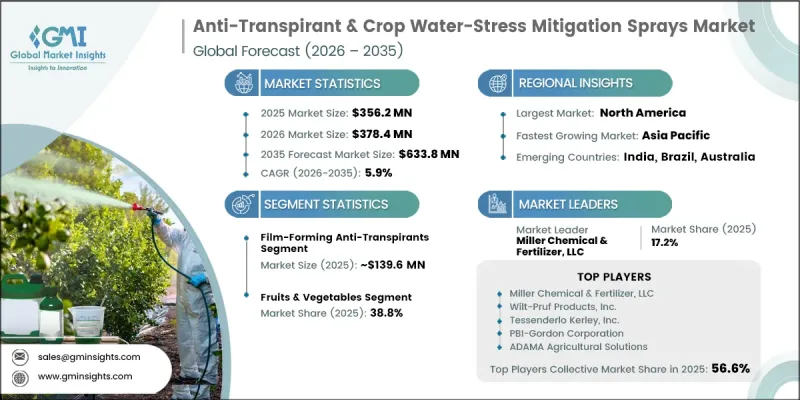
全球蒸騰抑制劑和作物缺水緩解噴劑市場預計到 2025 年將達到 3.562 億美元,年複合成長率為 5.9%,到 2035 年將達到 6.338 億美元。
隨著農業生產者擴大採用能夠幫助作物抵禦缺水和環境脅迫並保持生產力的解決方案,用於緩解作物缺水的蒸騰控制劑和噴劑市場正在不斷擴大。人們對長期乾旱和氣溫上升的日益關注,推動了蒸騰控制產品在現代作物管理策略中的應用,尤其是在高價值農業生產領域。此外,隨著對永續農業材料的需求持續成長,市場正加速向生物來源和植物來源轉型。這一趨勢正在加速創新產品配方的開發,並擴大氣候敏感型農業地區的商機。此外,將抗蒸騰技術與精密農業實踐相結合,透過數據驅動的作物管理和最佳化的噴灑技術,提高了噴灑效率。該行業也從傳統的石油化學配方轉向生物技術替代品。雖然對環保型農產品法規的日益重視推動了創新,但人們對再生和永續。
| 市場範圍 | |
|---|---|
| 開始年份 | 2025 |
| 預測期 | 2026-2035 |
| 初始市場規模 | 3.562億美元 |
| 預計金額 | 6.338億美元 |
| 複合年成長率 | 5.9% |
預計到2025年,成膜型蒸散抑制劑將佔據39.2%的市場佔有率,銷售額達1.396億美元。該細分市場之所以能保持主導地位,是因為其已被證實能夠最大限度地減少葉面水分流失,與現有噴灑設備兼容,並被種植戶廣泛接受。這些產品被廣泛用於增強作物抗逆性,並在惡劣環境條件下維持作物整體品質。此外,反射型和顆粒型成膜蒸散抑制劑也逐漸佔據市場佔有率,因為它們能夠反射太陽輻射,從而降低冠層溫度,預計該細分市場未來將實現強勁成長。
預計到2025年,蔬果市場將佔據38.8%的市場。該領域持續保持主導地位,因為缺水會對作物的品質、外觀和整體產量產生顯著影響。生產者正加大對葉面噴施解決方案的投資,以確保產量並在整個生長季節保持產品品質。園藝生產中對蒸散作用控制技術的日益重視,也推動了這些技術在果蔬種植的廣泛應用。
2025年,北美地區作物蒸騰控制和缺水緩解噴劑的市佔率將達到32.2%。這一區域成長主要得益於蒸騰控制產品的廣泛應用、完善的農業價值鏈以及種植者日益增強的水資源管理意識。美國憑藉先進的作物保護技術的廣泛應用以及高價值農業生產中水分脅迫管理解決方案的日益普及,並繼續引領區域市場。
目錄
第1章:調查方法和範圍
第2章執行摘要
第3章 行業洞察
- 產業生態系分析
- 供應商情況
- 利潤率
- 每個階段增加的價值
- 影響價值鏈的因素
- 中斷
- 影響產業的因素
- 促進因素
- 產業潛在風險與挑戰
- 市場機遇
- 成長潛力分析
- 監理情勢
- 波特的分析
- PESTLE分析
- 價格趨勢
- 按地區
- 按作物類型
- 未來市場趨勢
- 技術與創新展望
- 最新科技趨勢
- 新興技術
- 專利趨勢
- 貿易統計
- 主要進口國
- 主要出口國
- 永續性和環境方面
- 永續計劃
- 減少廢棄物策略
- 生產中的能源效率
- 具有環保意識的舉措
- 考慮碳足跡
第4章 競爭情勢
- 介紹
- 企業市佔率分析
- 按地區
- 北美洲
- 歐洲
- 亞太地區
- 拉丁美洲
- 中東和非洲
- 按地區
- 主要市場公司的競爭分析
- 競爭定位矩陣
- 主要進展
- 併購
- 夥伴關係和聯盟
- 新產品發布
- 業務拓展計劃
第5章 市場估算與預測:依產品類型分類,2022-2035年
- 成膜蒸發抑制劑
- 聚合物基(合成)
- 蠟基和乳膠基
- 松油烯/多萜烯(di-1-p-mentene)
- 反射/顆粒薄膜型吸濕劑
- 高嶺土基
- 碳酸鈣(CaCO3)和氧化鈣
- 氣孔關閉/代謝抑制劑
- 脫落酸(ABA)
- 幾丁聚醣基
- 富裡酸和富裡酸體系
- 矽酸鉀
- 其他
第6章 市場估算與預測:依作物類型分類,2022-2035年
- 水果和蔬菜
- 柑橘
- 葡萄和漿果
- 番茄和甜瓜
- 綠葉蔬菜和十字花科蔬菜
- 核果類水果(桃子、櫻桃、李子)
- 穀類和穀類食品
- 小麥
- 米
- 玉米
- 大麥和高粱
- 油籽/豆類
- 大豆
- 菜籽
- 向日葵
- 花生和扁豆
- 草坪和觀賞植物
- 高爾夫球場和運動草坪
- 幼苗和切花
- 景觀花園和市政綠地
- 其他
第7章 市場估計與預測:依最終用戶分類,2022-2035年
- 商業作物種植戶
- 園藝和溫室種植者
- 草坪護理業務
- 苗圃和園林綠化公司
- 研究機構
第8章 市場估計與預測:依地區分類,2022-2035年
- 北美洲
- 美國
- 加拿大
- 歐洲
- 德國
- 英國
- 法國
- 西班牙
- 義大利
- 其他歐洲國家
- 亞太地區
- 中國
- 印度
- 日本
- 澳洲
- 韓國
- 其他亞太國家
- 拉丁美洲
- 巴西
- 墨西哥
- 阿根廷
- 其他拉丁美洲國家
- 中東和非洲
- 沙烏地阿拉伯
- 南非
- UAE
- 其他中東和非洲國家
第9章:公司簡介
- ADAMA Agricultural Solutions
- Agreenco Bio Tech Co., Ltd.
- AgroBest Australia Pty. Ltd.
- Ajay Biotech(I)Ltd.
- Bio-Plex
- Bonide Products LLC
- Coastal AgroBusiness
- ConserveAwater
- Coromandel International
- Indogulf BioAg LLC
- KaMin LLC
- Kaoleni
- Miller Chemical & Fertilizer, LLC
- PBI-Gordon Corporation
- Seipasa
- Serbios Srl(Greenexta Group)
- Tessenderlo Kerley, Inc.
- Wilt-Pruf Products, Inc.
- Yates
The Global Anti-Transpirant & Crop Water-Stress Mitigation Sprays Market was valued at USD 356.2 million in 2025 and is estimated to grow at a CAGR of 5.9% to reach USD 633.8 million by 2035.
The anti-transpirant & crop water-stress mitigation sprays market is expanding as agricultural producers increasingly adopt solutions that help crops withstand water scarcity and environmental stress while maintaining productivity. Growing concerns over prolonged drought conditions and rising temperatures are encouraging the wider use of anti-transpirant products as part of modern crop management strategies, particularly for high-value agricultural production. The market is also witnessing a gradual transition toward biological and plant-derived formulations as demand for sustainable farming inputs continues to increase. This trend is encouraging manufacturers to develop innovative product formulations while expanding opportunities across climate-sensitive agricultural regions. Furthermore, the integration of anti-transpirant technologies with precision agriculture practices is improving application efficiency through data-driven crop management and optimized spraying techniques. The industry is also moving away from conventional petrochemical-based formulations in favor of biotechnology-driven alternatives. Increasing regulatory emphasis on environmentally responsible agricultural products is encouraging innovation, while sustainable formulations continue to gain premium market acceptance due to growing interest in regenerative and environmentally conscious farming practices.
| Market Scope | |
|---|---|
| Start Year | 2025 |
| Forecast Year | 2026-2035 |
| Start Value | $356.2 Million |
| Forecast Value | $633.8 Million |
| CAGR | 5.9% |
The film-forming anti-transpirants segment accounted for 39.2% share generating USD 139.6 million in 2025. This segment maintains its leadership due to its proven ability to minimize foliar water loss, compatibility with existing spraying equipment, and widespread acceptance among growers. These products are extensively utilized to improve crop resilience under challenging environmental conditions while supporting overall crop quality. In addition, reflectant and particle film anti-transpirants continue to gain market traction because they help lower canopy temperatures by reflecting solar radiation, positioning the segment for strong future growth.
The fruits & vegetables segment captured 38.8% share in 2025. This segment continues to dominate because water stress can significantly affect crop quality, appearance, and overall productivity. Producers are increasingly investing in foliar treatment solutions that help preserve yield and maintain product quality throughout the growing season. Growing recognition of anti-transpirant technologies within horticultural production continues to support wider adoption across fruit and vegetable cultivation.
North America Anti-Transpirant & Crop Water-Stress Mitigation Sprays Market accounted for 32.2% share in 2025. Regional growth is supported by the widespread adoption of anti-transpirant products, well-developed agricultural supply chains, and increasing awareness of water management practices among growers. The United States continues to lead the regional market due to the broad use of advanced crop protection technologies and growing adoption of water-stress management solutions for high-value agricultural production.
Major companies operating in the global anti-transpirant & crop water-stress mitigation sprays market include Miller Chemical & Fertilizer, LLC, Wilt-Pruf Products, Inc., PBI-Gordon Corporation, AgroBest Australia Pty. Ltd., Bonide Products LLC, Tessenderlo Kerley, Inc., ADAMA Agricultural Solutions, Yates, Coastal AgroBusiness, Bio-Plex, Indogulf BioAg LLC, Ajay Biotech (I) Ltd., ConserveAwater, Coromandel International, Agreenco Bio Tech Co., Ltd., Kaoleni, Seipasa, KaMin LLC, and Serbios S.r.l. (Greenexta Group). Companies operating in the anti-transpirant & crop water-stress mitigation sprays market are strengthening their market position by investing in research and development to introduce advanced, sustainable, and high-performance formulations. Many manufacturers are focusing on biological and plant-based product innovation to address increasing demand for environmentally responsible agricultural solutions. Strategic collaborations with agricultural distributors, research organizations, and farming communities are helping expand product reach and improve customer adoption. Businesses are also increasing production capacity, enhancing formulation efficiency, and integrating their products with precision agriculture technologies to improve application effectiveness.
Table of Contents
Chapter 1 Methodology & Scope
- 1.1 Research approach
- 1.2 Quality Commitments
- 1.2.1 GMI AI policy & data integrity commitment
- 1.2.1.1 Source consistency protocol
- 1.2.1 GMI AI policy & data integrity commitment
- 1.3 Research Trail & Confidence Scoring
- 1.3.1 Research Trail Components
- 1.3.2 Scoring Components
- 1.4 Data Collection
- 1.4.1 Partial list of primary sources
- 1.5 Data mining sources
- 1.5.1 Paid sources
- 1.5.1.1 Sources, by region
- 1.5.1 Paid sources
- 1.6 Base estimates and calculations
- 1.6.1 Base year calculation for any one approach
- 1.7 Forecast model
- 1.7.1 Quantified market impact analysis
- 1.7.1.1 Mathematical impact of growth parameters on forecast
- 1.7.1 Quantified market impact analysis
- 1.8 Research transparency addendum
- 1.8.1 Source attribution framework
- 1.8.2 Quality assurance metrics
- 1.8.3 Our commitment to trust
Chapter 2 Executive Summary
- 2.1 Industry 360° synopsis
- 2.2 Key market trends
- 2.2.1 Regional
- 2.2.2 Product type
- 2.2.3 Crop type
- 2.2.4 End user
Chapter 3 Industry Insights
- 3.1 Industry ecosystem analysis
- 3.1.1 Supplier landscape
- 3.1.2 Profit margin
- 3.1.3 Value addition at each stage
- 3.1.4 Factor affecting the value chain
- 3.1.5 Disruptions
- 3.2 Industry impact forces
- 3.2.1 Growth drivers
- 3.2.2 Industry pitfalls and challenges
- 3.2.3 Market opportunities
- 3.3 Growth potential analysis
- 3.4 Regulatory landscape
- 3.4.1 North America
- 3.4.2 Europe
- 3.4.3 Asia Pacific
- 3.4.4 Latin America
- 3.4.5 Middle East & Africa
- 3.5 Porter’s analysis
- 3.6 PESTEL analysis
- 3.7 Price trends
- 3.7.1 By region
- 3.7.2 By crop type
- 3.8 Future market trends
- 3.9 Technology and innovation landscape
- 3.9.1 Current technological trends
- 3.9.2 Emerging technologies
- 3.10 Patent Landscape
- 3.11 Trade statistics (HS code)
- 3.11.1 Major importing countries
- 3.11.2 Major exporting countries
- 3.12 Sustainability and environmental aspects
- 3.12.1 Sustainable practices
- 3.12.2 Waste reduction strategies
- 3.12.3 Energy efficiency in production
- 3.12.4 Eco-friendly initiatives
- 3.13 Carbon footprint consideration
Chapter 4 Competitive Landscape, 2025
- 4.1 Introduction
- 4.2 Company market share analysis
- 4.2.1 By region
- 4.2.1.1 North America
- 4.2.1.2 Europe
- 4.2.1.3 Asia Pacific
- 4.2.1.4 LATAM
- 4.2.1.5 MEA
- 4.2.1 By region
- 4.3 Competitive analysis of major market players
- 4.4 Competitive positioning matrix
- 4.5 Key developments
- 4.5.1 Mergers & acquisitions
- 4.5.2 Partnerships & collaborations
- 4.5.3 New Product Launches
- 4.5.4 Expansion Plans
Chapter 5 Market Estimates and Forecast, By Product Type, 2022–2035 (USD Million) (Kilo Tons)
- 5.1 Key trends
- 5.2 Film-Forming Anti-Transpirants
- 5.2.1 Polymer-Based (Synthetic)
- 5.2.2 Wax & Latex-Based
- 5.2.3 Pinolene / Polyterpene-Based (Di-1-p-Menthene)
- 5.3 Reflectant / Particle Film Anti-Transpirants
- 5.3.1 Kaolin Clay-Based
- 5.3.2 Calcium Carbonate (CaCO₃) & Calcium Oxide-Based
- 5.4 Stomatal Closure / Metabolic Inhibitor Agents
- 5.4.1 Abscisic Acid (ABA)-Based
- 5.4.2 Chitosan-Based
- 5.4.3 Fulvic Acid & Potassium Fulvate-Based
- 5.4.4 Potassium Silicate-Based
- 5.5 Others
Chapter 6 Market Estimates and Forecast, By Crop Type, 2022–2035 (USD Million) (Kilo Tons)
- 6.1 Key trends
- 6.2 Fruits & Vegetables
- 6.2.1 Citrus Fruits
- 6.2.2 Grapes & Berries
- 6.2.3 Tomatoes & Cucurbits
- 6.2.4 Leafy Greens & Brassicas
- 6.2.5 Stone Fruits (Peach, Cherry, Plum)
- 6.3 Cereals & Grains
- 6.3.1 Wheat
- 6.3.2 Rice
- 6.3.3 Maize / Corn
- 6.3.4 Barley & Sorghum
- 6.4 Oilseeds & Pulses
- 6.4.1 Soybean
- 6.4.2 Canola / Rapeseed
- 6.4.3 Sunflower
- 6.4.4 Groundnut & Lentils
- 6.5 Turf & Ornamentals
- 6.5.1 Golf Courses & Sports Turf
- 6.5.2 Nursery & Cut Flowers
- 6.5.3 Landscaping & Municipal Green Spaces
- 6.6 Others
Chapter 7 Market Estimates and Forecast, By End-User, 2022–2035 (USD Million) (Kilo Tons)
- 7.1 Key trends
- 7.2 Commercial Crop Farmers
- 7.3 Horticulture & Greenhouse Growers
- 7.4 Turf Management Operators
- 7.5 Nurseries & Landscaping Professionals
- 7.6 Research Institutions
Chapter 8 Market Estimates and Forecast, By Region, 2022–2035 (USD Million) (Kilo Tons)
- 8.1 Key trends
- 8.2 North America
- 8.2.1 U.S.
- 8.2.2 Canada
- 8.3 Europe
- 8.3.1 Germany
- 8.3.2 UK
- 8.3.3 France
- 8.3.4 Spain
- 8.3.5 Italy
- 8.3.6 Rest of Europe
- 8.4 Asia Pacific
- 8.4.1 China
- 8.4.2 India
- 8.4.3 Japan
- 8.4.4 Australia
- 8.4.5 South Korea
- 8.4.6 Rest of Asia Pacific
- 8.5 Latin America
- 8.5.1 Brazil
- 8.5.2 Mexico
- 8.5.3 Argentina
- 8.5.4 Rest of Latin America
- 8.6 Middle East and Africa
- 8.6.1 Saudi Arabia
- 8.6.2 South Africa
- 8.6.3 UAE
- 8.6.4 Rest of Middle East and Africa
Chapter 9 Company Profiles
- 9.1 ADAMA Agricultural Solutions
- 9.2 Agreenco Bio Tech Co., Ltd.
- 9.3 AgroBest Australia Pty. Ltd.
- 9.4 Ajay Biotech (I) Ltd.
- 9.5 Bio-Plex
- 9.6 Bonide Products LLC
- 9.7 Coastal AgroBusiness
- 9.8 ConserveAwater
- 9.9 Coromandel International
- 9.10 Indogulf BioAg LLC
- 9.11 KaMin LLC
- 9.12 Kaoleni
- 9.13 Miller Chemical & Fertilizer, LLC
- 9.14 PBI-Gordon Corporation
- 9.15 Seipasa
- 9.16 Serbios S.r.l. (Greenexta Group)
- 9.17 Tessenderlo Kerley, Inc.
- 9.18 Wilt-Pruf Products, Inc.
- 9.19 Yates

 農業化學品市場報告:趨勢、預測和競爭分析(至2035年)
 農藥儲槽市場:全球市場預測,2026-2032年
 馬來西亞農藥市場:市場佔有率分析、產業趨勢與統計及成長預測(2026-2031)
 農業化學品儲罐市場規模、佔有率和成長分析:按類型、應用、容量和地區分類 - 2026-2033 年行業預測
 Miravis Neo 殺菌劑 2026 年全球市場報告Miravistop 殺菌劑 2026 年全球市場報告
 2026 年至 2035 年專利到期和非專利農藥市場的商業機會、成長要素、產業趨勢和預測。農業化學品市場:按產品類型、性質、作物類型、製劑形式和應用分類-全球預測,2026-2032年Glyphosate原藥:市場機會、成長促進因素、產業趨勢分析及2026-2035年預測
 工業化學品市場預測至2034年-按產品類型、形態、製造流程、最終用戶、通路和地區分類的全球分析