


 |
市場調查報告書
商品編碼
2109197
風力發電機塔架市場機會、成長促進因素、產業趨勢分析及2026-2035年預測Wind Turbine Tower Market Opportunity, Growth Drivers, Industry Trend Analysis, and Forecast 2026 - 2035 |
||||||

全球風力發電機塔架市場預計到 2025 年將達到 279 億美元,年複合成長率為 8.5%,到 2035 年將達到 635 億美元。
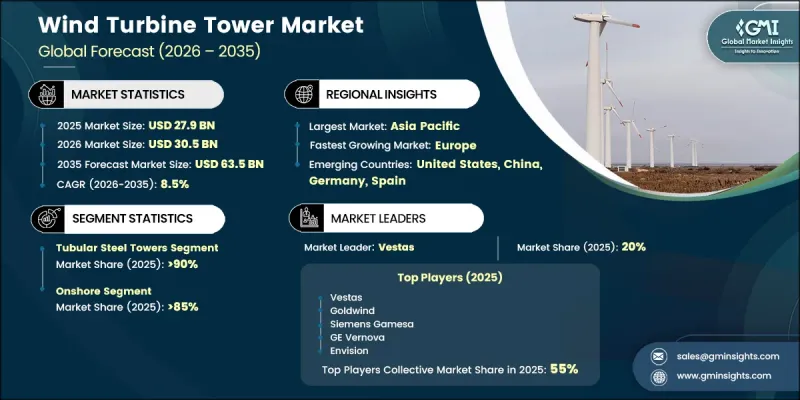
受各國可再生能源目標和全球脫碳努力的推動,風電產業前景依然光明,風電裝置容量正大幅成長。目前市場正呈現兩大需求趨勢:一是現有陸上專案對經濟高效、標準化的塔筒解決方案的需求,二是離岸風力發電和輪轂高度較高的應用領域對先進工程設計的需求。尤其值得注意的是塔筒高度的提升,包括120公尺至160公尺以上的設計。這是因為更高的塔筒高度能夠帶來更高的風速,從而提高發電量,尤其是在風速較低的地區。根據國際再生能源署(IRENA)的數據,在風速較低的地區,將輪轂高度從80米提高到120米,可使容量利用率提高5%至12個百分點,從而提高發電效率並降低平準化電力成本。
| 市場範圍 | |
|---|---|
| 開始年份 | 2025 |
| 預測期 | 2026-2035 |
| 初始市場規模 | 279億美元 |
| 預測金額 | 635億美元 |
| 複合年成長率 | 8.5% |
鋼管塔筒在風力發電機塔架市場中持續佔據主導地位,佔分類塔筒市場規模的90%以上。其強大的市場地位得益於成熟的製造流程、可靠的結構鋼供應網路以及在長期運作應力條件下設計圓柱形塔筒的豐富經驗。由於鋼管塔筒性能卓越、擴充性且與最新的風機系統相容,主要風力發電機製造商繼續大量採用鋼管塔筒解決方案。
到2025年,陸域風發電工程項目將佔85%的市場佔有率。根據全球風能理事會(GWEC)的數據,截至2024年底,陸上風電將佔全球風電總裝置容量的93%以上,凸顯了該領域先進的基礎設施和經濟高效的製造生態系統。在陸域風電領域,輪轂高度的不斷提升仍然是影響塔架市場價值成長的關鍵因素。多個新興市場和成熟市場的風發電工程正在採用更高的塔架結構,包括120-140公尺的設計,這增加了對塔架材料的需求,並為製造商創造了新的商機。
預計到2025年,北美風力發電機塔架市場將佔相當大的佔有率。這主要得益於美國強勁的可再生能源投資,美國是全球裝置容量最大的風電市場之一。為了滿足對國產零件日益成長的需求,CS Wind位於科羅拉多溫莎的工廠(年產約500-600座塔筒)已擴大生產規模,以支持與國內採購獎勵相關的需求。該工廠向包括NextEra Energy和伯克希爾哈撒韋能源公司在內的領先風電開發商供應產品。
目錄
第1章:調查方法和範圍
第2章執行摘要
第3章 行業洞察
- 產業生態系統
- 監理情勢
- 影響產業的因素
- 促進因素
- 產業潛在風險與挑戰
- 成長潛力分析
- 技術與創新展望
- 價格趨勢分析
- 以塔型分析過去的價格趨勢
- 定價策略:按業務類型分類
- 波特的分析
- PESTLE分析
- 新機會與趨勢
- 數位化和物聯網整合
- 投資分析及未來展望
第4章 競爭情勢
- 介紹
- 企業市佔率分析:按地區分類
- 北美洲
- 歐洲
- 亞太地區
- 中東和非洲
- 拉丁美洲
- 主要市場公司的競爭分析
- 競爭定位矩陣
- 主要進展
- 併購
- 夥伴關係和聯盟
- 新產品發布
- 業務拓展計劃及資金籌措
- 按公司規模進行基準測試
- 排名分類標準與遴選標準
- 按銷售額、地區和創新能力分類的層級定位矩陣。
第5章 市場規模及預測:依塔型分類,2022-2035年
- 鋼管
- 具體的
- 混合式(鋼筋混凝土)
- 格子
- 其他
第6章 市場規模及預測:依部署方式分類,2022-2035年
- 陸上
- 離岸
第7章 市場規模及預測:依塔高分類,2022-2035年
- 80米或更短
- 81~120 m
- 121~160 m
- 超過160米
第8章 市場規模及預測:依最終用途分類,2022-2035年
- 住宅
- 商業
- 公用事業
第9章 市場規模及預測:依地區分類,2022-2035年
- 北美洲
- 美國
- 加拿大
- 墨西哥
- 歐洲
- 德國
- 西班牙
- 英國
- 法國
- 義大利
- 瑞典
- 亞太地區
- 中國
- 日本
- 韓國
- 印度
- 澳洲
- 中東和非洲
- 南非
- 埃及
- 拉丁美洲
- 巴西
- 智利
- 阿根廷
第10章:公司簡介
- Anyang Machinery
- Arcosa Wind Towers
- Bergey Windpower
- Broadwind
- CS Wind Corporation
- Cubuilt Engineers
- Dongkuk
- Enel Green Power
- ENERCON
- Faccin
- GE Vernova
- GRI Renewable Industries
- Hitachi
- KGW Schweriner Maschinen-und Anlagenbau GmbH
- Nordex
- Qingdao Aeolos Wind Power
- ReGen Powertech Private Limited
- Siemens Gamesa Renewable Energy
- Vestas Wind Systems
- XEMC Windpower
The Global Wind Turbine Tower Market was valued at USD 27.9 billion in 2025 and is estimated to grow at a CAGR of 8.5% to reach USD 63.5 billion by 2035.
The industry outlook remains positive as national renewable energy goals and global decarbonization commitments encourage significant growth in wind power installations. The market is experiencing a shift toward two major demand trends: cost-efficient standardized tower solutions for established onshore projects and advanced engineering designs for offshore wind farms and taller hub-height applications. Increasing tower heights, particularly designs ranging from 120-160 meters and beyond, are gaining attention as higher elevations provide improved wind speeds and greater energy output, especially in regions with lower wind availability. IRENA data shows that raising hub height from 80 meters to 120 meters can increase capacity factors by 5-12 percentage points in low-wind-speed locations, contributing to better energy generation efficiency and lower levelized cost of energy.
| Market Scope | |
|---|---|
| Start Year | 2025 |
| Forecast Year | 2026-2035 |
| Start Value | $27.9 Billion |
| Forecast Value | $63.5 Billion |
| CAGR | 8.5% |
Tubular steel towers continue to dominate the wind turbine tower market, representing more than 90% of the classified tower segment by value. This strong market position is supported by established manufacturing processes, reliable structural steel supply networks, and extensive experience with cylindrical tower designs under long-term operational stress conditions. Leading wind turbine manufacturers continue to rely heavily on tubular steel tower solutions because of their proven performance, scalability, and compatibility with modern turbine systems.
The onshore wind projects segment held 85% share in 2025. GWEC data indicates that onshore wind accounted for more than 93% of total cumulative global wind capacity at the end of 2024, highlighting the segment's advanced infrastructure base and cost-efficient manufacturing ecosystem. Within the onshore category, increasing hub heights remain a key factor influencing tower value growth. Wind projects in several developing and established markets are adopting taller tower structures, including 120-140 meter designs, which are increasing tower material requirements and creating additional revenue opportunities for manufacturers.
North America Wind Turbine Tower Market generated a significant share in 2025, supported by strong renewable energy investment activity in the United States, which ranks among the largest wind power markets globally by installed capacity. In response to increasing demand for domestically manufactured components, CS Wind's facility in Windsor, Colorado, which produces approximately 500-600 tower sets annually, has expanded its operations to support demand linked to domestic content incentives. The facility supplies major wind energy developers, including NextEra Energy and Berkshire Hathaway Energy.
Key companies operating in the wind turbine tower market include Goldwind, Vestas, CS Wind, Siemens Gamesa, Windar Renovables, GE Vernova, Envision, Enercon, and Nordex. Companies in the wind turbine tower market are adopting strategies such as expanding manufacturing facilities, increasing production capabilities, and establishing regional supply networks to serve growing wind energy demand. Market leaders are investing in lightweight materials, advanced fabrication technologies, and automated manufacturing processes to improve efficiency and reduce production costs. Strategic collaborations with turbine manufacturers and project developers help companies secure long-term contracts and strengthen customer relationships. Businesses are also focusing on developing taller tower solutions, improving logistics capabilities, and enhancing operational sustainability. Expansion into emerging wind markets, adoption of digital technologies, and continuous investment in research and development remain key approaches used by companies to strengthen their market presence and maintain a competitive advantage.
Table of Contents
Chapter 1 Methodology & Scope
- 1.1 Research design
- 1.2 Quality commitment
- 1.2.1 GMI AI policy & data integrity commitment
- 1.2.1.1 Source consistency protocol
- 1.2.1 GMI AI policy & data integrity commitment
- 1.3 Research Trail & Confidence Scoring
- 1.3.1 Research trail components
- 1.3.2 Scoring components
- 1.4 Data Collection
- 1.4.1 Partial list of primary sources
- 1.5 Data mining sources
- 1.5.1 Paid sources
- 1.5.1.1 Sources, by region
- 1.5.1 Paid sources
- 1.6 Base estimates and calculations
- 1.6.1 Base year calculation for any one approach
- 1.7 Forecast model
- 1.8 Research transparency addendum
- 1.8.1 Source attribution framework
- 1.8.2 Quality assurance metrics
- 1.8.3 Our commitment to trust
- 1.9 Market definitions
Chapter 2 Executive Summary
- 2.1 Industry 360-degree synopsis, 2022 – 2035
- 2.2 Business trends
- 2.3 Tower type trends
- 2.4 Deployment trends
- 2.5 Tower height trends
- 2.6 End use trends
- 2.7 Regional trends
Chapter 3 Industry Insights
- 3.1 Industry ecosystem
- 3.2 Regulatory landscape
- 3.3 Industry impact forces
- 3.3.1 Growth drivers
- 3.3.2 Industry pitfalls & challenges
- 3.4 Growth potential analysis
- 3.5 Technology & Innovation Landscape
- 3.6 Price trend analysis
- 3.6.1 Historic price trend analysis by tower type
- 3.6.2 Pricing strategy by player type
- 3.7 Porter's analysis
- 3.7.1 Bargaining power of suppliers
- 3.7.2 Bargaining power of buyers
- 3.7.3 Threat of new entrants
- 3.7.4 Threat of substitutes
- 3.8 PESTEL analysis
- 3.8.1 Political factors
- 3.8.2 Economic factors
- 3.8.3 Social factors
- 3.8.4 Technological factors
- 3.8.5 Legal factors
- 3.8.6 Environmental factors
- 3.9 Emerging opportunities & trends
- 3.10 Digitalization & IoT integration
- 3.11 Investment analysis and future outlook
Chapter 4 Competitive landscape, 2026
- 4.1 Introduction
- 4.2 Company market share analysis, by region, 2025
- 4.2.1 North America
- 4.2.2 Europe
- 4.2.3 Asia Pacific
- 4.2.4 Middle East & Africa
- 4.2.5 Latin America
- 4.3 Competitive analysis of major market players
- 4.4 Competitive positioning matrix
- 4.5 Key developments
- 4.5.1 Mergers & acquisitions
- 4.5.2 Partnerships & collaborations
- 4.5.3 New product launches
- 4.5.4 Expansion plans & funding
- 4.6 Company tier benchmarking
- 4.6.1 Tier classification criteria & qualifying thresholds
- 4.6.2 Tier positioning matrix by revenue, geography & innovation
Chapter 5 Market Size and Forecast, By Tower Type, 2022 – 2035 (USD Billion)
- 5.1 Key trends
- 5.2 Tubular Steel
- 5.3 Concrete
- 5.4 Hybrid Steel-Concrete
- 5.5 Lattice
- 5.6 Others
Chapter 6 Market Size and Forecast, By Deployment, 2022 – 2035 (USD Billion)
- 6.1 Key trends
- 6.2 Onshore
- 6.3 Offshore
Chapter 7 Market Size and Forecast, By Tower Height, 2022 – 2035 (USD Billion)
- 7.1 Key trends
- 7.2 ≤80 m
- 7.3 81-120 m
- 7.4 121-160 m
- 7.5 >160 m
Chapter 8 Market Size and Forecast, By End Use, 2022 – 2035 (USD Billion)
- 8.1 Key trends
- 8.2 Residential
- 8.3 Commercial
- 8.4 Utility
Chapter 9 Market Size and Forecast, By Region, 2022 – 2035 (USD Billion)
- 9.1 Key trends
- 9.2 North America
- 9.2.1 U.S.
- 9.2.2 Canada
- 9.2.3 Mexico
- 9.3 Europe
- 9.3.1 Germany
- 9.3.2 Spain
- 9.3.3 UK
- 9.3.4 France
- 9.3.5 Italy
- 9.3.6 Sweden
- 9.4 Asia Pacific
- 9.4.1 China
- 9.4.2 Japan
- 9.4.3 South Korea
- 9.4.4 India
- 9.4.5 Australia
- 9.5 Middle East & Africa
- 9.5.1 South Africa
- 9.5.2 Egypt
- 9.6 Latin America
- 9.6.1 Brazil
- 9.6.2 Chile
- 9.6.3 Argentina
Chapter 10 Company Profiles
- 10.1 Anyang Machinery
- 10.2 Arcosa Wind Towers
- 10.3 Bergey Windpower
- 10.4 Broadwind
- 10.5 CS Wind Corporation
- 10.6 Cubuilt Engineers
- 10.7 Dongkuk
- 10.8 Enel Green Power
- 10.9 ENERCON
- 10.10 Faccin
- 10.11 GE Vernova
- 10.12 GRI Renewable Industries
- 10.13 Hitachi
- 10.14 KGW Schweriner Maschinen- und Anlagenbau GmbH
- 10.15 Nordex
- 10.16 Qingdao Aeolos Wind Power
- 10.17 ReGen Powertech Private Limited
- 10.18 Siemens Gamesa Renewable Energy
- 10.19 Vestas Wind Systems
- 10.20 XEMC Windpower

 2034年風力塔市場預測-按塔型、塔高、渦輪機功率、部署狀態、最終用戶和地區分類的全球分析
 風力渦輪機塔筒市場:全球市場預測,2026-2032年
 風力發電機塔架:市場佔有率分析、產業趨勢與統計、成長預測(2026-2031)
 風力渦輪機塔筒市場規模、佔有率、成長及全球產業分析:按類型、應用和地區分類,並預測至2026-2034年
 風力塔市場 - 全球產業規模、佔有率、趨勢、機會、預測:按類型、應用、安裝類型、容量、地區和競爭格局分類,2021-2031年風力發電機塔筒市場 - 全球產業規模、佔有率、趨勢、機會及按類型、安裝方式、地區和競爭格局分類的預測(2021-2031年)
 風力塔市場規模、佔有率和成長分析(按類型、安裝方式、應用和地區分類)—產業預測(2026-2033 年)2032 年風力發電機塔架市場預測:按塔類型、高度、額定容量、基礎類型、塗層、應用和地區分類的全球分析離岸風電塔市場(按塔類型、材料類型、塔高和最終用途)—2025-2030 年全球預測
 風力發電機塔架市場規模、佔有率、趨勢分析報告:按類型、地點、地區、細分市場、預測,2025 年至 2030 年