


 |
市場調查報告書
商品編碼
2109175
公用事業規模鈉離子能源儲存系統系統市場機會、成長促進因素、產業趨勢分析及2026-2035年預測Utility-Scale Sodium-Ion Energy Storage Systems Market Opportunity, Growth Drivers, Industry Trend Analysis, and Forecast 2026 - 2035 |
||||||

預計到 2025 年,全球公用事業規模鈉離子能源儲存系統市場價值將達到 1.132 億美元,年複合成長率為 35.7%,到 2035 年將達到 31 億美元。
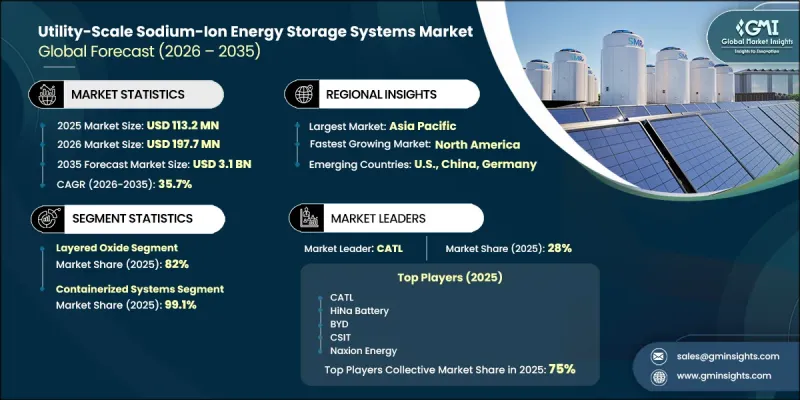
可再生能源發電的快速擴張以及對可靠的電網級儲能解決方案日益成長的需求,為該市場創造了強勁的成長機會。隨著電力公司和能源開發商尋求能夠提高運行安全性並減少對關鍵原料依賴的儲能解決方案,鈉離子電池技術正從示範階段邁向商業化部署。這種化學成分使其在大多數商業配方中無需鋰、鈷和石墨,從而具有競爭優勢,有助於電池供應鏈多元化,並降低原料價格波動的風險。此外,其在寬廣的動作溫度範圍內具有卓越的熱穩定性,即使在惡劣環境下也能提高系統可靠性。隨著可再生能源發電不斷併入電網,對能夠平衡間歇性發電、同時支持電網穩定、能源安全和長期脫碳努力的經濟高效的大規模儲能技術的需求日益成長。
| 市場範圍 | |
|---|---|
| 開始年份 | 2025 |
| 預測期 | 2026-2035 |
| 初始市場規模 | 1.132億美元 |
| 預計金額 | 31億美元 |
| 複合年成長率 | 35.7% |
隨著電力公司和電網運營商加大對先進電池技術的投資,旨在整合可再生能源並提升長期儲能性能,公用事業規模的鈉離子能源儲存系統系統市場正蓬勃發展。隨著加強國內供應鏈和減少對關鍵礦產的依賴變得日益重要,鈉離子電池技術在公用事業規模項目中的應用也日益廣泛。製造商正在擴大商業產能,同時提升電池效率、能量密度和系統可靠性,以滿足電力公司不斷變化的需求。製造流程和電池設計的持續進步也透過降低生產成本和擴充性,推動了更廣泛的商業化應用。隨著全球對可再生能源發電投資的持續成長,預計在預測期內,對可靠、安全且經濟高效的鈉離子能源儲存系統的需求將加速成長。
預計到2025年,層狀氧化物正極材料市佔率將達到82%,並在2026年至2035年間以32.1%的複合年成長率成長。該細分市場憑藉其能量密度、電化學性能和製造效率的完美結合,保持著主導地位。由於其與最初為鋰離子電池製造而開發的生產設備相容,製造商能夠在實現大規模商業化生產的同時,最佳化資本投資。這些優勢持續推動著公用事業規模鈉離子電池應用領域對層狀氧化物正極材料的需求。
預計到2025年,貨櫃式系統市佔率將達到99.1%,並在2035年之前以33.5%的複合年成長率成長。標準化貨櫃式系統設計因其簡化了運輸、安裝、專案開發、併網和運作管理等環節,成為首選的部署模式。標準化貨櫃配置的廣泛應用,使得電力公司和開發商能夠在現有電網級電池專案的框架內部署鈉離子能源儲存系統,同時降低設計複雜性並加快專案實施。
預計2026年至2035年,北美公用事業規模鈉離子能源儲存系統市場將以92.5%的複合年成長率成長。該地區市場擴張的促進因素包括電網現代化投資的增加、有利於儲能的政策、國內電池製造舉措的擴展以及可再生能源項目的日益普及。隨著對高可靠性能源基礎設施和長期儲能技術的需求不斷成長,公用事業公司和獨立發電企業正在評估鈉離子電池作為未來大型儲能設施的可行替代方案。
目錄
第1章:調查方法和範圍
第2章執行摘要
第3章 行業洞察
- 產業生態系分析
- 原物料供應商
- 電池製造商和組件組裝
- 系統整合商和BESS OEM
- EPC承包商、安裝商和試運行合作夥伴的分析
- 電網營運商、電力購買者和需求者
- 監理情勢
- 技術與創新展望
- 鈉離子電池和鋰離子電池(LFP):技術和經濟比較評估。
- 陽極技術的發展
- 電解發展趨勢
- 專為鈉離子電池設計的電池管理系統 (BMS) 創新
- 用於公用事業規模部署的溫度控管和安全系統
- 影響產業的因素
- 促進因素
- 產業潛在風險與挑戰
- 成長潛力分析
- 波特的分析
- PESTLE分析
- 投資與資金籌措分析
- 創業投資與私募股權投資趨勢
- 政府補貼和公共資金
- 企劃案融資、獨立發電廠投資和開發商股本趨勢
- 人工智慧和生成式人工智慧對市場的影響
- 利用人工智慧改造現有經營模式
- 生成式人工智慧的應用案例與實施藍圖
- 風險、限制和監管考量
- 將永續發展措施與工業4.0結合
- 未來展望與策略機遇
第4章 競爭情勢
- 介紹
- 企業市佔率分析:按地區分類
- 北美洲
- 歐洲
- 亞太地區
- 主要進展
- 重要合作夥伴關係和合作
- 主要併購活動
- 產品創新和新產品發布
- 市場擴大策略
- 競爭定位矩陣
- 排名分類標準與遴選標準
- 按銷售額、地區和創新能力分類的層級定位矩陣。
第5章 市場規模及預測:依化學品類別分類,2022-2035年
- 多層氧化物
- 普魯士藍類似物
- 多陰離子化合物
- 其他
第6章 市場規模及預測:依配置分類,2022-2035年
- 基於容器的系統
- 機架式系統
- 整合固定系統
第7章 市場規模及預測:以額定產量計算,2022-2035年
- 小於10兆瓦
- 10~50 MW
- 50~150 MW
- 150~500 MW
- 超過500兆瓦
第8章 市場規模及預測:依保存期限分類,2022-2035年
- 時長短(1-2小時)
- 中等保存期限(2-4小時)
- 持續時間長(4-8小時)
- 超長期/LDES(超過8小時)
第9章 市場規模及預測:依性別分類的互聯互通情況,2022-2035年
- 並網型
- 電力分配網路連接類型
- 其他
第10章 市場規模及預測:依應用領域分類,2022-2035年
- 可再生能源併網
- 網格穩定
- 尖峰用電調節和負荷轉移
- 頻率限制
- 應急電源
- 其他
第11章 市場規模與預測:依最終用途分類,2022-2035年
- 配電系統運營商(DSO)
- 獨立發電商(IPP)
- 可再生能源開發公司
- 政府附屬輸電業者和公共機構
- 其他
第12章 市場規模及預測:依地區分類,2022-2035年
- 北美洲
- 美國
- 加拿大
- 歐洲
- 德國
- 英國
- 法國
- 瑞典
- 亞太地區
- 中國
- 印度
- 日本
- 世界其他地區
第13章:公司簡介
- Altris AB
- BYD
- BenAn Energy
- Bihar Batteries
- CATL
- CSIT
- Faradion
- HiNa Battery
- Inlyte Energy
- Indi Energy
- Naxion Energy
- Natron Energy
- Peak Energy
- Phenogy
- TIAMAT
The Global Utility-Scale Sodium-Ion Energy Storage Systems Market was valued at USD 113.2 million in 2025 and is estimated to grow at a CAGR of 35.7% to reach USD 3.1 billion by 2035.
Rapid expansion of renewable power generation and the increasing requirement for reliable grid-scale energy storage solutions are creating strong growth opportunities for the market. Sodium-ion battery technology is moving beyond the demonstration stage and entering commercial deployment as utilities and energy developers seek storage solutions that reduce dependence on critical raw materials while improving operational safety. Chemistry offers a competitive advantage through the elimination of lithium, cobalt, and graphite in most commercial formulations, helping diversify battery supply chains and reduce exposure to raw material price fluctuations. In addition, excellent thermal stability across a broad operating temperature range enhances system reliability in demanding environments. The increasing integration of renewable energy into power grids continues to drive demand for cost-effective, large-scale storage technologies capable of balancing intermittent electricity generation while supporting grid stability, energy security, and long-term decarbonization initiatives.
| Market Scope | |
|---|---|
| Start Year | 2025 |
| Forecast Year | 2026-2035 |
| Start Value | $113.2 Million |
| Forecast Value | $3.1 Billion |
| CAGR | 35.7% |
The utility-scale sodium-ion energy storage systems market is gaining momentum as energy providers and grid operators increase investments in advanced battery technologies designed to improve renewable energy integration and long-duration storage performance. Growing emphasis on strengthening domestic supply chains and reducing dependence on critical minerals is encouraging wider adoption of sodium-ion battery technology across utility-scale projects. Manufacturers are expanding commercial production capacity while improving battery efficiency, energy density, and system reliability to address evolving utility requirements. Continued advancements in manufacturing processes and battery design are also supporting broader commercialization by lowering production costs and improving scalability. As global investments in renewable power generation continue to rise, demand for dependable, safe, and economically competitive sodium-ion storage systems is expected to accelerate throughout the forecast period.
The layered oxide cathode materials segment accounted for 82% share in 2025, and is projected to grow at a CAGR of 32.1% during 2026-2035. This segment maintains its leadership by offering an effective combination of energy density, electrochemical performance, and manufacturing efficiency. Compatibility with production equipment originally developed for lithium-ion battery manufacturing enables manufacturers to optimize capital investments while supporting large-scale commercial production. These advantages continue to strengthen demand for layered oxide cathode materials across utility-scale sodium-ion battery applications.
The containerized systems segment held a 99.1% share in 2025 and is forecast to grow at a CAGR of 33.5% through 2035. Standardized container-based system designs have become the preferred deployment format because they simplify transportation, installation, project development, grid integration, and operational management. The widespread adoption of standardized container configurations enables utilities and developers to deploy sodium-ion energy storage systems within existing grid-scale battery project frameworks while reducing engineering complexity and accelerating project implementation.
North America Utility-Scale Sodium-Ion Energy Storage Systems Market is projected to grow at a CAGR of 92.5% during 2026-2035. Market expansion across the region is supported by increasing investments in grid modernization, favorable energy storage policies, expanding domestic battery manufacturing initiatives, and the growing deployment of renewable energy projects. Rising demand for resilient energy infrastructure and long-duration storage technologies is encouraging utilities and independent power producers to evaluate sodium-ion batteries as a viable alternative for future large-scale energy storage installations.
Key Players in the global utility-scale sodium-ion energy storage systems market include Peak Energy, BenAn Energy, TIAMAT Energy, Naxion Energy, HiNa Battery, Faradion, BYD, Altris AB, Inlyte Energy, CATL, CSIT, Phenogy, Indi Energy, Bihar Batteries. Companies operating in the utility-scale sodium-ion energy storage systems market are focusing on expanding manufacturing capacity, improving battery performance, and accelerating commercialization to strengthen their competitive position. Leading manufacturers are investing heavily in research and development to enhance energy density, cycle life, safety, and overall system efficiency while lowering production costs. Strategic collaborations with utilities, renewable energy developers, and grid operators are helping companies secure large-scale deployment opportunities and strengthen their market presence. Businesses are also emphasizing localized manufacturing, supply chain diversification, and technological innovation to reduce dependence on critical minerals and improve production resilience. In addition, long-term partnerships, product portfolio expansion, pilot project execution, and continuous advancements in battery chemistry remain key strategies supporting sustainable growth and stronger market positioning.
Table of Contents
Chapter 1 Methodology & Scope
- 1.1 Research approach
- 1.2 Quality commitments
- 1.2.1 GMI AI policy & data integrity commitment
- 1.2.1.1 Source consistency protocol
- 1.2.1 GMI AI policy & data integrity commitment
- 1.3 Research trail & confidence scoring
- 1.3.1 Research trail components
- 1.3.2 Scoring components
- 1.4 Data collection
- 1.4.1 Partial list of primary sources
- 1.5 Data mining sources
- 1.5.1 Paid sources
- 1.5.1.1 Sources, by region
- 1.5.1 Paid sources
- 1.6 Base estimates and calculations
- 1.6.1 Base year calculation for any one approach
- 1.7 Market estimates & forecasts parameters
- 1.8 Forecast model
- 1.8.1 Quantified market impact analysis
- 1.8.1.1 Mathematical impact of growth parameters on forecast
- 1.8.1 Quantified market impact analysis
- 1.9 Research transparency addendum
- 1.9.1 Source attribution framework
- 1.9.2 Quality assurance metrics
- 1.9.3 Our commitment to trust
- 1.10 Market definitions
Chapter 2 Executive Summary
- 2.1 Industry synopsis, 2022 - 2035
- 2.1.1 Business trends
- 2.1.2 Chemistry trends
- 2.1.3 Configuration trends
- 2.1.4 Power rating trends
- 2.1.5 Storage duration trends
- 2.1.6 Connectivity trends
- 2.1.7 Application trends
- 2.1.8 End use trends
- 2.1.9 Regional trends
Chapter 3 Industry Insights
- 3.1 Industry ecosystem analysis
- 3.1.1 Raw material suppliers
- 3.1.2 Cell manufacturers & module assemblers
- 3.1.3 System integrators & BESS OEMS
- 3.1.4 EPC contractors, installers & commissioning partner analysis
- 3.1.5 Grid operators, offtakers & end-users
- 3.2 Regulatory landscape
- 3.3 Technology & innovation landscape
- 3.3.1 Sodium-Ion vs. Lithium-Ion (LFP): comparative technical & economic assessment
- 3.3.2 Anode technology evolution
- 3.3.3 Electrolyte developments
- 3.3.4 Battery Management System (BMS) innovations purpose-built for na-ion
- 3.3.5 Thermal management & safety systems for utility-scale deployment
- 3.4 Industry impact forces
- 3.4.1 Growth drivers
- 3.4.2 Industry pitfalls & challenges
- 3.5 Growth potential analysis
- 3.6 Porter's analysis
- 3.6.1 Bargaining power of suppliers
- 3.6.2 Bargaining power of buyers
- 3.6.3 Threat of new entrants
- 3.6.4 Threat of substitutes
- 3.7 PESTEL analysis
- 3.7.1 Political factors
- 3.7.2 Economic factors
- 3.7.3 Social factors
- 3.7.4 Technological factors
- 3.7.5 Legal factors
- 3.7.6 Environmental factors
- 3.8 Investment & funding analysis
- 3.8.1 Venture capital & private equity investment trends
- 3.8.2 Government grants & public funding
- 3.8.3 Project finance, ipp investments & developer equity flows
- 3.9 Impact of AI & Generative AI on the market (Driven by Primary Research)
- 3.9.1 AI-Driven disruption of existing business models
- 3.9.2 GenAI use cases & adoption roadmap
- 3.9.3 Risks, limitations & regulatory considerations
- 3.10 Sustainability initiatives & industry 4.0 integration
- 3.11 Future outlook & strategic opportunities
Chapter 4 Competitive Landscape, 2026
- 4.1 Introduction
- 4.2 Company market share analysis, by region, 2025
- 4.2.1 North America
- 4.2.2 Europe
- 4.2.3 Asia Pacific
- 4.3 Key developments
- 4.3.1 Key partnerships & collaborations
- 4.3.2 Major M&A activities
- 4.3.3 Product innovations & launches
- 4.3.4 Market expansion strategies
- 4.4 Competitive positioning matrix
- 4.4.1 Tier classification criteria & qualifying thresholds
- 4.4.2 Tier positioning matrix by revenue, geography & innovation
Chapter 5 Market Size and Forecast, By Chemistry, 2022 - 2035 (USD Million)
- 5.1 Key trends
- 5.2 Layered Oxide
- 5.3 Prussian Blue Analogues
- 5.4 Polyanionic Compounds
- 5.5 Others
Chapter 6 Market Size and Forecast, By Configuration, 2022 - 2035 (USD Million)
- 6.1 Key trends
- 6.2 Containerized Systems
- 6.3 Rack-Mounted Systems
- 6.4 Integrated Stationary Systems
Chapter 7 Market Size and Forecast, By Power Rating, 2022 - 2035 (USD Million)
- 7.1 Key trends
- 7.2 <10 MW
- 7.3 >10-50 MW
- 7.4 >50-150 MW
- 7.5 >150-500 MW
- 7.6 >500 MW
Chapter 8 Market Size and Forecast, By Storage Duration, 2022 - 2035 (USD Million)
- 8.1 Key trends
- 8.2 Short Duration (1-2h)
- 8.3 Medium Duration (2-4h)
- 8.4 Long Duration (4-8h)
- 8.5 Extra-Long/LDES (>8h)
Chapter 9 Market Size and Forecast, By Connectivity, 2022 - 2035 (USD Million)
- 9.1 Key trends
- 9.2 Transmission-Connected
- 9.3 Distribution-Connected
- 9.4 Others
Chapter 10 Market Size and Forecast, By Application, 2022 - 2035 (USD Million)
- 10.1 Key trends
- 10.2 Renewable Energy Integration
- 10.3 Grid Stabilization
- 10.4 Peak Shaving & Load Shifting
- 10.5 Frequency Regulation
- 10.6 Backup Power
- 10.7 Others
Chapter 11 Market Size and Forecast, By End Use, 2022 - 2035 (USD Million)
- 11.1 Key trends
- 11.2 Distribution System Operators (DSOs)
- 11.3 Independent Power Producers (IPPs)
- 11.4 Renewable Energy Developers
- 11.5 Government Grid Operators & Public Sector Agencies
- 11.6 Others
Chapter 12 Market Size and Forecast, By Region, 2022 - 2035 (USD Million)
- 12.1 Key trends
- 12.2 North America
- 12.2.1 U.S.
- 12.2.2 Canada
- 12.3 Europe
- 12.3.1 Germany
- 12.3.2 UK
- 12.3.3 France
- 12.3.4 Sweden
- 12.4 Asia Pacific
- 12.4.1 China
- 12.4.2 India
- 12.4.3 Japan
- 12.5 Rest of World
Chapter 13 Company Profiles
- 13.1 Altris AB
- 13.2 BYD
- 13.3 BenAn Energy
- 13.4 Bihar Batteries
- 13.5 CATL
- 13.6 CSIT
- 13.7 Faradion
- 13.8 HiNa Battery
- 13.9 Inlyte Energy
- 13.10 Indi Energy
- 13.11 Naxion Energy
- 13.12 Natron Energy
- 13.13 Peak Energy
- 13.14 Phenogy
- 13.15 TIAMAT

 全固態電池材料市場預測至2034年-全球分析(按材料類型、固體電解質類型、正極材料、負極材料、介面材料、電池化學、形狀、應用、最終用戶和地區分類)
 鈉離子電池:市場佔有率分析、行業趨勢和統計數據、成長預測(2026-2031 年)
 模組化鈉離子電池組市場分析及預測(至2035年):類型、產品、技術、組件、應用、材料類型、最終用戶、功能、安裝配置鈉離子電池市場:預測(至 2034 年)—按電池類型、陰極材料、電解類型、電池形狀、最終用戶和地區進行全球分析。
 鈉離子電池材料市場規模、佔有率、成長、全球產業分析、區域趨勢及2026年至2034年預測。
 全球鈉離子電池市場:機會與策略展望(至2035年)鈉離子電池市場預測至 2034 年—按電池類型、組件、電池容量、技術、應用、最終用戶和地區進行全球分析。
 全球鈉離子電池市場(至2040年):按電池類型、技術、應用、終端用戶產業、地區和主要企業分類
 鈉離子電池市場:2026-2032 年全球市場預測,按類型、技術、電池容量、組件、電池設計、負極材料、正極材料、電解液類型、應用和銷售管道。
 鈉離子電池市場:按類型、應用、最終用戶和地區分類