


 |
市場調查報告書
商品編碼
2101691
2026-2035 年魚貝類和肉類DNA 條碼認證的市場機會、成長要素、產業趨勢和預測。DNA Barcoding for Seafood and Meat Authentication Market Opportunity, Growth Drivers, Industry Trend Analysis, and Forecast 2026 - 2035 |
||||||

全球魚貝類和肉類認證的 DNA 條碼市場預計到 2025 年將達到 8.3 億美元,年複合成長率為 9.3%,到 2035 年將達到 20.3 億美元。
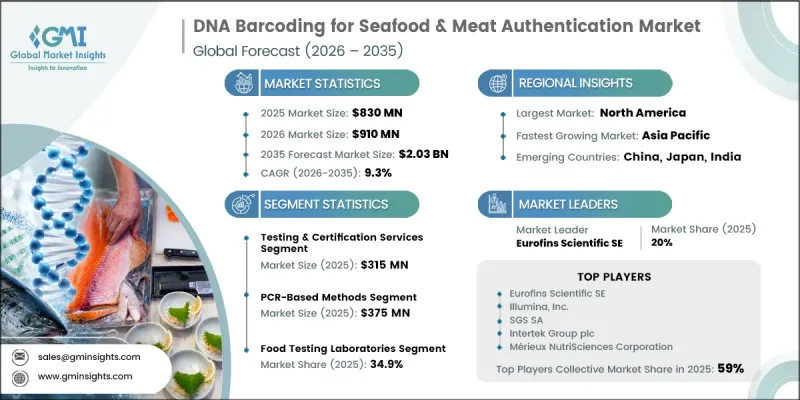
隨著食品生產商、監管機構和供應鏈相關人員日益重視產品真實性、可追溯性和食品安全,用於水產品和肉類認證的DNA條碼市場持續穩定成長。全球食品供應鏈日益複雜,以及對可靠物種鑑定方法的需求不斷成長,正在加速分子鑑定技術的應用。 DNA條碼已發展成為一種成熟的解決方案,透過提供準確且經科學檢驗的鑑定結果,為品質保證計劃提供支援。該市場已超越最初的應用階段,如今已成為商業和監管應用中食品真實性驗證流程不可或缺的一部分。對實驗室檢測、認證服務以及能夠提高檢測準確性和營運效率的先進資料管理解決方案的需求持續成長。同時,數位化實驗室系統、精心整理的參考資料資料庫和先進的分析技術正在增強真實性驗證工作流程的擴充性和可靠性。隨著法律規範的加大、品質標準的日益嚴格以及消費者信任度的不斷提升,預計該市場將進一步擴張,DNA條碼有望成為確保全球水產品和肉類供應鏈透明度和完整性的關鍵技術。
| 市場範圍 | |
|---|---|
| 開始年份 | 2025 |
| 預測期 | 2026-2035 |
| 上市時的市場規模 | 8.3億美元 |
| 預測金額 | 20.3億美元 |
| 複合年成長率 | 9.3% |
測試與認證服務領域佔據38%的市場佔有率,創造了3.15億美元的收入,預計到2035年將以8.3%的複合年成長率成長。該領域持續推動市場成長,因為經認證的測試服務對於檢驗產品真偽和支援法規遵循至關重要。對獨立檢驗服務的需求不斷成長、測試頻率的提高以及在整個品管流程中真偽驗證的廣泛應用,都是推動該領域成長的因素。對實驗室能力建設的持續投入以及測試效率的不斷提升,預計將維持對測試與認證服務的長期需求。
食品檢測實驗室在提供獨立檢測和法規遵循服務方面發揮核心作用,預計2025年將佔據34.9%的市場佔有率。食品生產商、供應鏈相關人員和品質保證計劃的持續需求將繼續推動食品檢測實驗室的擴張和對先進分子檢測技術的投資。對檢驗的檢測程序和可靠的物種鑑定的日益重視預計將在整個預測期內進一步增強需求。
預計到2025年,北美魚貝類和肉類認證的DNA條碼市場佔有率將達到34.9%,這主要得益於日益嚴格的食品安全標準、不斷成長的產品可追溯性需求以及先進檢測技術的廣泛應用。對認證檢測基礎設施、品質保證計劃和認證服務的持續投資正在推動市場擴張。未來幾年,人們對整個食品供應鏈透明度的日益關注以及分子識別技術的日益普及預計將繼續支撐該地區的成長。
目錄
第1章:調查方法和範圍
第2章執行摘要
第3章 行業洞察
- 產業生態系分析
- 供應商情況
- 利潤率
- 每個階段增加的價值
- 影響價值鏈的因素
- 中斷
- 影響產業的因素
- 促進因素
- 產業潛在風險與挑戰
- 市場機遇
- 成長潛力分析
- 監理情勢
- 波特的分析
- PESTLE分析
- 價格趨勢
- 按地區
- 依原料類型
- 未來市場趨勢
- 技術與創新展望
- 最新科技趨勢
- 新興技術
- 專利趨勢
- 貿易統計
- 主要進口國
- 主要出口國
- 永續性和環境方面
- 永續計劃
- 減少廢棄物策略
- 生產中的能源效率
- 具有環保意識的舉措
- 考慮碳足跡
第4章 競爭情勢
- 介紹
- 企業市佔率分析
- 按地區
- 北美洲
- 歐洲
- 亞太地區
- 中美洲和南美洲
- 中東和非洲
- 按地區
- 主要市場公司的競爭分析
- 競爭定位矩陣
- 主要進展
- 併購
- 夥伴關係和聯盟
- 新產品發布
- 業務拓展計劃
第5章 市場估算與預測:依產品類型分類,2022-2035年
- 測試和認證服務
- 魚貝類真偽鑑定服務
- 肉類及肉類真偽鑑定服務
- 清真/猶太潔食合規性測試服務
- 原產地檢驗服務
- 試劑盒和試劑
- DNA萃取試劑盒
- PCR試劑組和引子套裝
- NGS樣品製備盒
- 參考DNA樣本/標準品
- 設備/器材
- PCR聚合酵素連鎖反應熱迴圈儀/qPCR系統
- 次世代定序儀
- DNA微陣列掃描儀
- 可攜式和即時檢測定序設備
- 軟體資料庫
- 物種鑑定與序列分析軟體
- 資料庫訂閱(BOLD、GenBank 整合、專有開發)
- LIMS 和工作流程管理平台
- 人工智慧驅動的身份驗證決策支援工具
第6章 市場估計與預測:依技術平台分類,2022-2035年
- 基於PCR方法的方法
- 常規PCR和多重PCR
- 定量即時PCR(qPCR)
- 數位PCR(dPCR)
- 次世代定序(NGS)
- 擴增定序
- 元條碼(多標記、各種類型)
- 霰彈槍定序
- DNA微陣列
- 基於雜合反應的物種鑑定陣列
- 用於靶面板的標準化高通量篩檢陣列
- 其他新興技術
- 等溫擴增(LAMP 和 NASBA)
- 桑格定序(單基因座參考法)
- MALDI-TOF質譜
- 攜帶式生物感測器和奈米孔平台
第7章 市場估價與預測:依食品矩陣分類,2022-2035年
- 海鮮
- 魚
- 深海魚(鮪魚、劍魚、鯖魚)
- 底棲魚類(鱈魚、黑線鱈、真鯛、石斑魚)
- 鮭魚和鱒魚(鮭魚、鱒魚)
- 淡水魚(吳郭魚、鯉魚、鯰魚)
- 貝類和甲殼類動物
- 甲殼類動物(蝦、龍蝦、螃蟹)
- 軟體動物(牡蠣、貽貝、扇貝、魷魚)
- 加工海鮮
- 罐裝和燻製魚
- 魚糜及類似產品
- 裹上麵包屑或麵糊的水產品
- 魚
- 肉類及肉類
- 紅肉
- 牛(牛肉和小牛肉)
- 豬肉(豬肉)
- 綿羊和山羊(羔羊、羊肉、山羊肉)
- 家禽
- 雞肉
- 火雞和其他鳥類
- 異域肉類和野味
- 鹿肉、野牛、野生有蹄類動物
- 袋鼠、鴕鳥、外來種
- 加工肉品肉製品
- 香腸、熟食肉類和醃製食品
- 漢堡、肉丸和含有多種肉類的製品。
- 肉醬、抹醬、調理食品
- 紅肉
第8章 市場估算與預測:依最終用戶分類,2022-2035年
- 食品檢驗機構
- 商業合約研究組織(CRO)
- 經認可的第三方參考檢驗實驗室
- 食品生產商和加工商
- 海產加工公司和水產養殖公司
- 肉類加工商和肉類加工廠經營者
- 食品配料供應商和經銷商
- 監管機構和政府機構
- 各國食品安全監管機構(FDA、EFSA、FSSAI、AQSIQ)
- 海關和邊境檢查機構
- 漁業執法和非法、不通報和不管制捕撈調查部門
- 零售商及餐飲服務企業
- 超級市場和連鎖超市-自有品牌現況調查
- 餐飲服務業/餐飲集團
- 食品相關電子商務平台
- 研究和學術機構
- 大學和政府研究機構
- 國家生物多樣性與漁業資源保護研究所
- 資料庫開發組織(BOLD,GenBank策展人)
第9章 市場估計與預測:依地區分類,2022-2035年
- 北美洲
- 美國
- 加拿大
- 歐洲
- 德國
- 英國
- 法國
- 西班牙
- 義大利
- 其他歐洲國家
- 亞太地區
- 中國
- 印度
- 日本
- 澳洲
- 韓國
- 其他亞太國家
- 拉丁美洲
- 巴西
- 墨西哥
- 阿根廷
- 其他拉丁美洲國家
- 中東和非洲
- 沙烏地阿拉伯
- 南非
- UAE
- 其他中東和非洲國家
第10章:公司簡介
- Eurofins Scientific SE
- Illumina, Inc.
- SGS SA
- Intertek Group plc
- Merieux NutriSciences Corporation
- Oxford Nanopore Technologies plc
- Neogen Corporation
- AllGenetics & Biology SL
- CD Genomics
- Bureau Veritas SA
- Apical Scientific Sdn. Bhd.
- Genetic ID/FoodChain ID
- Bento Bioworks Ltd
- BIOSERVE Biotechnologies(USA)Ltd
- Oritain Global Ltd
- Genetika Science(PT Genetika Science Indonesia)
The Global DNA Barcoding for Seafood & Meat Authentication Market was valued at USD 830 million in 2025 and is estimated to grow at a CAGR of 9.3% to reach USD 2.03 billion by 2035.
The DNA barcoding for seafood & meat authentication market continues to expand steadily as food manufacturers, regulatory authorities, and supply chain participants place greater emphasis on product authenticity, traceability, and food safety. Increasing complexity in global food supply chains and rising demand for reliable species identification methods are accelerating the adoption of molecular-based authentication technologies. DNA barcoding has evolved into a well-established solution that supports quality assurance programs by delivering accurate and scientifically validated identification results. The market has progressed beyond early adoption and is now an integral component of food authentication processes across commercial and regulatory applications. Demand continues to increase for laboratory testing, certification services, and advanced data management solutions that improve testing accuracy and operational efficiency. At the same time, digital laboratory systems, curated reference databases, and advanced analytical technologies are enhancing the scalability and reliability of authentication workflows. Growing regulatory oversight, stronger quality standards, and increasing focus on consumer confidence are expected to further support market expansion, positioning DNA barcoding as a critical technology for ensuring transparency and integrity throughout the global seafood and meat supply chain.
| Market Scope | |
|---|---|
| Start Year | 2025 |
| Forecast Year | 2026-2035 |
| Start Value | $830 Million |
| Forecast Value | $2.03 Billion |
| CAGR | 9.3% |
The testing and certification services segment held 38% share, generating USD 315 million, and is projected to grow at a CAGR of 8.3% through 2035. This segment continues to lead the market because accredited testing services remain essential for validating product authenticity and supporting regulatory compliance. Growing demand for independent verification services, increasing testing frequency, and broader implementation of authentication throughout quality management processes are strengthening segment growth. Rising investment in laboratory capabilities and continuous improvements in testing efficiency are expected to sustain long-term demand for testing and certification services.
The food testing laboratories segment accounted for 34.9% share in 2025 owing to its central role in providing independent testing and regulatory compliance services. Ongoing demand from food manufacturers, supply chain participants, and quality assurance programs continues to support laboratory expansion and investment in advanced molecular testing technologies. Increasing emphasis on validated testing procedures and reliable species identification is expected to further strengthen demand throughout the forecast period.
North America DNA Barcoding for Seafood & Meat Authentication Market held 34.9% share in 2025 supported by strong food safety standards, increasing demand for product traceability, and widespread adoption of advanced laboratory testing technologies. Continuous investment in accredited testing infrastructure, quality assurance programs, and authentication services is driving market expansion. Growing focus on transparency across food supply chains and increasing adoption of molecular identification technologies are expected to sustain regional growth over the coming years.
Major companies operating in the Global DNA barcoding for seafood & meat authentication market include Eurofins Scientific SE, Illumina, Inc., SGS SA, Intertek Group plc, Merieux NutriSciences Corporation, Oxford Nanopore Technologies plc, Neogen Corporation, AllGenetics & Biology SL, CD Genomics, Bureau Veritas SA, 1st BASE / Apical Scientific Sdn. Bhd., Genetic ID / FoodChain ID, Bento Bioworks Ltd, BIOSERVE Biotechnologies (USA) Ltd, Oritain Global Ltd, and Genetika Science (PT Genetika Science Indonesia). Companies operating in the DNA barcoding for seafood & meat authentication market are strengthening their position through continuous investment in molecular testing technologies, laboratory expansion, and digital innovation. Market participants are enhancing analytical capabilities by improving testing accuracy, expanding reference databases, and integrating advanced laboratory information management systems that streamline authentication workflows. Businesses are also broadening their service portfolios to provide comprehensive testing, certification, and regulatory support for food manufacturers and supply chain partners. Strategic collaborations, geographic expansion, and investment in research and development remain important approaches for strengthening competitive advantage.
Table of Contents
Chapter 1 Methodology & Scope
- 1.1 Research approach
- 1.2 Quality Commitments
- 1.2.1 GMI AI policy & data integrity commitment
- 1.2.1.1 Source consistency protocol
- 1.2.1 GMI AI policy & data integrity commitment
- 1.3 Research Trail & Confidence Scoring
- 1.3.1 Research Trail Components
- 1.3.2 Scoring Components
- 1.4 Data Collection
- 1.4.1 Partial list of primary sources
- 1.5 Data mining sources
- 1.5.1 Paid sources
- 1.5.1.1 Sources, by region
- 1.5.1 Paid sources
- 1.6 Base estimates and calculations
- 1.6.1 Base year calculation for any one approach
- 1.7 Forecast model
- 1.7.1 Quantified market impact analysis
- 1.7.1.1 Mathematical impact of growth parameters on forecast
- 1.7.1 Quantified market impact analysis
- 1.8 Research transparency addendum
- 1.8.1 Source attribution framework
- 1.8.2 Quality assurance metrics
- 1.8.3 Our commitment to trust
Chapter 2 Executive Summary
- 2.1 Industry 360° synopsis
- 2.2 Key market trends
- 2.2.1 Regional
- 2.2.2 Offering Type
- 2.2.3 Technology Platform
- 2.2.4 Food Matrix
- 2.2.5 End-User
Chapter 3 Industry Insights
- 3.1 Industry ecosystem analysis
- 3.1.1 Supplier landscape
- 3.1.2 Profit margin
- 3.1.3 Value addition at each stage
- 3.1.4 Factor affecting the value chain
- 3.1.5 Disruptions
- 3.2 Industry impact forces
- 3.2.1 Growth drivers
- 3.2.2 Industry pitfalls and challenges
- 3.2.3 Market opportunities
- 3.3 Growth potential analysis
- 3.4 Regulatory landscape
- 3.4.1 North America
- 3.4.2 Europe
- 3.4.3 Asia Pacific
- 3.4.4 Latin America
- 3.4.5 Middle East & Africa
- 3.5 Porter's analysis
- 3.6 PESTEL analysis
- 3.7 Price trends
- 3.7.1 By region
- 3.7.2 By feedstock type
- 3.8 Future market trends
- 3.9 Technology and innovation landscape
- 3.9.1 Current technological trends
- 3.9.2 Emerging technologies
- 3.10 Patent Landscape
- 3.11 Trade statistics (HS code)
- 3.11.1 Major importing countries
- 3.11.2 Major exporting countries
- 3.12 Sustainability and environmental aspects
- 3.12.1 Sustainable practices
- 3.12.2 Waste reduction strategies
- 3.12.3 Energy efficiency in production
- 3.12.4 Eco-friendly initiatives
- 3.13 Carbon footprint consideration
Chapter 4 Competitive Landscape, 2025
- 4.1 Introduction
- 4.2 Company market share analysis
- 4.2.1 By region
- 4.2.1.1 North America
- 4.2.1.2 Europe
- 4.2.1.3 Asia Pacific
- 4.2.1.4 LATAM
- 4.2.1.5 MEA
- 4.2.1 By region
- 4.3 Competitive analysis of major market players
- 4.4 Competitive positioning matrix
- 4.5 Key developments
- 4.5.1 Mergers & acquisitions
- 4.5.2 Partnerships & collaborations
- 4.5.3 New Product Launches
- 4.5.4 Expansion Plans
Chapter 5 Market Estimates and Forecast, By Offering Type, 2022-2035 (USD Million) (Kilo Tons)
- 5.1 Key trends
- 5.2 Testing & Certification Services
- 5.2.1 Seafood Species Authentication Services
- 5.2.2 Meat & Meat Product Authentication Services
- 5.2.3 Halal/Kosher Compliance Testing Services
- 5.2.4 Geographic Origin Verification Services
- 5.3 Kits & Reagents
- 5.3.1 DNA Extraction Kits
- 5.3.2 PCR Reagent Kits & Primer Sets
- 5.3.3 NGS Library Preparation Kits
- 5.3.4 Reference DNA Panels & Standards
- 5.4 Instruments & Equipment
- 5.4.1 PCR Thermal Cyclers & qPCR Systems
- 5.4.2 Next-Generation Sequencers
- 5.4.3 DNA Microarray Scanners
- 5.4.4 Portable & Point-of-Care Sequencing Devices
- 5.5 Software & Databases
- 5.5.1 Species Identification & Sequence Analysis Software
- 5.5.2 Reference Database Subscriptions (BOLD, GenBank-Integrated, Proprietary)
- 5.5.3 LIMS & Workflow Management Platforms
- 5.5.4 AI-Powered Authentication Decision Support Tools
Chapter 6 Market Estimates and Forecast, By Technology Platform, 2022-2035 (USD Million) (Kilo Tons)
- 6.1 Key trends
- 6.2 PCR-Based Methods
- 6.2.1 Conventional & Multiplex PCR
- 6.2.2 Quantitative Real-Time PCR (qPCR)
- 6.2.3 Digital PCR (dPCR)
- 6.3 Next-Generation Sequencing (NGS)
- 6.3.1 Amplicon Sequencing
- 6.3.2 Metabarcoding (Multi-Marker, Multi-Species)
- 6.3.3 Shotgun Sequencing
- 6.4 DNA Microarrays
- 6.4.1 Hybridization-Based Species Detection Arrays
- 6.4.2 High-Throughput Screening Arrays for Standardized Target Panels
- 6.5 Other Emerging Technologies
- 6.5.1 Isothermal Amplification (LAMP & NASBA)
- 6.5.2 Sanger Sequencing (Single-Locus Reference Method)
- 6.5.3 MALDI-TOF Mass Spectrometry
- 6.5.4 Portable Biosensor & Nanopore Platforms
Chapter 7 Market Estimates and Forecast, By Food Matrix, 2022-2035 (USD Million) (Kilo Tons)
- 7.1 Key trends
- 7.2 Seafood
- 7.2.1 Finfish
- 7.2.1.1 Pelagic Species (Tuna, Swordfish, Mackerel)
- 7.2.1.2 Demersal Species (Cod, Haddock, Snapper, Grouper)
- 7.2.1.3 Salmonids (Salmon, Trout)
- 7.2.1.4 Freshwater Fish (Tilapia, Carp, Catfish)
- 7.2.2 Shellfish
- 7.2.2.1 Crustaceans (Shrimp, Lobster, Crab)
- 7.2.2.2 Mollusks (Oysters, Mussels, Scallops, Squid)
- 7.2.3 Processed Seafood Products
- 7.2.3.1 Canned & Smoked Fish
- 7.2.3.2 Surimi & Analog Products
- 7.2.3.3 Breaded & Battered Seafood
- 7.2.1 Finfish
- 7.3 Meat & Meat Products
- 7.3.1 Red Meat
- 7.3.1.1 Bovine (Beef & Veal)
- 7.3.1.2 Porcine (Pork)
- 7.3.1.3 Ovine & Caprine (Lamb, Mutton, Goat)
- 7.3.2 Poultry
- 7.3.2.1 Chicken
- 7.3.2.2 Turkey & Other Avian Species
- 7.3.3 Exotic & Game Meat
- 7.3.3.1 Venison, Bison & Wild Ungulates
- 7.3.3.2 Kangaroo, Ostrich & Non-Conventional Species
- 7.3.4 Processed Meat Products
- 7.3.4.1 Sausages, Deli Meats & Cured Products
- 7.3.4.2 Burgers, Meatballs & Mixed-Species Formulations
- 7.3.4.3 Pates, Spreads & Ready Meals
- 7.3.1 Red Meat
Chapter 8 Market Estimates and Forecast, By End-User, 2022-2035 (USD Million) (Kilo Tons)
- 8.1 Key trends
- 8.2 Food Testing Laboratories
- 8.2.1 Commercial Contract Testing Laboratories (CROs)
- 8.2.2 Accredited Third-Party Reference Laboratories
- 8.3 Food Manufacturers & Processors
- 8.3.1 Seafood Processors & Aquaculture Companies
- 8.3.2 Meat Packers & Slaughterhouse Operators
- 8.3.3 Food Ingredient Suppliers & Distributors
- 8.4 Regulatory & Government Agencies
- 8.4.1 National Food Safety Authorities (FDA, EFSA, FSSAI, AQSIQ)
- 8.4.2 Customs & Border Inspection Agencies
- 8.4.3 Fisheries Enforcement & IUU Investigation Units
- 8.5 Retailers & Foodservice Operators
- 8.5.1 Supermarket & Grocery Chains - Private Label Verification
- 8.5.2 Foodservice & Restaurant Groups
- 8.5.3 E-Commerce Food Platforms
- 8.6 Research & Academic Institutions
- 8.6.1 University & Government Research Laboratories
- 8.6.2 Biodiversity & Fisheries Conservation Institutes
- 8.6.3 Reference Database Development Organizations (BOLD, GenBank Curators)
Chapter 9 Market Estimates and Forecast, By Region, 2022-2035 (USD Million) (Kilo Tons)
- 9.1 Key trends
- 9.2 North America
- 9.2.1 U.S.
- 9.2.2 Canada
- 9.3 Europe
- 9.3.1 Germany
- 9.3.2 UK
- 9.3.3 France
- 9.3.4 Spain
- 9.3.5 Italy
- 9.3.6 Rest of Europe
- 9.4 Asia Pacific
- 9.4.1 China
- 9.4.2 India
- 9.4.3 Japan
- 9.4.4 Australia
- 9.4.5 South Korea
- 9.4.6 Rest of Asia Pacific
- 9.5 Latin America
- 9.5.1 Brazil
- 9.5.2 Mexico
- 9.5.3 Argentina
- 9.5.4 Rest of Latin America
- 9.6 Middle East and Africa
- 9.6.1 Saudi Arabia
- 9.6.2 South Africa
- 9.6.3 UAE
- 9.6.4 Rest of Middle East and Africa
Chapter 10 Company Profiles
- 10.1 Eurofins Scientific SE
- 10.2 Illumina, Inc.
- 10.3 SGS SA
- 10.4 Intertek Group plc
- 10.5 Merieux NutriSciences Corporation
- 10.6 Oxford Nanopore Technologies plc
- 10.7 Neogen Corporation
- 10.8 AllGenetics & Biology SL
- 10.9 CD Genomics
- 10.10 Bureau Veritas SA
- 10.11 Apical Scientific Sdn. Bhd.
- 10.12 Genetic ID / FoodChain ID
- 10.13 Bento Bioworks Ltd
- 10.14 BIOSERVE Biotechnologies (USA) Ltd
- 10.15 Oritain Global Ltd
- 10.16 Genetika Science (PT Genetika Science Indonesia)

 2026-2034年全球水產品及肉類DNA條碼認證市場規模、佔有率、趨勢及成長分析報告
 基因合成市場:全球市場預測(2026-2032)
 DNA條碼服務市場-全球產業規模、佔有率、趨勢、機會、預測:按類型、方法、應用、最終用途、地區和競爭格局分類,2021-2031年
 基因合成市場:按產品類型、應用、技術和地區分類
 DNA與RNA合成研究綜述:2025年
 基因合成:市場佔有率分析、產業趨勢與統計、成長預測(2026-2031)
 蛋白質合成研究綜述:2025
 基因合成市場報告:趨勢、預測與競爭分析(至2035年)酵素DNA合成市場:依產品、技術、應用和最終用戶分類-2026年至2032年全球市場預測
 DNA條碼服務市場分析及預測(至2035年):按類型、產品類型、服務、技術、組件、應用、最終用戶、流程、解決方案和階段分類