


 |
市場調查報告書
商品編碼
2101647
穩定尿素市場機會、成長要素、產業趨勢分析及2026-2035年預測Stabilized Urea Market Opportunity, Growth Drivers, Industry Trend Analysis, and Forecast 2026 - 2035 |
||||||

全球穩定尿素市場預計到 2025 年將達到 42 億美元,年複合成長率為 6.2%,到 2035 年將達到 82 億美元。
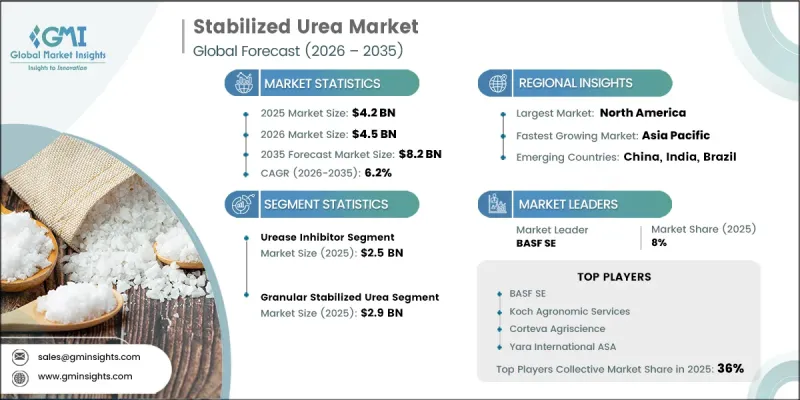
隨著市場對高效肥料的需求日益成長,這些肥料能夠提高氮肥利用率並協助實現環境目標,穩定尿素產業的成長速度持續超過傳統尿素市場。儘管由於現有市場產品供應充足,傳統尿素產業的成長速度仍然相對緩慢,但產業相關人員仍在優先考慮採用穩定技術。鼓勵使用高氮肥利用率肥料產品的監管趨勢正在重塑消費者的購買決策,並加速多個農業市場的產品推廣。這些政策轉變正在改變競爭格局,除了農業化學品的性能外,監管合規性也變得更加重要。因此,生產商正專注於已註冊和受監管的產品系列,從而在成熟農業區和發展中農業區拓展商業化機會。市場參與企業也正在投資先進的配方技術,將多種抑制技術結合在單一肥料產品中。這能夠提高氮肥的保留率,提升施肥效率,並在各種作物生產系統中帶來廣泛的性能優勢。雖然在已有相關法規的地區,這些影響會立即顯現,但對於目前正在考慮類似政策的市場而言,中期成長機會也指日可待。
| 市場範圍 | |
|---|---|
| 開始年份 | 2025 |
| 預測期 | 2026-2035 |
| 初始市場規模 | 42億美元 |
| 預測金額 | 82億美元 |
| 複合年成長率 | 6.2% |
預計到2025年,尿素分解酶抑制劑市場規模將達25億美元,並在2026年至2035年間以5%的複合年成長率成長。該細分市場繼續佔據穩定尿素需求的最大佔有率,因為尿素分解酶抑制劑仍然是全球農業市場應用最廣泛的穩定化技術。產業的擴張反映了這些產品的廣泛市場供應及其在提高氮肥利用效率和最大限度減少施肥後養分流失方面的重要作用。儘管過去十年其應用穩定成長,但在已開發國家的農業市場,該細分市場正步入一個更成熟的階段。預計的成長率反映了北美和西歐市場該領域的成熟度,同時也顯示隨著更多監管措施和永續性推動穩定氮肥的進一步應用,該領域仍存在持續的成長機會。
預計到2025年,顆粒狀穩定尿素市場規模將達到29億美元,市佔率高達65.9%,並持續維持其作為大規模農業氮肥主要施用形式的地位。顆粒狀穩定尿素因其與現有肥料處理設備的兼容性、易於儲存和運輸以及高效的田間施用能力而備受青睞。表面處理過的顆粒配方仍是商業生產的主流,使生產商能夠在保持傳統顆粒肥料操作優勢的同時,融入穩定化技術。預計在預測期內,對產品研發的持續投入將進一步提升配方性能並擴大市場需求。
預計2025年,北美穩定尿素市場規模將達14億美元,市佔率為31%。區域市場擴張的驅動力主要來自強勁的農業生產、不斷成長的化肥消費量以及旨在改善養分管理的高效氮肥產品的日益普及。人們對肥料最佳化利用的認知不斷提高、對永續農業實踐的日益重視以及對現代農業技術的持續投資,都為這兩個地區的市場長期發展提供了支持。不斷發展的農業實踐、完善的法規結構以及對提高作物產量日益成長的需求,都將進一步增強穩定尿素在預測期內的成長前景。
目錄
第1章:調查方法和範圍
第2章執行摘要
第3章 行業洞察
- 產業生態系分析
- 供應商情況
- 利潤率
- 每個階段增加的價值
- 影響價值鏈的因素
- 中斷
- 影響產業的因素
- 促進因素
- 產業潛在風險與挑戰
- 市場機遇
- 成長潛力分析
- 監理情勢
- 波特的分析
- PESTLE分析
- 價格趨勢
- 按地區
- 穩定技術
- 未來市場趨勢
- 技術與創新展望
- 最新科技趨勢
- 新興技術
- 專利趨勢
- 貿易統計
- 主要進口國
- 主要出口國
- 永續性和環境方面
- 永續計劃
- 減少廢棄物策略
- 生產中的能源效率
- 具有環保意識的舉措
- 考慮碳足跡
第4章 競爭情勢
- 介紹
- 企業市佔率分析
- 按地區
- 北美洲
- 歐洲
- 亞太地區
- LATAM
- 中東和非洲
- 按地區
- 企業矩陣分析
- 主要市場公司的競爭分析
- 競爭定位矩陣
- 主要進展
- 併購
- 夥伴關係和聯盟
- 新產品發布
- 業務拓展計劃
第5章 市場估計與預測:依穩定技術分類,2022-2035年
- 尿素酶抑制劑
- 硝化抑制劑
- 雙重抑制劑
- 其他
第6章 市場估算與預測:依物理形狀分類,2022-2035年
- 顆粒狀穩定尿素
- 顆粒型穩定尿素
- 液態/溶液穩定尿素
- 其他
第7章 市場估計與預測:依應用領域分類,2022-2035年
- 撒播/土壤施用
- 施肥和灌溉
- 葉面噴布
- 其他
第8章 市場估算與預測:依形式分類,2022-2035年
- 乾燥
- 液體
第9章 市場估計與預測:依地區分類,2022-2035年
- 北美洲
- 美國
- 加拿大
- 歐洲
- 德國
- 英國
- 法國
- 西班牙
- 義大利
- 其他歐洲國家
- 亞太地區
- 中國
- 印度
- 日本
- 澳洲
- 韓國
- 其他亞太國家
- 拉丁美洲
- 巴西
- 墨西哥
- 阿根廷
- 其他拉丁美洲國家
- 中東和非洲
- 沙烏地阿拉伯
- 南非
- UAE
- 其他中東和非洲國家
第10章:公司簡介
- BASF SE
- Koch Agronomic Services
- Corteva Agriscience
- Yara International ASA
- SKW Stickstoffwerke Piesteritz GmbH
- ICL Group
- Tessenderlo Group
- AgXplore International, LLC
- Loveland Products, Inc.
- JR Simplot Company
- Helena Agri-Enterprises, LLC
The Global Stabilized Urea Market was valued at USD 4.2 billion in 2025 and is estimated to grow at a CAGR of 6.2% to reach USD 8.2 billion by 2035.
The stabilized urea industry continues to outperform the conventional urea market as demand increasingly shifts toward enhanced-efficiency fertilizers that improve nitrogen utilization and support environmental objectives. Growth in the traditional urea sector remains comparatively moderate because established markets already have sufficient commodity supply, while industry participants continue to prioritize the wider adoption of stabilization technologies. Regulatory developments encouraging the use of nitrogen-efficient fertilizer products are reshaping purchasing decisions and accelerating product acceptance across several agricultural markets. These evolving policies are also changing the competitive landscape by placing greater emphasis on regulatory compliance alongside agronomic performance. As a result, manufacturers are focusing on registered and compliant product portfolios while expanding commercialization opportunities in both mature and developing agricultural regions. Market participants are also directing investments toward advanced formulations that combine multiple inhibitor technologies within a single fertilizer product to improve nitrogen retention, increase operational efficiency, and deliver broader performance benefits across diverse crop production systems. The impact remains immediate in regions where regulations are already implemented, while markets currently evaluating similar policies are expected to experience medium-term growth opportunities.
| Market Scope | |
|---|---|
| Start Year | 2025 |
| Forecast Year | 2026-2035 |
| Start Value | $4.2 Billion |
| Forecast Value | $8.2 Billion |
| CAGR | 6.2% |
The urease inhibitor segment accounted for USD 2.5 billion in 2025 and is projected to grow at a CAGR of 5% from 2026 to 2035. This segment continues to represent the largest share of stabilized urea demand because urease inhibitors remain the most widely adopted stabilization technology across global agricultural markets. Industry expansion reflects the broad commercial availability of these products and their established role in improving nitrogen use efficiency while minimizing nutrient losses after fertilizer application. Although adoption has steadily increased over the past decade, the segment is entering a more mature phase in developed agricultural markets. The expected growth rate reflects this level of market maturity across North America and Western Europe while also indicating continued expansion opportunities as additional regulatory measures and sustainability initiatives encourage greater use of stabilized nitrogen fertilizers.
The granular stabilized urea segment was valued at USD 2.9 billion in 2025 and represented 65.9% share, maintaining its position as the leading product format for nitrogen application across large-scale agricultural operations. Granular stabilized urea remains the preferred choice because it is compatible with existing fertilizer handling equipment, offers convenient storage and transportation, and supports efficient field application. Surface-treated granular formulations continue to dominate commercial production, enabling manufacturers to integrate stabilization technologies while preserving the operational advantages of conventional granular fertilizers. Ongoing investments in product development are expected to further improve formulation performance and strengthen demand throughout the forecast period.
North America Stabilized Urea Market accounted for 31% share in 2025, reaching USD 1.40 billion. Regional market expansion is supported by strong agricultural production, increasing fertilizer consumption, and the growing adoption of enhanced-efficiency nitrogen products designed to improve nutrient management. Rising awareness regarding fertilizer optimization, greater emphasis on sustainable farming practices, and continued investments in modern agricultural technologies are supporting long-term market development across both regions. The combination of evolving farming practices, improving regulatory frameworks, and increasing demand for higher crop productivity continues to strengthen growth prospects for stabilized urea throughout the forecast period.
Major companies operating in the global stabilized urea market include BASF SE, Koch Agronomic Services, Corteva Agriscience, Yara International ASA, SKW Stickstoffwerke Piesteritz GmbH, ICL Group, Tessenderlo Group, AgXplore International, LLC, Loveland Products, Inc., J.R. Simplot Company, and Helena Agri-Enterprises, LLC. Leading companies in the stabilized urea market focus on expanding their competitive position through continuous product innovation, strategic partnerships, portfolio diversification, and investments in advanced fertilizer technologies. Manufacturers prioritize developing enhanced-efficiency fertilizer solutions that improve nutrient utilization while meeting evolving environmental and regulatory requirements. Companies are also strengthening their market presence by expanding production capabilities, improving distribution networks, and increasing penetration across high-growth agricultural regions. Investments in research and development remain a key strategy for introducing advanced stabilization technologies and improving product performance.
Table of Contents
Chapter 1 Methodology & Scope
- 1.1 Market scope and definition
- 1.2 Research design
- 1.2.1 Research approach
- 1.2.2 Data collection methods
- 1.3 Data mining sources
- 1.3.1 Global
- 1.3.2 Regional/Country
- 1.4 Base estimates and calculations
- 1.4.1 Base year calculation
- 1.4.2 Key trends for market estimation
- 1.5 Primary research and validation
- 1.5.1 Primary sources
- 1.6 Forecast model
- 1.7 Research assumptions and limitations
Chapter 2 Executive Summary
- 2.1 Industry 360° synopsis
- 2.2 Key market trends
- 2.2.1 Regional
- 2.2.2 Stabilization Technology
- 2.2.3 Physical Form
- 2.2.4 Crop Type
- 2.2.5 Application
- 2.3 TAM Analysis, 2026-2035
- 2.4 CXO perspectives: Strategic imperatives
- 2.4.1 Executive decision points
Chapter 3 Industry Insights
- 3.1 Industry ecosystem analysis
- 3.1.1 Supplier landscape
- 3.1.2 Profit margin
- 3.1.3 Value addition at each stage
- 3.1.4 Factor affecting the value chain
- 3.1.5 Disruptions
- 3.2 Industry impact forces
- 3.2.1 Growth drivers
- 3.2.2 Industry pitfalls and challenges
- 3.2.3 Market opportunities
- 3.3 Growth potential analysis
- 3.4 Regulatory landscape
- 3.4.1 North America
- 3.4.2 Europe
- 3.4.3 Asia Pacific
- 3.4.4 Latin America
- 3.4.5 Middle East & Africa
- 3.5 Porter's analysis
- 3.6 PESTEL analysis
- 3.7 Price trends
- 3.7.1 By region
- 3.7.2 By Stabilization Technology
- 3.8 Future market trends
- 3.9 Technology and Innovation landscape
- 3.9.1 Current technological trends
- 3.9.2 Emerging technologies
- 3.10 Patent Landscape
- 3.11 Trade statistics (HS code)
- 3.11.1 Major importing countries
- 3.11.2 Major exporting countries
- 3.12 Sustainability and environmental aspects
- 3.12.1 Sustainable practices
- 3.12.2 Waste reduction strategies
- 3.12.3 Energy efficiency in production
- 3.12.4 Eco-friendly initiatives
- 3.13 Carbon footprint consideration
Chapter 4 Competitive Landscape, 2025
- 4.1 Introduction
- 4.2 Company market share analysis
- 4.2.1 By region
- 4.2.1.1 North America
- 4.2.1.2 Europe
- 4.2.1.3 Asia Pacific
- 4.2.1.4 LATAM
- 4.2.1.5 MEA
- 4.2.1 By region
- 4.3 Company matrix analysis
- 4.4 Competitive analysis of major market players
- 4.5 Competitive positioning matrix
- 4.6 Key developments
- 4.6.1 Mergers & acquisitions
- 4.6.2 Partnerships & collaborations
- 4.6.3 New Product Launches
- 4.6.4 Expansion Plans
Chapter 5 Market Estimates and Forecast, By Stabilization Technology, 2022-2035 (USD Billion)
- 5.1 Key trends
- 5.2 Urease Inhibitor
- 5.3 Nitrification Inhibitor
- 5.4 Dual Inhibitor
- 5.5 Others
Chapter 6 Market Estimates and Forecast, By Physical Form, 2022-2035 (USD Billion)
- 6.1 Key trends
- 6.2 Granular Stabilization Urea
- 6.3 Prilled Stabilization Urea
- 6.4 Liquid/Solution Stabilization Urea
- 6.5 Others
Chapter 7 Market Estimates and Forecast, By Application, 2022-2035 (USD Billion)
- 7.1 Key trends
- 7.2 Broadcast/Soil Application
- 7.3 Fertigation
- 7.4 Foliar Application
- 7.5 Others
Chapter 8 Market Estimates and Forecast, By Form, 2022-2035 (USD Billion)
- 8.1 Key trends
- 8.2 Dry
- 8.3 Liquid
Chapter 9 Market Estimates and Forecast, By Region, 2022-2035 (USD Billion)
- 9.1 Key trends
- 9.2 North America
- 9.2.1 U.S.
- 9.2.2 Canada
- 9.3 Europe
- 9.3.1 Germany
- 9.3.2 UK
- 9.3.3 France
- 9.3.4 Spain
- 9.3.5 Italy
- 9.3.6 Rest of Europe
- 9.4 Asia Pacific
- 9.4.1 China
- 9.4.2 India
- 9.4.3 Japan
- 9.4.4 Australia
- 9.4.5 South Korea
- 9.4.6 Rest of Asia Pacific
- 9.5 Latin America
- 9.5.1 Brazil
- 9.5.2 Mexico
- 9.5.3 Argentina
- 9.5.4 Rest of Latin America
- 9.6 Middle East and Africa
- 9.6.1 Saudi Arabia
- 9.6.2 South Africa
- 9.6.3 UAE
- 9.6.4 Rest of Middle East and Africa
Chapter 10 Company Profiles
- 10.1 BASF SE
- 10.2 Koch Agronomic Services
- 10.3 Corteva Agriscience
- 10.4 Yara International ASA
- 10.5 SKW Stickstoffwerke Piesteritz GmbH
- 10.6 ICL Group
- 10.7 Tessenderlo Group
- 10.8 AgXplore International, LLC
- 10.9 Loveland Products, Inc.
- 10.10 J.R. Simplot Company
- 10.11 Helena Agri-Enterprises, LLC

 HPEG 和 VPEG 市場規模、佔有率和成長分析:按療法、疾病嚴重程度、疾病部位、最終用戶、患者年齡層、分銷管道和地區分類——2026-2033 年行業預測
 鈮化學品市場規模、佔有率和成長分析:按產品類型、等級、應用、最終用戶、分銷管道和地區分類-2026-2033年產業預測
 二甲苯二異氰酸酯 (XDI) 市場規模、佔有率和成長分析:按產品形式、應用領域、終端用戶產業和地區分類-2026-2033 年產業預測
 2026年全球三聚氰胺樹脂粉末市場報告2026年全球固體次氯酸鈉市場報告2026年全球尖晶石型Co3O4催化劑市場報告2026年全球萘酚紅顏料市場報告2026年全球螢光增白劑市場報告
 檸檬酸及乳酸市場機會、成長要素、產業趨勢分析及2026-2035年預測
 單乙胺全球市場規模、佔有率、趨勢和成長分析報告(2026-2034)