


 |
市場調查報告書
商品編碼
2101600
檸檬酸及乳酸市場機會、成長要素、產業趨勢分析及2026-2035年預測Citric Acid and Lactic Acid Market Opportunity, Growth Drivers, Industry Trend Analysis, and Forecast 2026 - 2035 |
||||||

預計到 2025 年,全球食品級檸檬酸和乳酸市場規模將達到 111 億美元,年複合成長率為 5.1%,到 2035 年將達到 182 億美元。
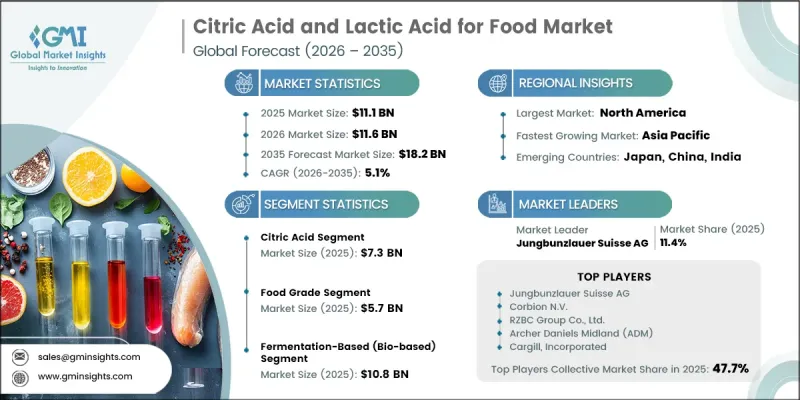
市場成長主要受檸檬酸和乳酸需求成長的驅動,二者在多個產業中均具有獨特的功能優勢。檸檬酸作為一種廣泛使用的酸味劑,其地位依然穩固;而乳酸則因其在傳統食品和醫藥領域之外更廣泛的工業應用而日益受到商業性認可。食品飲料產業仍然是最大的需求來源,因為這些成分在產品配方和加工過程中發揮著至關重要的作用。製藥和個人護理用品製造商也因其嚴格的產品品質要求和特殊的配方而對市場收入做出了顯著貢獻。發酵生產因其高效的營運以及消費者對生物基成分日益成長的偏好而繼續佔據主導地位。隨著各行業擴大轉向永續的生產方式,化學合成的替代品市場佔有率持續下降。市場成熟度因地區而異:已開發國家透過成熟的產業部門維持著穩定的消費,而新興經濟體則在都市化、加工食品消費量增加、中產階級壯大以及對製藥生產設施的持續投資等因素的推動下,經歷了更快速的成長。
| 市場範圍 | |
|---|---|
| 開始年份 | 2025 |
| 預測期 | 2026-2035 |
| 上市時的市場規模 | 111億美元 |
| 預測金額 | 182億美元 |
| 複合年成長率 | 5.1% |
預計到2025年,檸檬酸市場規模將達到73億美元,並在2026年至2035年間以3.5%的複合年成長率成長。檸檬酸是一種高效的酸味劑、防腐劑、增味劑和pH調節劑,因此在食品飲料行業擁有穩定的需求。加工食品、即飲飲料、機能性食品配方以及潔淨標示產品的持續成長正在推動市場發展。此外,製造商正致力於改進發酵技術和最佳化生產流程,以提高營運效率並實現永續性目標。除了食品應用之外,檸檬酸在醫藥、家用清潔產品和個人保健產品中的應用日益廣泛,這不僅豐富了其需求基礎,也進一步增強了其長期市場潛力。
預計到2025年,食品飲料應用領域的市場規模將達到560萬美元。檸檬酸和乳酸在食品生產中發揮著至關重要的作用,它們能夠調節酸度、保鮮、增強風味並延長各種食品飲料配方的保存期限。消費者對加工食品、飲料、乳製品、糖果甜點和簡便食品的持續需求,將繼續推動該應用領域的市場成長。醫藥、個人護理和化妝品領域也是重要的應用領域,檸檬酸和乳酸有助於調節pH值、維持配方穩定性、提升產品性能並增強成分的功能性。
預計2025年,北美食品級檸檬酸和乳酸市場規模將達37億美元,2035年將達58億美元。該地區需求保持穩定,這得益於其成熟的食品加工、製藥和個人護理用品製造業。消費者對生物基成分日益成長的偏好進一步推動了全部區域市場的擴張。在美國,加工食品消費的持續成長,以及永續包裝材料應用的不斷普及,持續為多個終端使用者產業帶來穩定的需求。這些市場狀況也促使企業投資先進的發酵技術,以提高生產效率並增強長期產能。
目錄
第1章:調查方法和範圍
第2章執行摘要
第3章 行業洞察
- 產業生態系分析
- 供應商情況
- 利潤率
- 每個階段增加的價值
- 影響價值鏈的因素
- 中斷
- 影響產業的因素
- 促進因素
- 精密農業和智慧農業的實踐正變得越來越普及。
- 水資源短缺日益嚴重,亟需提高灌溉效率。
- 政府補貼和政策支持永續土壤管理
- 產業潛在風險與挑戰
- 前期投資高:這是小規模農戶進入市場的一大障礙。
- 缺乏標準化的通訊協定和互通性問題
- 市場機遇
- 擴大精密農業和智慧農業技術的應用
- 擴大政府和永續發展舉措,以保護土壤。
- 促進因素
- 成長潛力分析
- 監理情勢
- 波特的分析
- PESTLE分析
- 價格趨勢
- 按地區
- 依產品類型
- 未來市場趨勢
- 技術與創新展望
- 最新科技趨勢
- 新興技術
- 專利趨勢
- 貿易統計資料(註:貿易統計僅涵蓋主要國家)
- 主要進口國
- 主要出口國
- 永續性和環境方面
- 永續計劃
- 減少廢棄物策略
- 生產中的能源效率
- 具有環保意識的舉措
- 考慮碳足跡
第4章 競爭情勢
- 介紹
- 企業市佔率分析
- 按地區
- 北美洲
- 歐洲
- 亞太地區
- LATAM
- 中東和非洲
- 按地區
- 企業矩陣分析
- 主要市場公司的競爭分析
- 競爭定位矩陣
- 主要進展
- 併購
- 夥伴關係和聯盟
- 新產品發布
- 業務拓展計劃
第5章 市場估算與預測:依材料類型分類,2022-2035年
- 硬體
- 土壤濕度感測器
- 土壤溫度感測器
- 土壤pH感測器
- 土壤鹽度/電導率(EC)感測器
- 土壤養分感測器
- 多參數/整合感測器
- 其他
- 軟體
- 土壤分析和製圖軟體
- 資料管理和雲端分析平台
- 利用決策支援系統(DSS)和人工智慧進行農業分析
- 服務
- 土壤檢測和分析服務
- 諮詢和顧問服務
- 安裝、校準和維護服務
第6章 市場估算與預測:依感測器類型分類,2022-2035年
- 土壤濕度感測器
- 土壤溫度感測器
- 土壤pH感測器
- 營養素/NPK感測器
- 導電性
- 多參數探頭
第7章 市場估計與預測:依應用領域分類,2022-2035年
- 農業
- 戶外種植/大田作物
- 覆蓋式栽培(溫室和塑膠大棚)
- 園藝和葡萄栽培
- 精準灌溉管理
- 環境監測
- 土壤污染及污染監測
- 侵蝕和土地劣化監測
- 碳封存和ESG合規性監測
- 建築與土壤工程
- 土地開發和地基穩定性監測
- 邊坡穩定性和結構完整性監測
- 用於運動和景觀人工草皮
- 高爾夫球場管理
- 體育場館和運動場的管理
- 商業和住宅景觀美化
- 林業與測量
- 學術和政府研究機構
- 保護區的重新造林與監測
- 其他
第8章 市場估計與預測:依地區分類,2022-2035年
- 北美洲
- 美國
- 加拿大
- 歐洲
- 德國
- 英國
- 法國
- 西班牙
- 義大利
- 其他歐洲國家
- 亞太地區
- 中國
- 印度
- 日本
- 澳洲
- 韓國
- 其他亞太國家
- 拉丁美洲
- 巴西
- 墨西哥
- 阿根廷
- 其他拉丁美洲國家
- 中東和非洲
- 沙烏地阿拉伯
- 南非
- UAE
- 其他中東和非洲國家
第9章:公司簡介
- METER Group, Inc.
- Campbell Scientific, Inc.
- The Toro Company
- SGS Group
- Sentek Technologies
- Pessl Instruments GmbH(METOS)
- Delta-T Devices Ltd
- Royal Eijkelkamp
- ICT International Pty Ltd.
- CropX Technologies Ltd.
- Sensoterra BV
- Soil Scout Ltd.
The Global Food Citric Acid & Lactic Acid Market was valued at USD 11.1 billion in 2025 and is estimated to grow at a CAGR of 5.1% to reach USD 18.2 billion by 2035.
Market growth is supported by the expanding demand for both citric acid and lactic acid, as each delivers unique functional benefits across multiple industries. Citric acid continues to maintain its position as a widely consumed acidulant, while lactic acid is gaining stronger commercial acceptance because of its broader industrial applications beyond traditional food and pharmaceutical uses. The food and beverage industry remains the largest source of demand due to the essential role these ingredients play in product formulation and processing. Pharmaceutical and personal care manufacturers also contribute significantly to market revenue because of stringent product quality requirements and specialized formulations. Fermentation-based manufacturing continues to dominate production owing to its operational efficiency and growing preference for bio-based ingredients. As industries increasingly shift toward sustainable production methods, chemically manufactured alternatives continue to lose market relevance. Market maturity varies across regions, with developed economies maintaining stable consumption through established industrial sectors, while emerging economies experience faster expansion driven by urbanization, rising packaged food consumption, growing middle-income populations, and continued investment in pharmaceutical production facilities.
| Market Scope | |
|---|---|
| Start Year | 2025 |
| Forecast Year | 2026-2035 |
| Start Value | $11.1 Billion |
| Forecast Value | $18.2 Billion |
| CAGR | 5.1% |
The citric acid segment accounted for USD 7.3 billion in 2025 and is expected to grow at a 3.5% CAGR between 2026 and 2035. Demand remains consistent across the food and beverage industry because citric acid serves as an effective acidulant, preservative, flavor enhancer, and pH regulator. Continued growth in processed food products, ready-to-drink beverages, functional food formulations, and clean-label product development supports market expansion. Manufacturers are also improving fermentation technologies and optimizing production processes to increase operational efficiency while meeting sustainability objectives. Beyond food applications, rising utilization across pharmaceutical products, household cleaning formulations, and personal care products continues to diversify the demand base and strengthen long-term market opportunities.
The food and beverages application segment generated USD 5.6 million in 2025. Both acids play an essential role in food manufacturing by supporting acidity control, product preservation, flavor enhancement, and shelf-life improvement across a broad range of food and beverage formulations. Sustained consumer demand for processed foods, beverages, dairy products, confectionery products, and convenience foods continues to reinforce market growth within this application segment. Pharmaceutical products as well as personal care and cosmetics remain important application areas where citric acid and lactic acid contribute to pH regulation, formulation stability, product performance, and ingredient functionality.
North America Citric Acid & Lactic Acid for Food Market reached USD 3.7 billion in 2025 to USD 5.8 billion by 2035. Regional demand continues to remain stable due to the strong presence of established food processing, pharmaceutical, and personal care manufacturing industries. Increasing preference for bio-based ingredients is further supporting market expansion across the region. In the United States, sustained consumption of processed food products combined with the growing adoption of sustainable packaging materials continues to generate consistent demand across several end-use industries. These market conditions are also encouraging investments in advanced fermentation technologies to improve manufacturing efficiency and strengthen long-term production capabilities.
Major companies operating in the global citric acid & lactic acid for food market include Jungbunzlauer Suisse AG, Corbion N.V., RZBC Group Co., Ltd., Archer Daniels Midland Company (ADM), Cargill, Incorporated, Galactic S.A., COFCO Biotechnology Co., Ltd., Citribel N.V., TTCA Co., Ltd., and Gadot Biochemical Industries Ltd. Companies operating in the citric acid & lactic acid for food market are strengthening their market position by expanding fermentation-based production capacity, improving manufacturing efficiency, and investing in sustainable production technologies. Many producers are focusing on product quality, cost optimization, and process innovation to meet evolving customer requirements while maintaining consistent supply. Businesses are also broadening their application portfolio by serving food and beverage, pharmaceutical, and personal care manufacturers with specialized ingredient solutions. Capacity expansion, operational improvements, and strategic investments in advanced production facilities remain key priorities for supporting future demand.
Table of Contents
Chapter 1 Methodology & Scope
- 1.1 Market scope and definition
- 1.2 Research design
- 1.2.1 Research approach
- 1.2.2 Data collection methods
- 1.3 Data mining sources
- 1.3.1 Global
- 1.3.2 Regional/Country
- 1.4 Base estimates and calculations
- 1.4.1 Base year calculation
- 1.4.2 Key trends for market estimation
- 1.5 Primary research and validation
- 1.5.1 Primary sources
- 1.6 Forecast model
- 1.7 Research assumptions and limitations
Chapter 2 Executive Summary
- 2.1 Industry 360° synopsis
- 2.2 Key market trends
- 2.2.1 Regional
- 2.2.2 Offerings
- 2.2.3 Sensor Type
- 2.2.4 Application
- 2.3 TAM Analysis, 2026-2035
- 2.4 CXO perspectives: Strategic imperatives
- 2.4.1 Executive decision points
- 2.4.2 Critical success factors
- 2.5 Future Outlook and strategic recommendations
Chapter 3 Industry Insights
- 3.1 Industry ecosystem analysis
- 3.1.1 Supplier Landscape
- 3.1.2 Profit Margin
- 3.1.3 Value addition at each stage
- 3.1.4 Factor affecting the value chain
- 3.1.5 Disruptions
- 3.2 Industry impact forces
- 3.2.1 Growth drivers
- 3.2.1.1 Rising adoption of precision agriculture & smart farming practices
- 3.2.1.2 Escalating water scarcity & imperative for irrigation efficiency
- 3.2.1.3 Government subsidies & policy push for sustainable soil management
- 3.2.2 Industry pitfalls and challenges
- 3.2.2.1 High initial capital investment: adoption barrier for smallholder farmers
- 3.2.2.2 Absence of standardized communication protocols & interoperability issues
- 3.2.3 Market opportunities
- 3.2.3.1 Increasing adoption of precision agriculture & smart farming technologies
- 3.2.3.2 Rising government & sustainability initiatives for soil conservation
- 3.2.1 Growth drivers
- 3.3 Growth potential analysis
- 3.4 Regulatory landscape
- 3.4.1 North America
- 3.4.2 Europe
- 3.4.3 Asia Pacific
- 3.4.4 Latin America
- 3.4.5 Middle East & Africa
- 3.5 Porter's analysis
- 3.6 PESTEL analysis
- 3.6.1 Technology and innovation landscape
- 3.6.2 Current technological trends
- 3.6.3 Emerging technologies
- 3.7 Price trends
- 3.7.1 By region
- 3.7.2 By product type
- 3.8 Future market trends
- 3.9 Technology and Innovation Landscape
- 3.9.1 Current technological trends
- 3.9.2 Emerging technologies
- 3.10 Patent Landscape
- 3.11 Trade statistics (HS code) (Note: the trade statistics will be provided for key countries only)
- 3.11.1 Major importing countries
- 3.11.2 Major exporting countries
- 3.12 Sustainability and environmental aspects
- 3.12.1 Sustainable practices
- 3.12.2 Waste reduction strategies
- 3.12.3 Energy efficiency in production
- 3.12.4 Eco-friendly initiatives
- 3.13 Carbon Footprint Considerations
Chapter 4 Competitive Landscape, 2025
- 4.1 Introduction
- 4.2 Company market share analysis
- 4.2.1 By region
- 4.2.1.1 North America
- 4.2.1.2 Europe
- 4.2.1.3 Asia Pacific
- 4.2.1.4 LATAM
- 4.2.1.5 MEA
- 4.2.1 By region
- 4.3 Company matrix analysis
- 4.4 Competitive analysis of major market players
- 4.5 Competitive positioning matrix
- 4.6 Key developments
- 4.6.1 Mergers & acquisitions
- 4.6.2 Partnerships & collaborations
- 4.6.3 New product launches
- 4.6.4 Expansion plans
Chapter 5 Market Estimates and Forecast, By Material Type, 2022 - 2035 (USD Million) (000' Units)
- 5.1 Key trends
- 5.2 Hardware
- 5.2.1 Soil moisture sensors
- 5.2.2 Soil temperature sensors
- 5.2.3 Soil ph sensors
- 5.2.4 Soil salinity / electrical conductivity (EC) sensors
- 5.2.5 Soil nutrient sensors
- 5.2.6 Multi-parameter / integrated sensors
- 5.2.7 Others
- 5.3 Software
- 5.3.1 Soil analysis & mapping software
- 5.3.2 Data management & cloud analytics platforms
- 5.3.3 Decision support systems (DSS) & AI-driven agronomic analytics
- 5.4 Services
- 5.4.1 Soil testing & laboratory services
- 5.4.2 Consulting & advisory services
- 5.4.3 Installation, calibration & maintenance services
Chapter 6 Market Estimates and Forecast, By Sensor Type, 2022 - 2035 (USD Million) (000' Units)
- 6.1 Key trends
- 6.2 Soil moisture sensors
- 6.3 Soil temperature sensors
- 6.4 Soil pH sensors
- 6.5 Nutrient / NPK sensors
- 6.6 Electrical conductivity
- 6.7 Multi-parameter probes
Chapter 7 Market Estimates and Forecast, By Application, 2022 - 2035 (USD Million) (000' Units)
- 7.1 Key trends
- 7.2 Agriculture
- 7.2.1 Open field / row crops
- 7.2.2 Protected cultivation (greenhouse & polyhouse)
- 7.2.3 Horticulture & viticulture
- 7.2.4 Precision irrigation management
- 7.3 Environmental monitoring
- 7.3.1 Soil contamination & pollution monitoring
- 7.3.2 Erosion & land degradation monitoring
- 7.3.3 Carbon sequestration & ESG Compliance Monitoring
- 7.4 Construction & Geotechnical
- 7.4.1 Site Preparation & Foundation Stability Monitoring
- 7.4.2 Slope Stability & Structural Integrity Monitoring
- 7.5 Sports Turf & Landscaping
- 7.5.1 Golf Course Management
- 7.5.2 Stadium & Sports Field Management
- 7.5.3 Commercial & Residential Landscaping
- 7.6 Forestry & Research
- 7.6.1 Academic & Government Research Institutions
- 7.6.2 Reforestation & Conservation Area Monitoring
- 7.7 Others
Chapter 8 Market Estimates and Forecast, By Region, 2022 - 2035 (USD Million) (000' Units)
- 8.1 Key trends
- 8.2 North America
- 8.2.1 U.S.
- 8.2.2 Canada
- 8.3 Europe
- 8.3.1 Germany
- 8.3.2 UK
- 8.3.3 France
- 8.3.4 Spain
- 8.3.5 Italy
- 8.3.6 Rest of Europe
- 8.4 Asia Pacific
- 8.4.1 China
- 8.4.2 India
- 8.4.3 Japan
- 8.4.4 Australia
- 8.4.5 South Korea
- 8.4.6 Rest of Asia Pacific
- 8.5 Latin America
- 8.5.1 Brazil
- 8.5.2 Mexico
- 8.5.3 Argentina
- 8.5.4 Rest of Latin America
- 8.6 Middle East and Africa
- 8.6.1 Saudi Arabia
- 8.6.2 South Africa
- 8.6.3 UAE
- 8.6.4 Rest of Middle East and Africa
Chapter 9 Company Profiles
- 9.1 METER Group, Inc.
- 9.2 Campbell Scientific, Inc.
- 9.3 The Toro Company
- 9.4 SGS Group
- 9.5 Sentek Technologies
- 9.6 Pessl Instruments GmbH (METOS)
- 9.7 Delta-T Devices Ltd
- 9.8 Royal Eijkelkamp
- 9.9 ICT International Pty Ltd.
- 9.10 CropX Technologies Ltd.
- 9.11 Sensoterra B.V.
- 9.12 Soil Scout Ltd.

 HPEG 和 VPEG 市場規模、佔有率和成長分析:按療法、疾病嚴重程度、疾病部位、最終用戶、患者年齡層、分銷管道和地區分類——2026-2033 年行業預測
 鈮化學品市場規模、佔有率和成長分析:按產品類型、等級、應用、最終用戶、分銷管道和地區分類-2026-2033年產業預測
 二甲苯二異氰酸酯 (XDI) 市場規模、佔有率和成長分析:按產品形式、應用領域、終端用戶產業和地區分類-2026-2033 年產業預測
 2026年全球三聚氰胺樹脂粉末市場報告2026年全球固體次氯酸鈉市場報告2026年全球尖晶石型Co3O4催化劑市場報告2026年全球萘酚紅顏料市場報告2026年全球螢光增白劑市場報告
 穩定尿素市場機會、成長要素、產業趨勢分析及2026-2035年預測
 單乙胺全球市場規模、佔有率、趨勢和成長分析報告(2026-2034)