


 |
市場調查報告書
商品編碼
2101594
2026 年至 2035 年太陽能灌溉系統的市場機會、成長要素、產業趨勢分析與預測。Solar-Powered Irrigation System Market Opportunity, Growth Drivers, Industry Trend Analysis, and Forecast 2026 - 2035 |
||||||

全球太陽能灌溉系統市場預計到 2025 年將達到 36 億美元,年複合成長率為 11%,到 2035 年將達到 112 億美元。
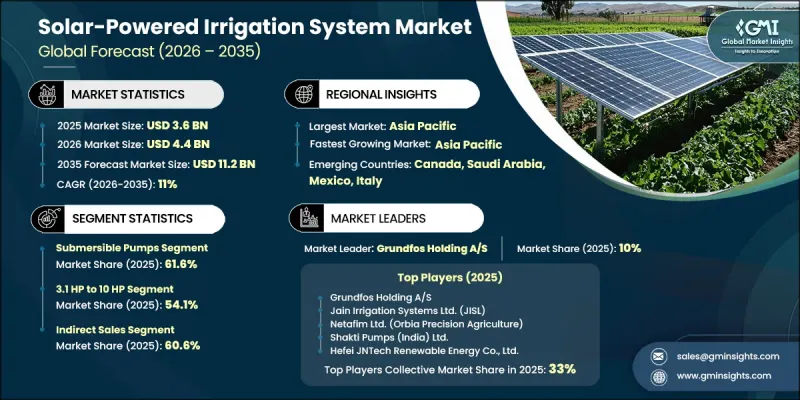
這一成長的驅動力在於農業能源使用結構性的轉變,農民正從柴油灌溉系統轉向可再生能源替代方案。燃料價格波動加劇、太陽能資金籌措機制的改善以及更嚴格的用水效率要求,正加速太陽能灌溉從小規模農民向大型農業企業的普及。從宏觀角度來看,全球糧食需求的成長、氣候變遷調適需求的增加以及太陽能系統成本的持續下降,都在增強市場的長期基本面。政府主導的補貼計畫、氣候政策舉措和多邊資金籌措舉措,進一步推動了太陽能灌溉作為經濟可行且獲得政策支持的解決方案的轉型。農業系統日益需要在提高生產力的同時降低單位產量的水和能源消耗,而太陽能灌溉正是應對這些限制的有效方案。此外,地下水位下降和降雨模式不規律,使得人們更加依賴高效灌溉技術,以確保農業生產的穩定性並減少對電網和石化燃料的依賴。因此,太陽能灌溉系統正成為全球永續農業現代化策略的核心要素。
| 市場範圍 | |
|---|---|
| 開始年份 | 2025 |
| 預測期 | 2026-2035 |
| 上市時的市場規模 | 36億美元 |
| 預測金額 | 112億美元 |
| 複合年成長率 | 11% |
預計到2025年,潛水泵市佔率將達到61.6%,並在2035年之前以10.7%的複合年成長率成長。該細分市場持續領先,主要得益於其在深層地下水抽取應用中的高度適用性,以及在水資源匱乏地區維持穩定灌溉的能力。地下水抽取解決方案的日益普及,進一步推動了整個農業市場對潛水泵配置的需求。
到2025年,功率範圍在3.1馬力至10馬力之間的灌溉系統將佔據54.1%的市場佔有率,這反映出此功率範圍的系統非常適合中小規模農業經營的需求。此功率範圍的系統廣泛用於中等深度灌溉,適用於各種規模的農場。隨著發展中國家對經濟高效且擴充性的灌溉系統的需求不斷成長,該功率範圍的灌溉系統將繼續受益,滿足其多樣化的作物生產需求。
預計到2025年,北美太陽能灌溉系統市佔率將達到21.1%,並在2035年之前以11.3%的複合年成長率成長。該地區的成長主要得益於節水農業技術投資的增加以及可再生能源灌溉解決方案的日益普及。農場層面日益重視地下水保護和能源最佳化,也持續推動全部區域的市場擴張,尤其是在灌溉能源成本和水資源管理仍然是重大營運挑戰的地區。
目錄
第1章:調查方法和範圍
第2章執行摘要
第3章 行業洞察
- 產業生態系分析
- 供應商情況
- 利潤率
- 每個階段增加的價值
- 影響價值鏈的因素
- 影響產業的因素
- 促進因素
- 向永續和低碳農業轉型
- 農民面臨的能源成本上漲
- 水資源短缺及高效灌溉的必要性
- 產業潛在風險與挑戰
- 大筆初始投資
- 過度使用地下水的風險
- 機會
- 與微灌注技術的結合
- 智慧灌溉和數位農業
- 促進因素
- 成長潛力分析
- 監理框架
- 政府補貼和激勵計劃(PM-KUSUM、USDA REAP、歐盟農場到餐桌計劃)
- 影響電網互連系統的淨計量政策
- 有關用水權和地下水開採的規定
- 國際標準和認證(IEC、ISO、BIS)
- 價格分析
- 按材料分類的歷史價格趨勢分析(2022-2025)
- 依球員類型分類的定價策略(高級球員、超值球員、成本加成球員)
- 貿易數據分析
- 進出口量及進口額趨勢
- 主要貿易路線及關稅的影響
- 人工智慧和生成式人工智慧對市場的影響
- 利用人工智慧改造現有經營模式
- 按細分市場分類的生成式人工智慧用例和部署藍圖
- 風險、限制和監管考量
- 生產能力和生產情況
- 按地區和主要生產商分類的製造能力
- 運轉率和擴張計劃
第4章 競爭情勢
- 介紹
- 企業市佔率分析
- 按地區
- 企業矩陣分析
- 主要市場公司的競爭分析
- 競爭定位矩陣
- 主要進展
- 併購
- 夥伴關係和聯盟
- 新產品發布
- 業務拓展計劃
第5章 市場估算與預測:依產品類型分類,2022-2035年
- 潛水泵
- 地面泵浦
- 浮體式泵
第6章 市場估計與預測:依組件分類,2022-2035年
- 太陽能板(光伏組件)
- 幫浦控制器/MPPT控制器
- 水泵
- 逆變器和變頻驅動器(VFD)
- 電池和儲能系統
- 系統周邊設備(BOS)及其他
第7章 市場估算與預測:依灌溉系統類型分類,2022-2035年
- 滴灌
- 噴水灌溉
- 中心樞軸和橫向移動
- 地表灌溉/漫灌
- 地下灌溉/微灌溉
第8章 市場估計與預測:依性別分類的系統連結性,2022-2035年
- 獨立式/直流(DC)太陽能發電系統
- 電池備用式離網系統
- 併網混合系統
第9章 市場估算與預測:額定功率,2022-2035年
- 3馬力或以下
- 3.1 HP~10 HP
- 10馬力或以上
第10章 市場估價與預測:依最終用戶分類,2022-2035年
- 小規模農戶和自給農戶
- 商業農場和農產品
- 溫室和可控制環境農業(CEA)
- 畜牧場和酪農
- 景觀設計、高爾夫、地方政府
- 政府和非政府組織項目
第11章 市場估價與預測:依通路分類,2022-2035年
- 直銷
- 間接銷售
第12章 市場估計與預測:依地區分類,2022-2035年
- 北美洲
- 美國
- 加拿大
- 歐洲
- 德國
- 英國
- 法國
- 義大利
- 西班牙
- 亞太地區
- 中國
- 日本
- 印度
- 澳洲
- 韓國
- 拉丁美洲
- 巴西
- 墨西哥
- 阿根廷
- 中東和非洲
- 南非
- 沙烏地阿拉伯
- UAE
第13章:公司簡介
- 世界公司
- LORENTZ(Bernt Lorentz GmbH &Co. KG)
- Grundfos Holding A/S
- Netafim Ltd.
- Jain Irrigation Systems Ltd.
- Hefei JNTech Renewable Energy Co., Ltd.
- 當地公司
- Shakti Pumps Ltd.
- CRI Pumps Pvt. Ltd.
- Tata Power Solar Systems Ltd.
- Rain Bird Corporation
- Wilo SE
- 新興企業
- SunCulture
- Futurepump Ltd.
- EBARA Bombas America do Sul Ltda.
- DAB Pumps SpA
- Zhejiang Rison Pumping Tech Co., Ltd.
The Global Solar Powered Irrigation System Market was valued at USD 3.6 billion in 2025 and is estimated to grow at a CAGR of 11% to reach USD 11.2 billion by 2035.
Growth is driven by a structural shift in agricultural energy usage as farmers transition away from diesel-based irrigation systems toward renewable energy alternatives. Rising fuel price volatility, improved access to solar financing mechanisms, and stricter water-use efficiency requirements are accelerating adoption across both smallholder and large-scale farming operations. At the macro level, increasing global food demand, climate change adaptation needs, and continuous reductions in photovoltaic system costs are strengthening long-term market fundamentals. Government-backed subsidy programs, climate policy commitments, and multilateral funding initiatives are further reinforcing the transition toward solar-powered irrigation as a financially viable and policy-supported solution. Agricultural systems are increasingly required to enhance productivity while reducing water and energy consumption per output unit, making solar-powered irrigation an effective response to these constraints. In addition, declining groundwater levels and irregular rainfall patterns are increasing reliance on efficient irrigation technologies that ensure consistent agricultural output and reduced operational dependency on grid electricity or fossil fuels. As a result, solar-powered irrigation systems are becoming a core component of sustainable agricultural modernization strategies worldwide.
| Market Scope | |
|---|---|
| Start Year | 2025 |
| Forecast Year | 2026-2035 |
| Start Value | $3.6 Billion |
| Forecast Value | $11.2 Billion |
| CAGR | 11% |
The submersible pump segment accounted for 61.6% share in 2025 and is expected to grow at a CAGR of 10.7% through 2035. This segment continues to dominate due to its strong suitability for deep groundwater extraction applications and its ability to support stable irrigation performance in regions with limited surface water availability. Increasing adoption of underground water pumping solutions is further strengthening demand for submersible configurations across agricultural markets.
The 3.1 HP to 10 HP power range segment held 54.1% share in 2025, reflecting its strong alignment with small and medium-scale farming requirements. Systems within this capacity range are widely used for moderate-depth irrigation applications and are well-suited for a broad base of agricultural land sizes. The segment continues to benefit from increasing demand for cost-efficient, scalable irrigation systems that support diverse crop production needs across developing agricultural economies.
North America Solar Powered Irrigation System Market accounted for 21.1% share in 2025 and is projected to grow at a CAGR of 11.3% through 2035. Growth in the region is supported by rising investment in water-efficient agricultural technologies and expanding adoption of renewable energy-based irrigation solutions. Increasing focus on groundwater conservation and farm-level energy optimization continues to support market expansion across agricultural regions, particularly where irrigation energy costs and water resource management remain key operational concerns.
Major companies operating in the solar powered irrigation system market include LORENTZ (Bernt Lorentz GmbH & Co. KG), Grundfos Holding A/S, Netafim Ltd. (Orbia Precision Agriculture), Jain Irrigation Systems Ltd. (JISL), Hefei JNTech Renewable Energy Co., Ltd., Shakti Pumps (India) Ltd., C.R.I. Pumps Pvt. Ltd. (CRI Group), and Tata Power Solar Systems Ltd. Companies operating in the solar powered irrigation system market are strengthening their competitive position through continuous technological innovation, expansion of product portfolios, and integration of energy-efficient pumping solutions. Manufacturers are focusing on improving system performance through advanced controllers, higher-efficiency photovoltaic modules, and smart irrigation management capabilities. Strategic partnerships with agricultural development agencies, financial institutions, and government programs are helping companies expand market access and increase adoption in rural farming regions. Businesses are also investing in localized manufacturing, cost optimization strategies, and scalable system designs to cater to diverse farm sizes and irrigation requirements.
Table of Contents
Chapter 1 Methodology and Scope
- 1.1 Market scope and definition
- 1.2 Research design
- 1.2.1 Research approach
- 1.2.2 Data collection methods
- 1.3 Data mining sources
- 1.3.1 Global
- 1.3.2 Regional/Country
- 1.4 Base estimates and calculations
- 1.4.1 Base year calculation
- 1.4.2 Key trends for market estimation
- 1.5 Primary research and validation
- 1.5.1 Primary sources
- 1.6 Forecast model
- 1.7 Research assumptions and limitations
Chapter 2 Executive Summary
- 2.1 Industry 360° synopsis
- 2.2 Key market trends
- 2.2.1 Regional
- 2.2.2 Product type
- 2.2.3 Component
- 2.2.4 Irrigation system type
- 2.2.5 System connectivity
- 2.2.6 Power rating
- 2.2.7 End user
- 2.2.8 Distribution channel
Chapter 3 Industry Insights
- 3.1 Industry ecosystem analysis
- 3.1.1 Supplier landscape
- 3.1.2 Profit margin
- 3.1.3 Value addition at each stage
- 3.1.4 Factors affecting the value chain
- 3.2 Industry impact forces
- 3.2.1 Growth drivers
- 3.2.1.1 Transition to sustainable & low-carbon agriculture
- 3.2.1.2 Rising energy costs for farmers
- 3.2.1.3 Water scarcity & need for efficient irrigation
- 3.2.2 Industry pitfalls & challenges
- 3.2.2.1 High upfront investment
- 3.2.2.2 Risk of groundwater overuse
- 3.2.3 Opportunities
- 3.2.3.1 Integration with micro-irrigation
- 3.2.3.2 Smart irrigation & digital farming
- 3.2.1 Growth drivers
- 3.3 Growth potential analysis
- 3.4 Regulatory framework
- 3.4.1 Government subsidy & incentive programs (PM-KUSUM, USDA REAP, EU farm-to-fork)
- 3.4.2 Net metering policies impacting grid-connected systems
- 3.4.3 Water use rights & groundwater extraction regulations
- 3.4.4 International standards & certifications (IEC, ISO, BIS)
- 3.5 Pricing analysis (driven by primary research)
- 3.5.1 Historical price trend analysis by material category (2022-2025)
- 3.5.2 Pricing strategy by player type (premium / value / cost-plus)
- 3.6 Trade data analysis (driven by paid database)
- 3.6.1 Import/export volume & value trends
- 3.6.2 Key trade corridors & tariff impact
- 3.7 Impact of AI & generative AI on the market
- 3.7.1 AI-driven disruption of existing business models
- 3.7.2 GenAI use cases & adoption roadmap by segment
- 3.7.3 Risks, limitations & regulatory considerations
- 3.8 Capacity & production landscape (driven by primary research)
- 3.8.1 Installed manufacturing capacity by region & key producer
- 3.8.2 Capacity utilization rates & expansion pipelines
Chapter 4 Competitive Landscape, 2025
- 4.1 Introduction
- 4.2 Company market share analysis
- 4.2.1 By region
- 4.2.1.1 North America
- 4.2.1.2 Europe
- 4.2.1.3 Asia Pacific
- 4.2.1.4 Latin America
- 4.2.1.5 Middle East and Africa
- 4.2.1 By region
- 4.3 Company matrix analysis
- 4.4 Competitive analysis of major market players
- 4.5 Competitive positioning matrix
- 4.6 Key developments
- 4.6.1 Mergers & acquisitions
- 4.6.2 Partnerships & collaborations
- 4.6.3 New product launches
- 4.6.4 Expansion plans
Chapter 5 Market Estimates and Forecast, By Product Type, 2022 - 2035 (USD Billion) (Thousand Units)
- 5.1 Key trends
- 5.2 Submersible pumps
- 5.3 Surface pumps
- 5.4 Floating pumps
Chapter 6 Market Estimates and Forecast, By Component, 2022 - 2035 (USD Billion) (Thousand Units)
- 6.1 Key trends
- 6.2 Solar panels (PV modules)
- 6.3 Pump controllers / MPPT controllers
- 6.4 Water pumps
- 6.5 Inverters & variable frequency drives (VFDs)
- 6.6 Batteries & storage systems
- 6.7 Balance of system (BOS) & others
Chapter 7 Market Estimates and Forecast, By Irrigation System Type, 2022 - 2035 (USD Billion) (Thousand Units)
- 7.1 Key trends
- 7.2 Drip irrigation
- 7.3 Sprinkler irrigation
- 7.4 Center pivot & lateral-move
- 7.5 Surface/flood irrigation
- 7.6 Subsurface/micro irrigation
Chapter 8 Market Estimates and Forecast, By System Connectivity, 2022 - 2035 (USD Billion) (Thousand Units)
- 8.1 Key trends
- 8.2 Standalone/direct solar (DC) systems
- 8.3 Battery-backed off-grid systems
- 8.4 Grid-connected hybrid systems
Chapter 9 Market Estimates and Forecast, By Power Rating, 2022 - 2035 (USD Billion) (Thousand Units)
- 9.1 Key trends
- 9.2 Up to 3 HP
- 9.3 3.1 HP to 10 HP
- 9.4 Above 10 HP
Chapter 10 Market Estimates and Forecast, By End User, 2022 - 2035 (USD Billion) (Thousand Units)
- 10.1 Key trends
- 10.2 Smallholder & subsistence farmers
- 10.3 Commercial farms & agribusinesses
- 10.4 Greenhouses & controlled environment agriculture (CEA)
- 10.5 Livestock & dairy farms
- 10.6 Landscaping, golf & municipal
- 10.7 Government & NGO projects
Chapter 11 Market Estimates and Forecast, By Distribution Channel, 2022 - 2035 (USD Billion) (Thousand Units)
- 11.1 Key trends
- 11.2 Direct sales
- 11.3 Indirect sales
Chapter 12 Market Estimates and Forecast, By Region, 2022 - 2035 (USD Billion) (Thousand Units)
- 12.1 Key trends
- 12.2 North America
- 12.2.1 U.S.
- 12.2.2 Canada
- 12.3 Europe
- 12.3.1 Germany
- 12.3.2 UK
- 12.3.3 France
- 12.3.4 Italy
- 12.3.5 Spain
- 12.4 Asia Pacific
- 12.4.1 China
- 12.4.2 Japan
- 12.4.3 India
- 12.4.4 Australia
- 12.4.5 South Korea
- 12.5 Latin America
- 12.5.1 Brazil
- 12.5.2 Mexico
- 12.5.3 Argentina
- 12.6 Middle East and Africa
- 12.6.1 South Africa
- 12.6.2 Saudi Arabia
- 12.6.3 UAE
Chapter 13 Company Profiles
- 13.1 Global players
- 13.1.1 LORENTZ (Bernt Lorentz GmbH & Co. KG)
- 13.1.2 Grundfos Holding A/S
- 13.1.3 Netafim Ltd.
- 13.1.4 Jain Irrigation Systems Ltd.
- 13.1.5 Hefei JNTech Renewable Energy Co., Ltd.
- 13.2 Regional players
- 13.2.1 Shakti Pumps Ltd.
- 13.2.2 C.R.I. Pumps Pvt. Ltd.
- 13.2.3 Tata Power Solar Systems Ltd.
- 13.2.4 Rain Bird Corporation
- 13.2.5 Wilo SE
- 13.3 Emerging players
- 13.3.1 SunCulture
- 13.3.2 Futurepump Ltd.
- 13.3.3 EBARA Bombas America do Sul Ltda.
- 13.3.4 DAB Pumps SpA
- 13.3.5 Zhejiang Rison Pumping Tech Co., Ltd.

 全球太陽能灌溉系統市場規模、佔有率、趨勢和成長分析報告(2026-2034年)
 家用小型太陽能發電系統市場分析與預測(至2035年):類型、產品、服務、技術、組件、應用、功能、安裝類型、解決方案對即插即用型家用太陽能儲能系統市場進行分析和預測,直至 2035 年:按類型、產品、服務、技術、組件、應用、最終用戶、功能和安裝配置進行分析和預測。
 太陽能電池市場-2026-2032年全球市場預測太陽能行動電池市場:2026-2032年全球市場預測(依容量範圍、面板類型、相容設備、終端用戶和分銷管道分類)
 太陽能灌溉系統:市場佔有率分析、行業趨勢和統計數據以及成長預測(2026-2031 年)
 太陽能電池市場報告:按類型、容量、最終用戶和地區分類(2026-2034 年)
 全球太陽能電池市場,2026-2030年
 太陽能灌溉系統市場-全球產業規模、佔有率、趨勢、機會和預測,按類型、組件、應用、地區和競爭格局分類,2021-2031年預測
 太陽能電池市場規模、佔有率和成長分析(按類型、容量、最終用戶和地區分類)—2026-2033年產業預測