


 |
市場調查報告書
商品編碼
2101546
硫酸鎂市場商機、成長要素、產業趨勢分析及2026-2035年預測。Magnesium Sulfate Market Opportunity, Growth Drivers, Industry Trend Analysis, and Forecast 2026 - 2035 |
||||||

全球硫酸鎂市場預計到 2025 年價值 18 億美元,並將以 4.4% 的複合年成長率成長,到 2035 年達到 28 億美元。
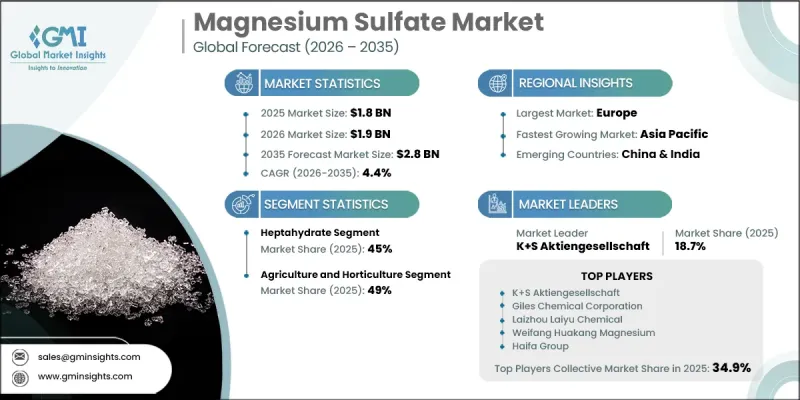
市場成長主要受已開發經濟體和新興經濟體農業、製藥和工業領域穩定需求的驅動。人們日益重視提高作物產量、維護土壤健康和提升農業效率,這推動了硫酸鎂作為重要輔助營養元素的應用。隨著集約化耕作加速養分消耗,生產者擴大將鎂基和硫基肥料納入營養管理方案,以促進植物生長並提高作物總產量。精密農業的日益普及進一步促進了平衡施肥,為硫酸鎂的消費創造了更多機會。除了農業外,硫酸鎂的廣泛功能和多功能性也推動其在製藥、特殊化學品和工業加工領域的需求。終端用戶產業的持續擴張,以及人們對高效營養管理意識的不斷提高和多元化的工業需求,預計將在預測期內推動全球硫酸鎂市場穩步成長。
| 市場範圍 | |
|---|---|
| 開始年份 | 2025 |
| 預測期 | 2026-2035 |
| 初始市場規模 | 18億美元 |
| 預計金額 | 28億美元 |
| 複合年成長率 | 4.4% |
2025年,七水硫酸鎂(瀉鹽,MgSO4·7H2O)的銷售額達到8.415億美元,市佔率為45%。預計到2035年,該細分市場將以5.1%的複合年成長率成長。其持續成長得益於在農業、製藥、個人護理、保健品、營養保健品和其他消費品產業的應用不斷擴展。七水硫酸鎂的多功能性進一步推動了其在工業和消費市場的需求。
預計到2025年,醫藥和醫療保健產業將佔據16%的市場佔有率,銷售額將達到2.992億美元。隨著藥品產量的增加和對供應鏈韌性的日益重視,製造商正在推動籌資策略的多元化,並擴大供應商網路。這些舉措可望支持全球醫療保健市場對藥用級硫酸鎂的持續需求。
2025年,北美硫酸鎂市場規模預估為3.179億美元。美國持續引領區域需求,這得益於活躍的農業活動以及硫酸鎂在改善土壤肥力和提高作物產量方面的應用日益廣泛。北美市場整體保持強勁勢頭,這得益於均衡營養管理理念的持續推廣以及醫藥和工業應用領域需求的成長。
目錄
第1章:調查方法和範圍
第2章執行摘要
第3章 行業洞察
- 產業生態系分析
- 供應商情況
- 利潤率
- 每個階段增加的價值
- 影響價值鏈的因素
- 中斷
- 影響產業的因素
- 促進因素
- 產業潛在風險與挑戰
- 市場機遇
- 成長潛力分析
- 監理情勢
- 北美洲
- 歐洲
- 亞太地區
- 拉丁美洲
- 中東和非洲
- 波特的分析
- PESTLE分析
- 價格趨勢
- 按地區
- 依產品類型
- 未來市場趨勢
- 技術與創新展望
- 最新科技趨勢
- 新興技術
- 專利趨勢
- 貿易統計
- 主要進口國
- 主要出口國
- 永續性和環境方面
- 永續計劃
- 減少廢棄物策略
- 生產中的能源效率
- 具有環保意識的舉措
第4章 競爭情勢
- 介紹
- 企業市佔率分析
- 按地區
- 北美洲
- 歐洲
- 亞太地區
- LATAM
- 中東和非洲
- 按地區
- 企業矩陣分析
- 主要市場公司的競爭分析
- 競爭定位矩陣
- 主要進展
- 併購
- 夥伴關係和聯盟
- 新產品發布
- 業務拓展計劃
第5章 市場估算與預測:依產品類型分類,2022年至2035年
- 一水合物
- 七水合物
- 無水
第6章 市場估算與預測:以實物形式分類,2022年至2035年
- 顆粒狀
- 粉末
- 水晶
- 液體
第7章 市場估計與預測:依等級分類,2022年至2035年
- 農業
- 醫療和製藥
- 食物
- 餵食
- 產業
- 消費者
第8章 市場估算與預測:依最終使用者分類,2022年至2035年
- 農業和園藝
- 製藥和醫療保健
- 食品/飲料
- 動物飼料
- 化學製造
- 消費品
第9章 市場估計與預測:依地區分類,2022年至2035年
- 北美洲
- 美國
- 加拿大
- 歐洲
- 德國
- 英國
- 法國
- 西班牙
- 義大利
- 其他歐洲國家
- 亞太地區
- 中國
- 印度
- 日本
- 澳洲
- 韓國
- 其他亞太國家
- 拉丁美洲
- 巴西
- 墨西哥
- 阿根廷
- 其他拉丁美洲國家
- 中東和非洲
- 沙烏地阿拉伯
- 南非
- UAE
- 其他中東和非洲國家
第10章:公司簡介
- K+S Aktiengesellschaft
- Giles Chemical Corporation
- Laizhou Laiyu Chemical
- Weifang Huakang Magnesium
- Haifa Group
- Penoles(Industrias Penoles)
- Mani Agro Chemicals
- Zorka Pharma
The Global Magnesium Sulfate Market was valued at USD 1.8 billion in 2025 and is estimated to grow at a CAGR of 4.4% to reach USD 2.8 billion by 2035.
Market growth is supported by consistent demand from the agriculture, pharmaceutical, and industrial sectors across both developed and emerging economies. Increasing emphasis on improving crop productivity, maintaining soil health, and enhancing agricultural efficiency is driving the adoption of magnesium sulfate as an important secondary nutrient source. As intensive farming practices continue to accelerate nutrient depletion, growers are increasingly incorporating magnesium- and sulfur-based fertilizers into nutrient management programs to improve plant development and overall crop performance. The growing adoption of precision agriculture is further encouraging balanced fertilizer application, creating additional opportunities for magnesium sulfate consumption. Beyond agriculture, demand is also rising across pharmaceutical manufacturing, specialty chemicals, and industrial processing due to the compound's broad functional properties and versatile applications. Continued expansion of these end-use industries, together with increasing awareness of efficient nutrient management and diversified industrial demand, is expected to support steady growth of the global magnesium sulfate market throughout the forecast period.
| Market Scope | |
|---|---|
| Start Year | 2025 |
| Forecast Year | 2026-2035 |
| Start Value | $1.8 Billion |
| Forecast Value | $2.8 Billion |
| CAGR | 4.4% |
The heptahydrate segment (Epsom salt, MgSO4*7H2O) generated USD 841.5 million in 2025 holding 45% share. The segment is projected to grow at a CAGR of 5.1% through 2035. Its continued growth is supported by expanding applications across agriculture, pharmaceuticals, personal care, wellness products, nutraceuticals, and other consumer-focused industries. The versatility of heptahydrate magnesium sulfate continues to strengthen demand across both industrial and consumer markets.
The pharmaceuticals and healthcare segment accounted for 16% share in 2025 and generated USD 299.2 million. Growing pharmaceutical production and increasing focus on supply chain resilience are encouraging manufacturers to diversify sourcing strategies and establish broader supplier networks. These efforts are expected to support sustained demand for pharmaceutical-grade magnesium sulfate across global healthcare markets.
North America Magnesium Sulfate Market was valued at USD 317.9 million in 2025. The United States continues to lead regional demand, supported by strong agricultural activity and increasing use of magnesium sulfate to improve soil fertility and crop productivity. Ongoing adoption of balanced nutrient management practices, combined with growing demand from pharmaceutical and industrial applications, continues to strengthen the market across North America.
Major companies operating in the global magnesium sulfate market include K+S Aktiengesellschaft, Giles Chemical Corporation, Laizhou Laiyu Chemical, Weifang Huakang Magnesium, and Haifa Group. Companies participating in the magnesium sulfate market are strengthening their competitive position through continuous product innovation, production capacity expansion, and portfolio diversification. Manufacturers are investing in advanced production technologies to improve product quality, operational efficiency, and supply reliability while meeting evolving customer requirements across agricultural, pharmaceutical, and industrial sectors. Strategic partnerships, distribution network expansion, and geographic diversification are enabling companies to strengthen market penetration and broaden their customer base. Businesses are also emphasizing research and development to develop high-performance formulations and improve application efficiency.
Table of Contents
Chapter 1 Methodology & Scope
- 1.1 Research approach
- 1.2 Quality Commitments
- 1.2.1 GMI AI policy & data integrity commitment
- 1.2.1.1 Source consistency protocol
- 1.2.1 GMI AI policy & data integrity commitment
- 1.3 Research Trail & Confidence Scoring
- 1.3.1 Research Trail Components
- 1.3.2 Scoring Components
- 1.4 Data Collection
- 1.4.1 Partial list of primary sources
- 1.5 Data mining sources
- 1.5.1 Paid sources
- 1.5.1.1 Sources, by region
- 1.5.1 Paid sources
- 1.6 Base estimates and calculations
- 1.6.1 Base year calculation for any one approach
- 1.7 Forecast model
- 1.7.1 Quantified market impact analysis
- 1.7.1.1 Mathematical impact of growth parameters on forecast
- 1.7.1 Quantified market impact analysis
- 1.8 Research transparency addendum
- 1.8.1 Source attribution framework
- 1.8.2 Quality assurance metrics
- 1.8.3 Our commitment to trust
Chapter 2 Executive Summary
- 2.1 Industry 360° synopsis
- 2.2 Key market trends
- 2.2.1 Regional
- 2.2.2 By Product Type
- 2.2.3 By Physical Form
- 2.2.4 By Grade
- 2.2.5 By End User
- 2.3 TAM Analysis, 2026 2035
- 2.4 CXO perspectives: Strategic imperatives
Chapter 3 Industry Insights
- 3.1 Industry ecosystem analysis
- 3.1.1 Supplier landscape
- 3.1.2 Profit margin
- 3.1.3 Value addition at each stage
- 3.1.4 Factor affecting the value chain
- 3.1.5 Disruptions
- 3.2 Industry impact forces
- 3.2.1 Growth drivers
- 3.2.2 Industry pitfalls and challenges
- 3.2.3 Market opportunities
- 3.3 Growth potential analysis
- 3.4 Regulatory landscape
- 3.4.1 North America
- 3.4.2 Europe
- 3.4.3 Asia Pacific
- 3.4.4 Latin America
- 3.4.5 Middle East & Africa
- 3.5 Porter's analysis
- 3.6 PESTEL analysis
- 3.7 Price trends
- 3.7.1 By region
- 3.7.2 By Product Type
- 3.8 Future market trends
- 3.9 Technology and Innovation landscape
- 3.9.1 Current technological trends
- 3.9.2 Emerging technologies
- 3.10 Patent Landscape
- 3.11 Trade statistics (HS code)
- 3.11.1 Major importing countries
- 3.11.2 Major exporting countries
- 3.12 Sustainability and environmental aspects
- 3.12.1 Sustainable practices
- 3.12.2 Waste reduction strategies
- 3.12.3 Energy efficiency in production
- 3.12.4 Eco friendly initiatives
Chapter 4 Competitive Landscape, 2025
- 4.1 Introduction
- 4.2 Company market share analysis
- 4.2.1 By region
- 4.2.1.1 North America
- 4.2.1.2 Europe
- 4.2.1.3 Asia Pacific
- 4.2.1.4 LATAM
- 4.2.1.5 MEA
- 4.2.1 By region
- 4.3 Company matrix analysis
- 4.4 Competitive analysis of major market players
- 4.5 Competitive positioning matrix
- 4.6 Key developments
- 4.6.1 Mergers & acquisitions
- 4.6.2 Partnerships & collaborations
- 4.6.3 New Product Launches
- 4.6.4 Expansion Plans
Chapter 5 Market Estimates and Forecast, By Product Type, 2022 to 2035 (USD Million) (Tons)
- 5.1 Key trends
- 5.2 Monohydrate
- 5.3 Heptahydrate
- 5.4 Anhydrous
Chapter 6 Market Estimates and Forecast, By Physical Form, 2022 to 2035 (USD Million) (Tons)
- 6.1 Key trends
- 6.2 Granular
- 6.3 Powder
- 6.4 Crystalline
- 6.5 Liquid
Chapter 7 Market Estimates and Forecast, By Grade, 2022 to 2035 (USD Million) (Tons)
- 7.1 Key trends
- 7.2 Agriculture
- 7.3 Medical/Pharmaceutical
- 7.4 Food
- 7.5 Feed
- 7.6 Industrial
- 7.7 Consumer
Chapter 8 Market Estimates and Forecast, By End User, 2022 to 2035 (USD Million) (Tons)
- 8.1 Key trends
- 8.2 Agriculture & Horticulture
- 8.3 Pharmaceutical & Healthcare
- 8.4 Food & Beverage
- 8.5 Animal Feed
- 8.6 Chemical Manufacturing
- 8.7 Consumer Goods
Chapter 9 Market Estimates and Forecast, By Region, 2022 to 2035 (USD Million) (Tons)
- 9.1 Key trends
- 9.2 North America
- 9.2.1 U.S.
- 9.2.2 Canada
- 9.3 Europe
- 9.3.1 Germany
- 9.3.2 UK
- 9.3.3 France
- 9.3.4 Spain
- 9.3.5 Italy
- 9.3.6 Rest of Europe
- 9.4 Asia Pacific
- 9.4.1 China
- 9.4.2 India
- 9.4.3 Japan
- 9.4.4 Australia
- 9.4.5 South Korea
- 9.4.6 Rest of Asia Pacific
- 9.5 Latin America
- 9.5.1 Brazil
- 9.5.2 Mexico
- 9.5.3 Argentina
- 9.5.4 Rest of Latin America
- 9.6 Middle East and Africa
- 9.6.1 Saudi Arabia
- 9.6.2 South Africa
- 9.6.3 UAE
- 9.6.4 Rest of Middle East and Africa
Chapter 10 Company Profiles
- 10.1 K+S Aktiengesellschaft
- 10.2 Giles Chemical Corporation
- 10.3 Laizhou Laiyu Chemical
- 10.4 Weifang Huakang Magnesium
- 10.5 Haifa Group
- 10.6 Penoles (Industrias Penoles)
- 10.7 Mani Agro Chemicals
- 10.8 Zorka Pharma


