


 |
市場調查報告書
商品編碼
2083376
汽車雲端平台服務與分析市場:市場機會、成長要素、產業趨勢分析及2026-2035年預測Automotive Cloud Platform Services and Analytics Market Opportunity, Growth Drivers, Industry Trend Analysis, and Forecast 2026 - 2035 |
||||||

2025 年全球汽車雲端平台服務和分析市場價值為 259 億美元,預計到 2035 年將以 15.3% 的複合年成長率成長至 1026 億美元。
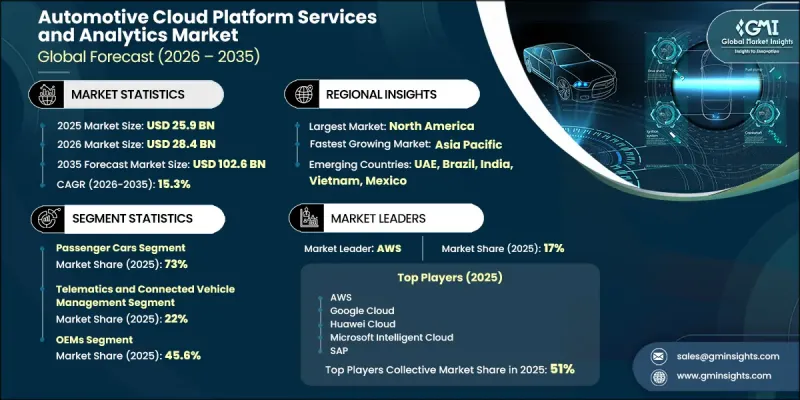
市場成長的驅動力來自軟體定義車輛的快速發展、聯網汽車數據的激增以及對能夠支援先進汽車功能的可擴展雲端環境日益成長的需求。汽車製造商越來越依賴雲端平台來管理軟體部署、資料處理、車輛分析、系統檢驗、預測性維護、空中升級和智慧車載體驗,而無需反覆重新設計其底層IT基礎設施。向以軟體為中心的車輛架構的轉變仍然是汽車雲端平台服務和分析市場最重要的成長驅動力,因為軟體現在在車輛運行、診斷、安全改進、用戶體驗和持續商機中發揮核心作用。汽車製造商正在整個軟體生命週期中利用雲端生態系,從開發和測試到部署和持續的車輛管理。對安全車輛連接、即時數據交換和智慧分析的日益重視進一步加速了雲端平台的普及。整個汽車價值鏈上的企業越來越需要即時存取遙測數據洞察、駕駛員行為分析、電池性能監控和預測性服務警報,而不是依賴延遲較高的報告系統。即時分析能力持續展現出可衡量的營運效益,尤其是在減少意外停機時間、提高資產生產力、提昇路線效率以及增強整個車隊的服務性能方面。
| 市場範圍 | |
|---|---|
| 開始年份 | 2025 |
| 預測期 | 2026-2035 |
| 初始市場規模 | 259億美元 |
| 預計金額 | 1026億美元 |
| 複合年成長率 | 15.3% |
預計到2025年,託管服務市佔率將達到60.6%,並在2035年之前以14.3%的複合年成長率成長。汽車公司擴大選擇託管服務模式,以滿足其對持續系統監控、網路安全管理、基礎設施最佳化、軟體管治和服務可用性的需求。這些解決方案有助於企業確保其全球營運的雲端效能可靠性,同時降低部署的複雜性。此外,託管服務透過提供雲端管理、安全管理、自動化和營運可靠性等領域的專業知識,幫助企業應對持續的人才招募挑戰。儘管許多汽車相關企業擁有卓越的工程能力,但這些領域仍面臨人才短缺的問題。
預計到2025年,乘用車市佔率將達到73%。這一市場主導地位得益於互聯乘用車的廣泛部署以及雲端數位服務在整個大眾市場車型系列中日益普及。消費者對增強型互聯、遠端車輛管理、數位化體驗、資訊娛樂訂閱、車輛診斷和智慧移動功能的需求持續推動著該領域雲端技術的應用。此外,電動車的日益普及也催生了對基於雲端的電池性能、充電最佳化、能源管理、續航里程估算和車輛效率監控等分析服務的需求,進一步提升了乘用車市場對整體市場成長的貢獻。
北美汽車雲端平台服務和分析市場佔據38%的佔有率,預計到2025年市場規模將達到99億美元。美國佔該地區銷售額的86.6%,這得益於其成熟的雲端技術供應商、汽車製造商和車隊管理解決方案生態系統。聯網汽車技術的積極應用、先進的遠端資訊處理基礎設施以及對數位化出行解決方案的持續投資,將繼續推動區域市場的擴張。此外,監管機構對車輛互聯、網路安全措施、安全軟體部署和受保護資料交換的關注,仍然是推動美國持續投資雲端汽車技術的關鍵因素。
目錄
第1章:調查方法和範圍
第2章執行摘要
第3章 行業洞察
- 產業生態系分析
- 供應商情況
- 原物料供應商
- 技術供應商
- OEM
- 服務供應商
- 最終用途
- 成本結構
- 利潤率
- 每個階段增加的價值
- 垂直整合趨勢
- 顛覆者
- 供應商情況
- 影響產業的因素
- 促進因素
- 軟體定義車輛(SDV)的日益普及
- 對即時車輛數據分析的需求日益成長
- 擴展互聯行程和遠端資訊處理生態系統
- 人工智慧和邊緣運算在汽車領域的融合發展
- 產業潛在風險與挑戰
- 網路安全和資料隱私風險日益加劇
- 雲端基礎設施和整合成本高昂
- 市場機遇
- 向雲端原生汽車架構遷移
- 擴大OTA軟體更新平台的部署
- 擴大數位雙胞胎和預測分析解決方案的應用
- 生成式人工智慧和車載個人化技術的擴展
- 促進因素
- 成長潛力分析
- 價格分析
- 對過去價格趨勢的分析
- 依球員類型分類的定價策略(高級球員、超值球員、成本加成球員)
- 監理情勢
- 北美洲
- 美國:國家公路交通安全管理局(NHTSA)
- 美國:車輛資料安全標準(FMVSS)
- 加拿大:車輛資料安全法規(SOR/2013-198)
- 歐洲
- 德國道路交通資料許可條例
- 英國:運輸部(MOT)資料安全標準
- 歐盟關於車輛標籤和安全的法規
- REACH合規性與永續燃料標準
- 亞太地區
- 日本低滾阻力車輛認證
- 馬來西亞:JPJ Puspakom 制定的胎面深度規定
- 澳洲:數據缺陷管理
- 中國汽車品質認證標準
- 拉丁美洲
- 巴西 INMETRO 汽車網路安全計劃
- 墨西哥NOM汽車安全法規
- 中東和非洲
- 海灣合作理事會網路安全品質法規
- 南非汽車安全合規標準
- 北美洲
- 技術與創新展望
- 最新技術
- 新興技術
- 波特的分析
- PESTLE分析
- 專利分析
- 貿易數據分析
- 進出口量及進口額趨勢
- 主要貿易路線及關稅的影響
- 生產能力和生產情況
- 生產能力:按地區和主要生產商分類
- 運轉率和擴張計劃
- 人工智慧和生成式人工智慧對市場的影響
- 利用人工智慧改造現有經營模式
- 設計最佳化自動化
- 用於需求預測的供應鏈人工智慧
- 按細分市場分類的生成式人工智慧用例和部署藍圖
- 風險、限制和監管考量
- 預測假設和情境分析
- 基本案例:驅動複合年成長率的關鍵宏觀經濟與產業變量
- 樂觀情境:宏觀經濟與產業的順風
- 悲觀情景:宏觀經濟放緩或產業逆風
- 永續性和環境方面
- 永續計劃
- 減少廢棄物策略
- 生產中的能源效率
- 具有環保意識的舉措
- 考慮碳足跡
第4章 競爭情勢
- 介紹
- 企業市佔率分析
- 北美洲
- 歐洲
- 亞太地區
- 拉丁美洲
- 中東和非洲
- 競爭定位矩陣
- 主要進展
- 併購
- 夥伴關係和聯盟
- 新產品發布
- 業務拓展計劃及資金籌措
- 按公司規模進行基準測試
- 排名分類標準與遴選標準
- 按銷售額、地區和創新能力分類的層級定位矩陣。
第5章 市場估算與預測:依雲端服務模式分類,2022-2035年
- Infrastructure as a Service(IaaS)
- Platform as a Service(PaaS)
- Software as a Service(SaaS)
第6章 市場估計與預測:依服務業分類,2022-2035年
- 專業服務
- 諮詢
- 系統整合
- 執行
- 支援與維護
- 託管服務
- 雲端基礎設施
- 資料管理和分析服務
- 安全
- 網路營運
第7章 市場估算與預測:依部署模式分類,2022-2035年
- 公共雲端
- 私有雲端
- 混合雲端
第8章 市場估價與預測:依車輛類型分類,2022-2035年
- 搭乘用車
- SUV
- 轎車
- 掀背車
- 商用車輛
- 輕型商用車(LCV)
- 中型商用車(MCV)
- 重型商用車(HCV)
第9章 市場估計與預測:依促進因素分類,2022-2035年
- 內燃機車(ICE車輛)
- 電池式電動車(BEV)
- 插電式混合動力車(PHEV)
- 混合動力電動車(HEV)
第10章 市場估價與預測:依應用領域分類,2022-2035年
- 車載資訊系統與聯網汽車管理
- 車隊管理
- 空中下載 (OTA) 更新
- 車載資訊娛樂和車載服務
- 高級駕駛輔助系統(ADAS)
- 預測性維護和遠距離診斷
- 基於里程的保險(UBI)和旅行分析
- 其他
第11章 市場估計與預測:依最終用途分類,2022-2035年
- OEM(目的地設備製造商)
- 一級供應商
- 車隊營運商
- 售後市場和服務供應商
第12章 市場估計與預測:依地區分類,2022-2035年
- 北美洲
- 美國
- 加拿大
- 歐洲
- 英國
- 德國
- 法國
- 義大利
- 西班牙
- 比利時
- 荷蘭
- 瑞典
- 俄羅斯
- 亞太地區
- 中國
- 印度
- 日本
- 澳洲
- 新加坡
- 韓國
- 越南
- 印尼
- 泰國
- 拉丁美洲
- 巴西
- 墨西哥
- 阿根廷
- 中東和非洲
- 南非
- 沙烏地阿拉伯
- UAE
- 土耳其
第13章:公司簡介
- 世界公司
- Amazon Web Services(AWS)
- Microsoft(Azure Automotive)
- Google(Google Cloud Automotive)
- IBM
- SAP
- Oracle
- Salesforce(Automotive Cloud)
- Continental
- Harman International(Samsung Electronics)
- 本地公司
- Alibaba Cloud(Alibaba)
- Huawei Technologies(Huawei Cloud)
- Robert Bosch
- Ericsson(Automotive Connectivity Cloud)
- Aptiv
- BlackBerry Limited(IVY Platform)
- NVIDIA(Automotive AI Cloud)
- 新興企業
- Qualcomm(Snapdragon Digital Chassis)
- Automotive Cloud
- Verizon Connect
- Geotab
The Global Automotive Cloud Platform Services and Analytics Market was valued at USD 25.9 billion in 2025 and is estimated to grow at a CAGR of 15.3% to reach USD 102.6 billion by 2035.
Market growth is fueled by the rapid evolution of software-defined vehicles, rising volumes of connected vehicle data, and increasing demand for scalable cloud environments capable of supporting advanced automotive functions. Automakers are increasingly relying on cloud platforms to manage software deployment, data processing, vehicle analytics, system validation, predictive maintenance, over-the-air updates, and intelligent in-cabin experiences without repeatedly redesigning their underlying IT infrastructure. The transition toward software-centric vehicle architectures remains the most significant growth catalyst for the Automotive Cloud Platform Services and Analytics Market, as software now plays a central role in vehicle operations, diagnostics, safety enhancements, user experiences, and recurring revenue opportunities. Automotive manufacturers are leveraging cloud ecosystems across the entire software lifecycle, from development and testing to deployment and ongoing fleet management. Growing emphasis on secure vehicle connectivity, real-time data exchange, and intelligent analytics is further accelerating adoption. Organizations across the automotive value chain increasingly require immediate access to telemetry insights, driver behavior analysis, battery performance monitoring, and predictive service alerts rather than relying on delayed reporting systems. Real-time analytics capabilities continue to demonstrate measurable operational benefits, particularly through reductions in unexpected downtime, improved asset productivity, enhanced route efficiency, and stronger service performance across vehicle fleets.
| Market Scope | |
|---|---|
| Start Year | 2025 |
| Forecast Year | 2026-2035 |
| Start Value | $25.9 Billion |
| Forecast Value | $102.6 Billion |
| CAGR | 15.3% |
The managed services segment accounted for 60.6% share in 2025 and is projected to grow at a CAGR of 14.3% through 2035. Automotive enterprises are increasingly selecting managed service models to support continuous system monitoring, cybersecurity management, infrastructure optimization, software governance, and service availability requirements. These solutions help organizations reduce deployment complexity while ensuring reliable cloud performance across global operations. In addition, managed services address ongoing workforce challenges by providing access to specialized expertise in cloud administration, security management, automation, and operational reliability, areas where many automotive organizations continue to face talent shortages despite strong engineering capabilities.
The passenger cars segment reached 73% share in 2025. Market leadership is supported by the substantial installed base of connected passenger vehicles and the increasing integration of cloud-enabled digital services across mass-market vehicle portfolios. Consumer demand for enhanced connectivity, remote vehicle management, digital experiences, infotainment subscriptions, vehicle diagnostics, and intelligent mobility features continues to drive cloud adoption within this segment. Furthermore, increasing electric vehicle adoption creates demand for cloud-based analytics related to battery performance, charging optimization, energy management, driving range estimation, and vehicle efficiency monitoring, further strengthening the passenger vehicle segment's contribution to overall market growth.
North America Automotive Cloud Platform Services and Analytics Market captured 38% share, generating USD 9.9 billion in 2025. The United States represented 86.6% of regional revenue, supported by a well-established ecosystem of cloud technology providers, automotive manufacturers, and fleet management solutions. Strong adoption of connected vehicle technologies, advanced telematics infrastructure, and ongoing investment in digital mobility solutions continue to support regional market expansion. Additionally, regulatory focus on vehicle connectivity, cybersecurity readiness, secure software deployment, and protected data exchange remains an important factor encouraging continued investment in cloud-based automotive technologies throughout the United States.
Major companies operating in the Global Automotive Cloud Platform Services and Analytics Market include Amazon Web Services (AWS), Microsoft, Google, IBM, SAP, Oracle, Salesforce, Continental, Harman International, Alibaba Cloud, Huawei Technologies, Robert Bosch, Ericsson, Aptiv, BlackBerry, NVIDIA, Qualcomm, Verizon Connect, and Geotab. Companies participating in the Automotive Cloud Platform Services and Analytics Market are pursuing a variety of strategic initiatives to strengthen their market position and expand their customer base. A major focus area involves enhancing cloud capabilities through continuous platform innovation, advanced analytics integration, and scalable software management solutions tailored to automotive applications. Businesses are investing heavily in cybersecurity technologies, artificial intelligence, machine learning, and real-time data processing capabilities to deliver greater operational value to automakers and fleet operators. Strategic partnerships, ecosystem collaborations, and technology alliances are also helping companies accelerate solution development and improve interoperability across connected vehicle environments.
Table of Contents
Chapter 1 Methodology & Scope
- 1.1 Research approach
- 1.2 Quality Commitments
- 1.2.1 GMI AI policy & data integrity commitment
- 1.2.1.1 Source consistency protocol
- 1.2.1 GMI AI policy & data integrity commitment
- 1.3 Research Trail & Confidence Scoring
- 1.3.1 Research Trail Components
- 1.3.2 Scoring Components
- 1.4 Data Collection
- 1.4.1 Partial list of primary sources
- 1.5 Data mining sources
- 1.5.1 Paid sources
- 1.5.1.1 Sources, by region
- 1.5.1 Paid sources
- 1.6 Base estimates and calculations
- 1.6.1 Base year calculation
- 1.7 Forecast model
- 1.7.1 Quantified market impact analysis
- 1.7.1.1 Mathematical impact of growth parameters on forecast
- 1.7.1 Quantified market impact analysis
- 1.8 Research transparency addendum
- 1.8.1 Source attribution framework
- 1.8.2 Quality assurance metrics
- 1.8.3 Our commitment to trust
Chapter 2 Executive Summary
- 2.1 Industry 360° synopsis
- 2.2 Key market trends
- 2.2.1 Regional
- 2.2.2 Cloud Service Model
- 2.2.3 Service
- 2.2.4 Deployment Model
- 2.2.5 Vehicle
- 2.2.6 Propulsion
- 2.2.7 Application
- 2.2.8 End use
- 2.3 TAM Analysis, 2026-2035
- 2.4 CXO perspectives: Strategic imperatives
Chapter 3 Industry Insights
- 3.1 Industry ecosystem analysis
- 3.1.1 Supplier landscape
- 3.1.1.1 Raw material suppliers
- 3.1.1.2 Technology suppliers
- 3.1.1.3 OEM
- 3.1.1.4 Service providers
- 3.1.1.5 End Use
- 3.1.2 Cost structure
- 3.1.3 Profit margin
- 3.1.4 Value addition at each stage
- 3.1.5 Vertical integration trends
- 3.1.6 Disruptors
- 3.1.1 Supplier landscape
- 3.2 Industry impact forces
- 3.2.1 Growth drivers
- 3.2.1.1 Rising Adoption of Software-Defined Vehicles (SDVs)
- 3.2.1.2 Growing Demand for Real-Time Vehicle Data Analytics
- 3.2.1.3 Expansion of Connected Mobility & Telematics Ecosystems
- 3.2.1.4 Increasing Integration of AI & Edge Computing in Vehicles
- 3.2.2 Industry pitfalls & challenges
- 3.2.2.1 Rising Cybersecurity & Data Privacy Risks
- 3.2.2.2 High Cloud Infrastructure & Integration Costs
- 3.2.3 Market opportunities
- 3.2.3.1 Shift Toward Cloud-Native Automotive Architectures
- 3.2.3.2 Rising Deployment of OTA Software Update Platforms
- 3.2.3.3 Growing Adoption of Digital Twin & Predictive Analytics Solutions
- 3.2.3.4 Expansion of Generative AI & In-Vehicle Personalization
- 3.2.1 Growth drivers
- 3.3 Growth potential analysis
- 3.4 Pricing Analysis (Driven by Primary Research)
- 3.4.1 Historical Price Trend Analysis
- 3.4.2 Pricing Strategy by Player Type (Premium / Value / Cost-plus)
- 3.5 Regulatory landscape
- 3.5.1 North America
- 3.5.1.1 U.S.: National Highway Traffic Safety Administration (NHTSA)
- 3.5.1.2 U.S.: Vehicle Data Safety Standards (FMVSS)
- 3.5.1.3 Canada: Data Vehicle Safety Regulations ( SOR /2013-198)
- 3.5.2 Europe
- 3.5.2.1 German Road Traffic Data Licensing Regulations
- 3.5.2.2 UK: Ministry of Transport (MOT) Data Security Standard
- 3.5.2.3 EU Vehicle Labeling & Security Regulation
- 3.5.2.4 REACH Compliance & Sustainable Fuel Standards
- 3.5.3 Asia-Pacific
- 3.5.3.1 Japan Low Rolling Resistance Vehicle Certification
- 3.5.3.2 Malaysia: JPJ Puspakom Mandatory Tread Depth
- 3.5.3.3 Australia: Data Defect Management
- 3.5.3.4 China Vehicle Quality Certification Standards
- 3.5.4 Latin America
- 3.5.4.1 Brazil INMETRO Vehicle Cybersecurity Program
- 3.5.4.2 Mexico NOM Vehicle Safety Regulations
- 3.5.5 Middle East & Africa
- 3.5.5.1 GCC Cybersecurity Quality Regulations
- 3.5.5.2 South Africa Vehicle Safety Compliance Standards
- 3.5.1 North America
- 3.6 Technology and Innovation landscape
- 3.6.1 Current technologies
- 3.6.2 Emerging technologies
- 3.7 Porter's analysis
- 3.8 PESTEL analysis
- 3.9 Patent analysis (Driven by Primary Research)
- 3.10 Trade Data Analysis (Based on Paid Database)
- 3.10.1 Import/Export Volume & Value Trends
- 3.10.2 Key Trade Corridors & Tariff Impact
- 3.11 Capacity & Production Landscape (Driven by Primary Research)
- 3.11.1 Production Capacity by Region & Key Producer
- 3.11.2 Capacity Utilization Rates & Expansion Pipelines
- 3.12 Impact of AI & generative AI on the market
- 3.12.1 AI-Driven Disruption of Existing Business Models
- 3.12.2 Automated design optimization
- 3.12.3 Supply chain AI for demand forecasting
- 3.12.4 GenAI use cases & adoption roadmap by segment
- 3.12.5 Risks, Limitations & Regulatory Considerations
- 3.13 Forecast assumptions & scenario analysis (Driven by Primary Research)
- 3.13.1 Base Case - key macro & industry variables driving CAGR
- 3.13.2 Optimistic Scenarios - Favorable Macro and Industry Tailwinds
- 3.13.3 Pessimistic Scenario - Macroeconomic slowdown or industry headwinds
- 3.14 Sustainability and environmental aspects
- 3.14.1 Sustainable practices
- 3.14.2 Waste reduction strategies
- 3.14.3 Energy efficiency in production
- 3.14.4 Eco-friendly Initiatives
- 3.14.5 Carbon footprint considerations
Chapter 4 Competitive Landscape, 2025
- 4.1 Introduction
- 4.2 Company market share analysis
- 4.2.1 North America
- 4.2.2 Europe
- 4.2.3 Asia-Pacific
- 4.2.4 Latin America
- 4.2.5 Middle East & Africa
- 4.3 Competitive positioning matrix
- 4.4 Key developments
- 4.4.1 Mergers & acquisitions
- 4.4.2 Partnerships & collaborations
- 4.4.3 New product launches
- 4.4.4 Expansion plans and funding
- 4.5 Company tier benchmarking
- 4.5.1 Tier classification criteria & qualifying thresholds
- 4.5.2 Tier positioning matrix by revenue, geography & innovation
Chapter 5 Market Estimates & Forecast, By Cloud Service Model, 2022 - 2035 ($Bn)
- 5.1 Key trends
- 5.2 Infrastructure as a Service (IaaS)
- 5.3 Platform as a Service (PaaS)
- 5.4 Software as a Service (SaaS)
Chapter 6 Market Estimates & Forecast, By Service, 2022 - 2035 ($Bn)
- 6.1 Key trends
- 6.2 Professional Services
- 6.2.1 Consulting
- 6.2.2 System Integration
- 6.2.3 Implementation
- 6.2.4 Support & Maintenance
- 6.3 Managed Services
- 6.3.1 Cloud Infrastructure
- 6.3.2 Data Management & Analytics Services
- 6.3.3 Security
- 6.3.4 Network Operations
Chapter 7 Market Estimates & Forecast, By Deployment Model, 2022 - 2035 ($Bn)
- 7.1 Key trends
- 7.2 Public Cloud
- 7.3 Private Cloud
- 7.4 Hybrid Cloud
Chapter 8 Market Estimates & Forecast, By Vehicle, 2022 - 2035 ($Bn)
- 8.1 Key trends
- 8.2 Passenger Cars
- 8.2.1 SUV
- 8.2.2 Sedan
- 8.2.3 Hatchback
- 8.3 Commercial Vehicle
- 8.3.1 Light Commercial Vehicle (LCV)
- 8.3.2 Medium Commercial Vehicle (MCV)
- 8.3.3 Heavy Commercial Vehicle (HCV)
Chapter 9 Market Estimates & Forecast, By Propulsion, 2022 - 2035 ($Bn)
- 9.1 Key trends
- 9.2 ICE Vehicles
- 9.3 Battery Electric Vehicles (BEV)
- 9.4 Plug-in Hybrid Electric Vehicles (PHEV)
- 9.5 Hybrid Electric Vehicles (HEV)
Chapter 10 Market Estimates & Forecast, By Application, 2022 - 2035 ($Bn)
- 10.1 Key trends
- 10.2 Telematics & Connected Vehicle Management
- 10.3 Fleet Management
- 10.4 Over-the-Air (OTA) Updates
- 10.5 Infotainment & In-Cabin Services
- 10.6 Advanced Driver Assistance Systems (ADAS)
- 10.7 Predictive Maintenance & Remote Diagnostics
- 10.8 Usage-Based Insurance (UBI) & Mobility Analytics
- 10.9 Others
Chapter 11 Market Estimates & Forecast, By End use, 2022 - 2035 ($Bn)
- 11.1 Key trends
- 11.2 OEMs (Original Equipment Manufacturers)
- 11.3 Tier 1 Suppliers
- 11.4 Fleet Operators
- 11.5 Aftermarket & Service Providers
Chapter 12 Market Estimates & Forecast, By Region, 2022 - 2035 ($Bn)
- 12.1 North America
- 12.1.1 US
- 12.1.2 Canada
- 12.2 Europe
- 12.2.1 UK
- 12.2.2 Germany
- 12.2.3 France
- 12.2.4 Italy
- 12.2.5 Spain
- 12.2.6 Belgium
- 12.2.7 Netherlands
- 12.2.8 Sweden
- 12.2.9 Russia
- 12.3 Asia Pacific
- 12.3.1 China
- 12.3.2 India
- 12.3.3 Japan
- 12.3.4 Australia
- 12.3.5 Singapore
- 12.3.6 South Korea
- 12.3.7 Vietnam
- 12.3.8 Indonesia
- 12.3.9 Thailand
- 12.4 Latin America
- 12.4.1 Brazil
- 12.4.2 Mexico
- 12.4.3 Argentina
- 12.5 MEA
- 12.5.1 South Africa
- 12.5.2 Saudi Arabia
- 12.5.3 UAE
- 12.5.4 Turkey
Chapter 13 Company Profiles
- 13.1 Global players
- 13.1.1 Amazon Web Services (AWS)
- 13.1.2 Microsoft (Azure Automotive)
- 13.1.3 Google (Google Cloud Automotive)
- 13.1.4 IBM
- 13.1.5 SAP
- 13.1.6 Oracle
- 13.1.7 Salesforce (Automotive Cloud)
- 13.1.8 Continental
- 13.1.9 Harman International (Samsung Electronics)
- 13.2 Regional players
- 13.2.1 Alibaba Cloud (Alibaba)
- 13.2.2 Huawei Technologies (Huawei Cloud)
- 13.2.3 Robert Bosch
- 13.2.4 Ericsson (Automotive Connectivity Cloud)
- 13.2.5 Aptiv
- 13.2.6 BlackBerry Limited (IVY Platform)
- 13.2.7 NVIDIA (Automotive AI Cloud)
- 13.3 Emerging players
- 13.3.1 Qualcomm (Snapdragon Digital Chassis)
- 13.3.2 Automotive Cloud
- 13.3.3 Verizon Connect
- 13.3.4 Geotab

 全球汽車雲端運算市場預測至2034年:按雲端服務模式、計費基礎設施、能源資料類型、連接方式、車輛類型、動力類型、技術、應用、最終用戶和地區分類
 汽車產業 DevOps 服務市場規模、佔有率、成長、全球產業分析、區域洞察及 2026 年至 2034 年預測2026-2034年全球汽車雲數據DevOps和MLOps平台市場規模、佔有率、趨勢和成長分析報告汽車雲端平台市場:預測至 2034 年—按部署模式、服務模式、平台類型、應用程式、車輛類型、最終用戶、雲端功能、連接技術和區域分類的全球分析汽車雲端平台市場:策略性洞察與預測(2026-2031 年)
 汽車雲市場:按車輛類型、部署方式、應用程式和區域分類
 2026年全球汽車雲解決方案市場報告汽車雲洞察:2025-2030 年
 汽車雲市場 - 全球產業規模、佔有率、趨勢、機會及預測(按動力類型、部署方式、車輛類型、應用、地區和競爭格局分類,2021-2031 年)