


 |
市場調查報告書
商品編碼
2083279
有機朗肯迴圈市場:商業機會、成長要素、產業趨勢分析及2026-2035年預測Organic Rankine Cycle (ORC) Market Opportunity, Growth Drivers, Industry Trend Analysis, and Forecast 2026 - 2035 |
||||||

全球有機朗肯迴圈(ORC)市場預計到 2025 年將達到 250 億美元,年複合成長率為 11.3%,到 2035 年將達到 741 億美元。
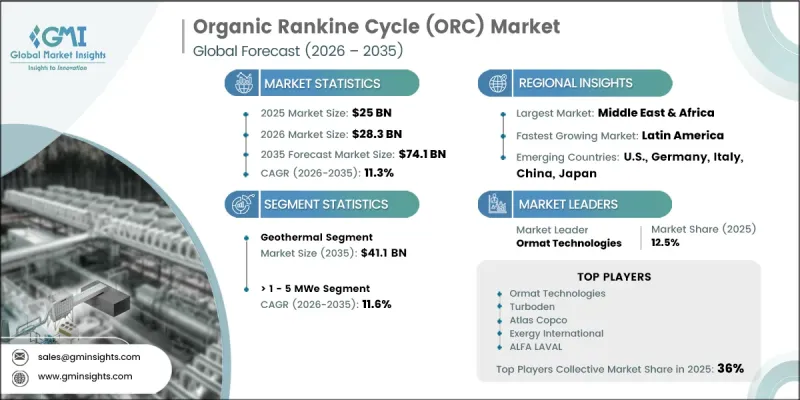
隨著各行各業擴大採用專注於回收未開發熱能的永續能源技術和解決方案,有機朗肯迴圈(ORC)市場正經歷強勁成長。 ORC系統作為一種將低溫熱源轉化為可用電能並同時提高整體能源效率的高效方法,正日益受到重視。人們對減少碳排放和提高資源利用效率的日益關注,推動了ORC系統在各行各業的應用。清潔能源基礎設施投資的增加,以及政府對推廣可再生能源技術的支持,進一步促進了市場擴張。 ORC系統能夠支援環保發電並提高營運效率,因此正成為現代能源策略的關鍵組成部分。系統設計、自動化和數位化監控的持續創新,提高了可靠性和效能,使ORC技術能夠應用於更廣泛的領域。隨著人們對能源最佳化和永續工業營運的日益關注,預計未來幾年全球ORC市場將湧現出巨大的發展機會。
| 市場範圍 | |
|---|---|
| 開始年份 | 2025 |
| 預測期 | 2026-2035 |
| 上市時的市場規模 | 250億美元 |
| 預測金額 | 741億美元 |
| 複合年成長率 | 11.3% |
有機朗肯迴圈(ORC)系統的技術進步透過提高效率、可靠性和成本效益,在推動市場成長方面發揮重要作用。先進的熱交換器設計、低溫ORC配置和改進的工作材料正在拓展這些系統的應用範圍。自動化技術和數位化監控解決方案增強了運作控制,同時減輕了維護負擔。模組化ORC系統的日益普及也促進了市場擴張,因為它們即使在基礎設施有限的地區也能提供易於安裝且高度柔軟性的解決方案。這些進步正推動ORC技術超越其傳統應用,使其更廣泛地整合到新興的分散式能源系統和其他現代發電環境中。
預計到2035年,地熱市場規模將達到411億美元。該市場的成長主要得益於地熱能作為一種可靠的再生能源來源日益普及,以及全球對永續可再生能源發電的關注度不斷提高。地熱資源提供了一種低碳能源選擇,符合國際社會減少環境影響和提高能源永續性的努力。政府項目、財政獎勵、稅收減免和扶持政策也在推動對地熱項目的投資,預計這將進一步擴大對基於有機朗肯循環(ORC)技術的地熱發電解決方案的需求。
預計到2035年,1-5兆瓦以上的有機朗肯循環(ORC)市場將以11.6%的複合年成長率成長。該市場的成長主要得益於中型能源專案對提高效率和利用現有熱資源的需求不斷成長。這些ORC系統在性能和投資要求之間實現了有效平衡,使其成為尋求永續能源解決方案的行業的理想選擇。人們對高效發電技術的日益關注以及小規模可再生能源項目的擴張預計將繼續推動1-5兆瓦以上有機朗肯循環市場的持續成長。
預計到2035年,美國有機朗肯迴圈(ORC)市場規模將達到150億美元。推動美國市場成長的主要因素是:對支持可再生能源發展、提高能源效率和減少排放的技術投資不斷增加。為響應聯邦和州政府推動的永續性目標,各行各業都在部署ORC系統,以提高熱回收能力和整體能源效率。地熱能因其豐富的資源和持續的政策支持,繼續為市場發展做出重大貢獻。對更清潔能源解決方案日益成長的需求預計將進一步推動ORC技術在美國的應用。
目錄
第1章:調查方法和範圍
第2章執行摘要
第3章 行業洞察
- 產業生態系分析
- 原物料供應及採購分析
- 生產能力評估
- 供應鏈韌性與風險因素
- 配電網路分析
- 監理情勢
- 影響產業的因素
- 促進因素
- 產業潛在風險與挑戰
- 成長潛力分析
- 波特的分析
- 供應商的議價能力
- 買方的議價能力
- 新進入者的威脅
- 替代品的威脅
- PESTLE分析
- 價格趨勢分析
- 依輸出類型
- 按地區
- 生產能力和生產情況
- 主要製造商的生產能力
- 運轉率和擴張計劃
- 人工智慧和生成式人工智慧對市場(核心解決方案)的影響
- 人工智慧驅動的生產最佳化(核心解決方案)
- 預測性維護和故障檢測(核心解決方案)
- 新機會與趨勢
- 投資分析及未來展望
- 永續發展措施與工業4.0的融合
第4章 競爭情勢
- 介紹
- 企業市佔率分析:按地區分類
- 北美洲
- 歐洲
- 亞太地區
- 中東和非洲
- 拉丁美洲
- 主要進展
- 主要夥伴關係和聯盟
- 併購主要趨勢
- 產品創新和新產品發布
- 市場擴大策略
- 競爭定位矩陣
第5章 市場規模及預測:依應用領域分類,2022-2035年
- 廢熱回收
- 生質能
- 地熱
- 太陽熱能
- 石油和天然氣
- 垃圾焚化發電
第6章 市場規模及預測:依產量分類,2022-2035年
- 1兆瓦或更少
- >1~5 MWe
- >5~10 MWe
- >10 MWe
第7章 市場規模及預測:依地區分類,2022-2035年
- 北美洲
- 美國
- 加拿大
- 墨西哥
- 歐洲
- 英國
- 法國
- 德國
- 義大利
- 俄羅斯
- 西班牙
- 亞太地區
- 中國
- 澳洲
- 印度
- 日本
- 韓國
- 中東和非洲
- 沙烏地阿拉伯
- UAE
- 土耳其
- 南非
- 埃及
- 拉丁美洲
- 巴西
- 阿根廷
第8章:公司簡介
- ABB
- Alfa Laval
- Atlas Copco
- Calnetix Technologies
- Elvosolar
- Enertime
- Enorgia
- Exergy International
- General Electric
- Intec GMK
- Kaishan USA
- Mitsubishi Heavy Industries
- Orchan Energy
- Ormat Technologies
- Triogen
- Turboden
The Global Organic Rankine Cycle (ORC) Market was valued at USD 25 billion in 2025 and is estimated to grow at a CAGR of 11.3% to reach USD 74.1 billion by 2035.
The market is experiencing strong growth as industries increasingly adopt sustainable energy technologies and solutions focused on recovering unused heat resources. Organic Rankine Cycle systems are gaining importance as an efficient method for converting low-temperature heat sources into usable electricity while improving overall energy efficiency. The growing emphasis on reducing carbon emissions and improving resource utilization is encouraging adoption across multiple industries. Increasing investments in clean energy infrastructure, combined with supportive government initiatives promoting renewable technologies, are further contributing to market expansion. ORC systems are becoming an important component of modern energy strategies due to their ability to support environmentally responsible power generation and improve operational efficiency. Continuous innovation in system design, automation, and digital monitoring is enhancing reliability and performance, making ORC technology more accessible across a wider range of applications. The rising focus on energy optimization and sustainable industrial operations is expected to create significant opportunities for the global ORC market over the coming years.
| Market Scope | |
|---|---|
| Start Year | 2025 |
| Forecast Year | 2026-2035 |
| Start Value | $25 Billion |
| Forecast Value | $74.1 Billion |
| CAGR | 11.3% |
Technological improvements in organic rankine cycle systems are playing a major role in strengthening market growth by improving efficiency, reliability, and cost-effectiveness. Developments in advanced heat exchanger designs, low-temperature ORC configurations, and improved working materials are expanding the range of applications for these systems. Automation technologies and digital monitoring solutions are enhancing operational control while reducing maintenance requirements. The increasing adoption of modular ORC systems is also supporting market expansion because these solutions offer easier installation and greater flexibility for locations with limited infrastructure. These advancements are helping ORC technology move beyond traditional applications and supporting its integration into emerging distributed energy systems and other modern power generation environments.
The geothermal segment is projected to reach USD 41.1 billion by 2035. Growth within this segment is supported by the increasing adoption of geothermal energy as a reliable renewable power source and the rising global focus on sustainable electricity generation. Geothermal resources provide a low-carbon energy option that aligns with international efforts to reduce environmental impact and improve energy sustainability. Government programs, financial incentives, tax benefits, and supportive policies are also encouraging investments in geothermal projects, which is expected to drive greater demand for ORC-based geothermal power generation solutions.
The >1-5 MWe segment is anticipated to register a CAGR of 11.6% throughout 2035. Expansion of this segment is driven by rising demand from medium-scale energy projects focused on improving efficiency and utilizing available heat resources. These ORC systems provide an effective balance between performance and investment requirements, making them suitable for industries seeking sustainable energy solutions. Growing interest in efficient power generation technologies and the increasing adoption of smaller-scale renewable energy projects are expected to support continued growth of the >1-5 MWe category.
U.S. Organic Rankine Cycle (ORC) Market is expected to reach USD 15 billion by 2035. Market growth in the country is being supported by increasing investments in renewable energy development, energy efficiency improvements, and technologies that support reduced emissions. Various industries are adopting ORC systems to improve heat recovery capabilities and enhance overall energy utilization in line with sustainability objectives supported by federal and state initiatives. Geothermal energy continues to contribute significantly to market development due to resource availability and ongoing policy support. The increasing demand for cleaner power generation solutions is expected to further strengthen the adoption of ORC technology across the U.S.
Major companies operating in the Global Organic Rankine Cycle (ORC) Market include Turboden, ABB, Exergy International, Mitsubishi Heavy Industries, Ormat Technologies, Alfa Laval, Atlas Copco, General Electric, Calnetix Technologies, Triogen, Enertime, Kaishan USA, Elvosolar, Enogia, Intec GMK, and Orchan Energy. Companies operating in the organic rankine cycle (ORC) market are implementing multiple strategies to improve their competitive position and expand their market presence. Businesses are focusing on research and development activities to improve system efficiency, reduce costs, and develop advanced ORC solutions for different energy applications. Strategic partnerships, technology collaborations, and project-based agreements are helping companies strengthen their industry reach and enhance solution capabilities. Market participants are also investing in modular system development, digital monitoring technologies, and customized solutions to meet changing customer requirements.
Table of Contents
Chapter 1 Methodology & Scope
- 1.1 Research approach
- 1.2 Quality commitments
- 1.2.1 GMI AI policy & data integrity commitment
- 1.2.1.1 Source consistency protocol
- 1.2.1 GMI AI policy & data integrity commitment
- 1.3 Research trail & confidence scoring
- 1.3.1 Research trail components
- 1.3.2 Scoring components
- 1.4 Data collection
- 1.4.1 Partial list of primary sources
- 1.5 Data mining sources
- 1.5.1 Paid sources
- 1.5.1.1 Sources, by region
- 1.5.1 Paid sources
- 1.6 Base estimates and calculations
- 1.6.1 Base year calculation for any one approach
- 1.7 Market estimates & forecasts parameters
- 1.8 Forecast model
- 1.8.1 Quantified market impact analysis
- 1.8.1.1 Mathematical impact of growth parameters on forecast
- 1.8.1 Quantified market impact analysis
- 1.9 Research transparency addendum
- 1.9.1 Source attribution framework
- 1.9.2 Quality assurance metrics
- 1.9.3 Our commitment to trust
- 1.10 Market definitions
Chapter 2 Executive Summary
- 2.1 Industry synopsis, 2022 - 2035
- 2.1.1 Business trends
- 2.1.2 Application trends
- 2.1.3 Power output trends
- 2.1.4 Regional trends
Chapter 3 Industry Insights
- 3.1 Industry ecosystem analysis
- 3.1.1 Raw material availability & sourcing analysis
- 3.1.2 Manufacturing capacity assessment
- 3.1.3 Supply chain resilience & risk factors
- 3.1.4 Distribution network analysis
- 3.2 Regulatory landscape
- 3.3 Industry impact forces
- 3.3.1 Growth drivers
- 3.3.2 Industry pitfalls & challenges
- 3.4 Growth potential analysis
- 3.5 Porter's analysis
- 3.5.1 Bargaining power of suppliers
- 3.5.2 Bargaining power of buyers
- 3.5.3 Threat of new entrants
- 3.5.4 Threat of substitutes
- 3.6 PESTEL analysis
- 3.6.1 Political factors
- 3.6.2 Economic factors
- 3.6.3 Social factors
- 3.6.4 Technological factors
- 3.6.5 Legal factors
- 3.6.6 Environmental factors
- 3.7 Price trend analysis (USD/MW)
- 3.7.1 By power output
- 3.7.2 By region
- 3.8 Capacity & production landscape (Driven by Primary Research)
- 3.8.1 Capacity by key producer (Driven by Primary Research)
- 3.8.2 Capacity utilization rates & expansion pipelines (Driven by Primary Research)
- 3.9 Impact of AI & Generative AI on the market (Core Solution)
- 3.9.1 AI-Driven production optimization (Core Solution)
- 3.9.2 Predictive maintenance & fault detection (Core Solution)
- 3.10 Emerging opportunities & trends
- 3.11 Investment analysis & future prospects
- 3.12 Sustainability initiatives & industry 4.0 integration
Chapter 4 Competitive Landscape, 2026
- 4.1 Introduction
- 4.2 Company market share analysis, by region, 2025
- 4.2.1 North America
- 4.2.2 Europe
- 4.2.3 Asia Pacific
- 4.2.4 Middle East & Africa
- 4.2.5 Latin America
- 4.3 Key developments
- 4.3.1 Key partnerships & collaborations
- 4.3.2 Major M&A activities
- 4.3.3 Product innovations & launches
- 4.3.4 Market expansion strategies
- 4.4 Competitive positioning matrix
Chapter 5 Market Size and Forecast, By Application, 2022 - 2035 (USD Million & MW)
- 5.1 Key trends
- 5.2 Waste Heat Recovery
- 5.3 Biomass
- 5.4 Geothermal
- 5.5 Solar Thermal
- 5.6 Oil & Gas
- 5.7 Waste to Energy
Chapter 6 Market Size and Forecast, By Power Output, 2022 - 2035 (USD Million & MW)
- 6.1 Key trends
- 6.2 ≤ 1 MWe
- 6.3 > 1 - 5 MWe
- 6.4 > 5 - 10 MWe
- 6.5 > 10 MWe
Chapter 7 Market Size and Forecast, By Region, 2022 - 2035 (USD Million & MW)
- 7.1 Key trends
- 7.2 North America
- 7.2.1 U.S.
- 7.2.2 Canada
- 7.2.3 Mexico
- 7.3 Europe
- 7.3.1 UK
- 7.3.2 France
- 7.3.3 Germany
- 7.3.4 Italy
- 7.3.5 Russia
- 7.3.6 Spain
- 7.4 Asia Pacific
- 7.4.1 China
- 7.4.2 Australia
- 7.4.3 India
- 7.4.4 Japan
- 7.4.5 South Korea
- 7.5 Middle East & Africa
- 7.5.1 Saudi Arabia
- 7.5.2 UAE
- 7.5.3 Turkey
- 7.5.4 South Africa
- 7.5.5 Egypt
- 7.6 Latin America
- 7.6.1 Brazil
- 7.6.2 Argentina
Chapter 8 Company Profiles
- 8.1 ABB
- 8.2 Alfa Laval
- 8.3 Atlas Copco
- 8.4 Calnetix Technologies
- 8.5 Elvosolar
- 8.6 Enertime
- 8.7 Enorgia
- 8.8 Exergy International
- 8.9 General Electric
- 8.10 Intec GMK
- 8.11 Kaishan USA
- 8.12 Mitsubishi Heavy Industries
- 8.13 Orchan Energy
- 8.14 Ormat Technologies
- 8.15 Triogen
- 8.16 Turboden

 有機朗肯迴圈市場-2026-2032年全球市場預測
 有機朗肯迴圈(ORC)市場預測至2034年:按循環類型、渦輪機類型、熱源、容量範圍、應用、最終用戶和地區分類的全球分析
 2026年全球有機朗肯迴圈市場報告2026年全球有機朗肯迴圈(ORC)廢熱發電市場報告
 全球有機朗肯迴圈市場規模、佔有率、趨勢和成長分析報告(2026-2034)有機朗肯循環市場規模、佔有率、成長、全球產業分析:依類型、應用、區域洞察與預測(2026-2034 年)
 有機朗肯迴圈市場規模、佔有率和趨勢分析報告:按應用、地區和細分市場預測(2026-2033 年)
 有機朗肯迴圈市場規模、佔有率和成長分析(按組件、發電方式、熱源、應用、終端用戶產業和地區分類)-2026-2033年產業預測2032 年有機朗肯迴圈市場預測:按工作流體、系統類型、容量、應用、最終用戶和地區進行的全球分析
 有機朗肯循環市場,按應用、按容量、按最終用戶、按國家和地區 - 2025 年至 2032 年全球行業分析、市場規模、市場佔有率和預測