


 |
市場調查報告書
商品編碼
2083126
聯網汽車金融科技市場機會、成長要素、產業趨勢分析及2026-2035年預測Connected Vehicle Fintech Market Opportunity, Growth Drivers, Industry Trend Analysis, and Forecast 2026 - 2035 |
||||||

全球聯網汽車和金融科技市場預計到 2025 年將達到 51 億美元,年複合成長率為 10.6%,到 2035 年將達到 138 億美元。
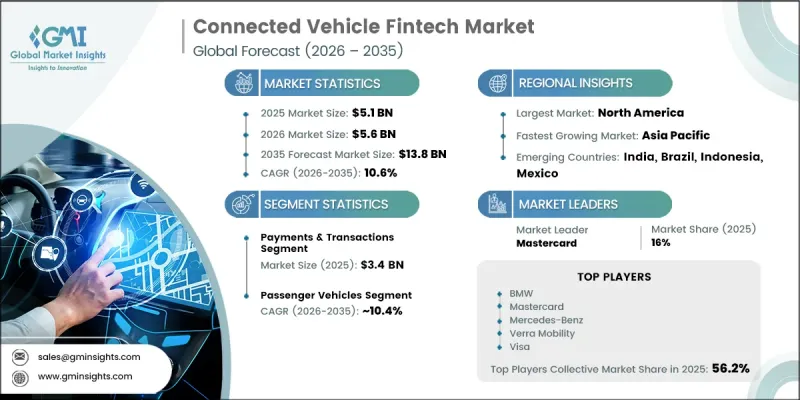
這一成長的驅動力來自全球聯網汽車生態系統的加速部署、以軟體為中心的汽車平臺的日益普及以及數位金融服務與汽車環境的融合。隨著車輛互聯程度的提高,它們正從單純的交通工具演變為能夠支持各種金融交易的全天候數位平台。這種轉變為支付服務提供者、保險公司、旅遊運營商、車隊管理公司和汽車製造商創造了新的機會。同時,汽車製造商正積極拓展收入來源,透過擴展軟體驅動型服務和訂閱式經營模式來抵消車輛電氣化和先進技術方面不斷成長的投資。消費者需求也朝著在用車過程中自然發生的無縫、自動化購物體驗轉變,這進一步提升了聯網汽車金融科技解決方案的商業性潛力,並推動了全球汽車和金融生態系統的長期市場成長。
| 市場範圍 | |
|---|---|
| 開始年份 | 2025 |
| 預測期 | 2026-2035 |
| 上市時的市場規模 | 51億美元 |
| 預計金額 | 138億美元 |
| 複合年成長率 | 10.6% |
累計到2025年,支付與交易業務板塊的收入將達到34億美元,佔市場佔有率的66.6%,並預計在2035年之前以10.5%的複合年成長率成長。該板塊的成長主要得益於各類汽車服務中嵌入式支付功能的日益普及以及全球聯網汽車滲透率的持續提升。預計在整個預測期內,交易活動的增加以及車載整合金融服務的日益普及將進一步推動產生收入。
預計到2025年,乘用車市場規模將達到38億美元,並預計在2035年之前以10.4%的複合年成長率成長。其主導地位主要歸功於全球乘用車市場規模龐大(超過13億輛),以及新型車型中互聯技術的日益普及。互聯技術在乘用車中的持續應用,為金融科技應用創造了有利環境,顯著推動了該細分市場的成長。
預計到2025年,美國聯網汽車和金融科技市場規模將達到18億美元。新車銷售中嵌入式連網技術的高滲透率,為車載金融服務的普及奠定了堅實的基礎。憑藉完善的互聯基礎設施,以及消費者對汽車相關數位化交易日益成長的接受度,美國正不斷鞏固其作為聯網汽車和金融科技行業主要成長中心的地位。
目錄
第1章:調查方法
第2章執行摘要
第3章 行業洞察
- 產業生態系分析
- 供應商情況
- 利潤率
- 成本結構
- 每個階段增加的價值
- 影響價值鏈的因素
- 中斷
- 影響產業的因素
- 促進因素
- 聯網汽車的快速普及和物聯網的滲透
- 消費者對流暢便捷的支付體驗的需求
- 專注於透過OEM實現經常性收入和訂閱模式。
- 整合式充電支付系統對於加速電動車的普及至關重要。
- 產業潛在風險與挑戰
- 支付方式分散且缺乏互通性標準
- 與傳統支付基礎設施和緩慢的支付處理時間相關的特點
- 市場機遇
- 隨著車輛互聯技術的普及,進軍新興市場
- 面向商用車輛車隊管理的金融科技解決方案
- 原始設備製造商與金融機構合作的機會
- 促進因素
- 技術與創新展望
- 最新科技趨勢
- 車載支付終端(內建讀卡機)
- 行動錢包整合
- 利用遠端資訊處理技術的交易系統
- 新興技術
- 基於區塊鏈的支付和結算
- 電動車充電錢包整合
- 車聯網(V2X)支付生態系統
- 最新科技趨勢
- 成長潛力分析
- 監理情勢
- 北美洲
- 美國 - NHTSA(國家公路交通安全管理局)
- 美國 - CFPB(消費者金融保護局)
- 歐洲
- 歐盟-歐洲資料保護委員會/國家資料保護機構(歐洲資料保護委員會和國家資料保護機構)
- 歐盟-歐洲證券及市場管理局(ESMA)
- 亞太地區
- 中國工信部
- 印度 - 印度儲備銀行(RBI)
- LATAM
- 巴西 - BCB(巴西中央銀行)
- 墨西哥 - CNBV(Comision Nacional Bancaria y de Valores)
- 中東和非洲
- 阿拉伯聯合大公國-DFSA/ADGM(杜拜金融服務管理局)
- 沙烏地阿拉伯 - SAMA(沙烏地阿拉伯中央銀行)
- 北美洲
- 波特的分析
- PESTLE分析
- 專利分析
- 人工智慧和生成式人工智慧對市場的影響
- 利用人工智慧改造現有經營模式
- 按細分市場分類的生成式人工智慧用例和部署藍圖
- 風險、限制和監管考量
- 網路安全與功能安全分析
- 支付安全標準(PCI DSS、令牌化)
- 車輛認證和授權協議
- 資料加密和隱私保護
- 網路安全威脅的整體情況
- 與自動駕駛和ADAS生態系統的整合
- 調整自動駕駛車隊的付款計劃
- 叫車與無人駕駛計程車服務的金融整合
- 車聯網(V2X)支付基礎設施
- 預測假設和情境分析
- 基本案例:驅動複合年成長率的關鍵宏觀經濟與產業變量
- 樂觀情境:宏觀經濟與產業的順風
- 悲觀情景:宏觀經濟放緩或產業逆風
第4章 競爭情勢
- 介紹
- 企業市佔率分析
- 北美洲
- 歐洲
- 亞太地區
- LATAM
- 中東和非洲
- 主要市場公司的競爭分析
- 競爭定位矩陣
- 主要進展
- 併購
- 夥伴關係和聯盟
- 新產品發布
- 業務拓展計劃及資金籌措
- 按公司規模進行基準測試
- 排名分類標準與遴選標準
- 按銷售額、地區和創新能力分類的層級定位矩陣。
第5章 市場估計與預測:依解法分類,2022-2035年
- 支付和交易
- 保險和風險服務
- 融資和租賃
- 行動金融科技平台
第6章 市場估價與預測:依車輛類型分類,2022-2035年
- 搭乘用車
- 掀背車
- 轎車
- SUV
- 商用車輛
- 輕型商用車
- 中型商用車
- 大型商用車輛
- 摩托車
第7章 市場估計與預測:依應用領域分類,2022-2035年
- 車內支付
- 充電和加油
- 通行費和停車費
- 車內商務
- 其他
- 交通行動服務(MaaS)
- 汽車所有權和資金籌措
- 車輛營運和生命週期服務
第8章 市場估算與預測:依最終用途分類,2022-2035年
- OEMs
- 商用車輛
- 行動服務供應商
- 一般消費者
- 其他
第9章 市場估計與預測:依地區分類,2022-2035年
- 北美洲
- 美國
- 加拿大
- 歐洲
- 德國
- 英國
- 法國
- 義大利
- 西班牙
- 波蘭
- 挪威
- 荷蘭
- 亞太地區
- 中國
- 印度
- 日本
- 澳洲
- 印尼
- 韓國
- 泰國
- 越南
- 拉丁美洲
- 巴西
- 墨西哥
- 阿根廷
- 中東和非洲
- 南非
- 沙烏地阿拉伯
- UAE
第10章:公司簡介
- 世界公司
- Mastercard
- Visa
- Mercedes-Benz
- PayPal
- Hyundai Motor
- BMW
- Parkopedia
- Cerence AI
- Aisin
- 本地公司
- Verra Mobility
- ryd
- CarPay-Diem
- PACE Telematics
- Cubic3
- 新興企業
- Sheeva.AI
- Car IQ
- Aiden Automotive
- Pairpoint
The Global Connected Vehicle Fintech Market was valued at USD 5.1 billion in 2025 and is estimated to grow at a CAGR of 10.6% to reach USD 13.8 billion by 2035.
Growth is fueled by the accelerating deployment of connected vehicle ecosystems worldwide, increasing adoption of software-centric vehicle platforms, and the growing integration of digital financial services within automotive environments. As vehicles become increasingly connected, they are evolving beyond traditional transportation assets into continuously connected digital platforms capable of supporting a wide range of financial interactions. This transformation is creating new opportunities for payment providers, insurers, mobility operators, fleet managers, and automotive manufacturers. At the same time, automakers are actively diversifying revenue streams by expanding software-enabled services and subscription-based business models to offset mounting investments in vehicle electrification and advanced technologies. Consumer demand is also shifting toward seamless and automated purchasing experiences that occur naturally during vehicle usage, further strengthening the commercial potential of connected vehicle fintech solutions and supporting long-term market growth across global automotive and financial ecosystems.
| Market Scope | |
|---|---|
| Start Year | 2025 |
| Forecast Year | 2026-2035 |
| Start Value | $5.1 Billion |
| Forecast Value | $13.8 Billion |
| CAGR | 10.6% |
The payments and transactions segment generated USD 3.4 billion in 2025, representing 66.6% share, and is anticipated to grow at a CAGR of 10.5% through 2035. Segment growth is being supported by the wider implementation of embedded payment capabilities across various vehicle-related services and the continuous expansion of connected vehicle penetration worldwide. Increasing transaction activity and broader adoption of integrated financial services within vehicles are expected to further strengthen revenue generation throughout the forecast period.
The passenger vehicles segment reached USD 3.8 billion in 2025. The segment is forecast to grow at a CAGR of 10.4% through 2035. Its leadership position is largely attributed to the immense size of the global passenger vehicle fleet, which exceeds 1.3 billion units, along with rising connectivity adoption across new vehicle models. Growing integration of connected technologies in passenger cars continues to create favorable conditions for fintech applications, contributing significantly to segment growth.
U.S. Connected Vehicle Fintech Market generated USD 1.8 billion in 2025. High penetration of embedded connectivity technologies in newly sold vehicles has established a strong foundation for the adoption of vehicle-based financial services. The widespread availability of connected infrastructure, combined with growing consumer acceptance of digital automotive transactions, continues to position the United States as a key growth center for the connected-vehicle fintech industry.
Key participants operating in the global connected vehicle fintech market include Mastercard, Visa, Verra Mobility, Mercedes-Benz, BMW Group, Hyundai Motor, and PayPal. Companies operating in the connected vehicle fintech market are focusing on strategic initiatives designed to strengthen their competitive positions and expand market reach. Many industry participants are investing heavily in connected mobility platforms, digital payment integration, and software-driven vehicle ecosystems to enhance customer engagement and generate recurring revenue streams. Strategic partnerships between automotive manufacturers, payment technology providers, financial institutions, and mobility service companies are becoming increasingly common as organizations seek to accelerate innovation and improve service delivery. Companies are also prioritizing investments in cybersecurity, data protection, and secure transaction capabilities to build consumer trust and support regulatory compliance.
Table of Contents
Chapter 1 Methodology
- 1.1 Research approach
- 1.2 Quality Commitments
- 1.2.1 GMI AI policy & data integrity commitment
- 1.3 Research Trail & Confidence Scoring
- 1.3.1 Research Trail Components
- 1.3.2 Scoring Components
- 1.4 Data Collection
- 1.5 Data mining sources
- 1.5.1 Paid sources
- 1.6 Base estimates and calculations
- 1.6.1 Base year calculation
- 1.7 Forecast model
- 1.7.1 Quantified market impact analysis
- 1.8 Research transparency addendum
- 1.8.1 Source attribution framework
- 1.8.2 Quality assurance metrics
- 1.8.3 Our commitment to trust
Chapter 2 Executive Summary
- 2.1 Industry 360° synopsis
- 2.2 Key market trends
- 2.2.1 Regional
- 2.2.2 Solution
- 2.2.3 Vehicle
- 2.2.4 Application
- 2.2.5 End-Use
- 2.3 TAM analysis, 2026-2035
- 2.4 CXO perspectives: Strategic imperatives
Chapter 3 Industry Insights
- 3.1 Industry ecosystem analysis
- 3.1.1 Supplier landscape
- 3.1.2 Profit margin
- 3.1.3 Cost structure
- 3.1.4 Value addition at each stage
- 3.1.5 Factor affecting the value chain
- 3.1.6 Disruptions
- 3.2 Industry impact forces
- 3.2.1 Growth drivers
- 3.2.1.1 Rapid Growth in Connected Vehicle Adoption & IoT Penetration
- 3.2.1.2 Consumer Demand for Seamless, Frictionless Payment Experiences
- 3.2.1.3 OEM Focus on Recurring Revenue & Subscription Models
- 3.2.1.4 Acceleration of EV Adoption Requiring Integrated Charging Payments
- 3.2.2 Industry pitfalls and challenges
- 3.2.2.1 Payment Fragmentation & Lack of Interoperability Standards
- 3.2.2.2 Legacy Payment Infrastructure & Slow Settlement Times Capabilities
- 3.2.3 Market opportunities
- 3.2.3.1 Expansion into Emerging Markets with Growing Vehicle Connectivity
- 3.2.3.2 Fleet Management Fintech Solutions for Commercial Vehicles
- 3.2.3.3 Partnership Opportunities Between OEMs & Financial Institutions
- 3.2.1 Growth drivers
- 3.3 Technology and innovation landscape
- 3.3.1 Current technological trends
- 3.3.1.1 In-vehicle payment terminals (embedded card readers)
- 3.3.1.2 Mobile wallet integration
- 3.3.1.3 Telematics-based transaction systems
- 3.3.2 Emerging technologies
- 3.3.2.1 Blockchain-based payment and settlement
- 3.3.2.2 EV charging wallet integration
- 3.3.2.3 Vehicle-to-everything (V2X) payment ecosystems
- 3.3.1 Current technological trends
- 3.4 Growth potential analysis
- 3.5 Regulatory landscape
- 3.5.1 North America
- 3.5.1.1 US - NHTSA (National Highway Traffic Safety Administration)
- 3.5.1.2 US - CFPB (Consumer Financial Protection Bureau)
- 3.5.2 Europe
- 3.5.2.1 EU - EDPB / National DPAs (European Data Protection Board & Data Protection Authorities)
- 3.5.2.2 EU - ESMA (European Securities and Markets Authority)
- 3.5.3 Asia Pacific
- 3.5.3.1 China - MIIT (Ministry of Industry and Information Technology)
- 3.5.3.2 India - RBI (Reserve Bank of India)
- 3.5.4 LATAM
- 3.5.4.1 Brazil - BCB (Banco Central do Brasil)
- 3.5.4.2 Mexico - CNBV (Comision Nacional Bancaria y de Valores)
- 3.5.5 MEA
- 3.5.5.1 UAE - DFSA / ADGM (Dubai Financial Services Authority)
- 3.5.5.2 Saudi Arabia - SAMA (Saudi Central Bank)
- 3.5.1 North America
- 3.6 Porter’s analysis
- 3.7 PESTEL analysis
- 3.8 Patent analysis (Driven by Primary Research)
- 3.9 Impact of AI & generative AI on the market
- 3.9.1 AI-driven disruption of existing business models
- 3.9.2 GenAI use cases & adoption roadmap by segment
- 3.9.3 Risks, limitations & regulatory considerations
- 3.10 Cybersecurity & Functional Safety Analysis
- 3.10.1 Payment Security Standards (PCI DSS, Tokenization)
- 3.10.2 Vehicle Authentication & Authorization Protocols
- 3.10.3 Data Encryption & Privacy Protection
- 3.10.4 Cybersecurity Threat Landscape
- 3.11 Integration with Autonomous & ADAS Ecosystem
- 3.11.1 Autonomous Fleet Payment Orchestration
- 3.11.2 Ride-Hailing & Robotaxi Financial Integration
- 3.11.3 Vehicle-to-Everything (V2X) Payment Infrastructure
- 3.12 Forecast assumptions & scenario analysis (Driven by Primary Research)
- 3.12.1 Base Case- Key Macro & Industry Variables Driving CAGR
- 3.12.2 Optimistic Scenarios- Favorable macro and industry tailwinds
- 3.12.3 Pessimistic Scenario - Macroeconomic slowdown or industry headwinds
Chapter 4 Competitive Landscape, 2025
- 4.1 Introduction
- 4.2 Company market share analysis
- 4.2.1 North America
- 4.2.2 Europe
- 4.2.3 Asia Pacific
- 4.2.4 LATAM
- 4.2.5 MEA
- 4.3 Competitive analysis of major market players
- 4.4 Competitive positioning matrix
- 4.5 Key developments
- 4.5.1 Mergers & acquisitions
- 4.5.2 Partnerships & collaborations
- 4.5.3 New product launches
- 4.5.4 Expansion plans and funding
- 4.6 Company tier benchmarking
- 4.6.1 Tier classification criteria & qualifying thresholds
- 4.6.2 Tier positioning matrix by revenue, geography & innovation
Chapter 5 Market Estimates and Forecast, By Solution, 2022 - 2035 ($ Mn)
- 5.1 Key trends
- 5.2 Payments & Transactions
- 5.3 Insurance & Risk Services
- 5.4 Lending & Leasing
- 5.5 Mobility & Fintech Platforms
Chapter 6 Market Estimates and Forecast, By Vehicle, 2022 - 2035 ($ Mn)
- 6.1 Key trends
- 6.2 Passenger Vehicles
- 6.2.1 Hatchback
- 6.2.2 Sedan
- 6.2.3 SUV
- 6.3 Commercial Vehicles
- 6.3.1 Light Commercial Vehicles
- 6.3.2 Medium Commercial Vehicles
- 6.3.3 Heavy Commercial Vehicles
- 6.4 Two Wheelers
Chapter 7 Market Estimates and Forecast, By Application, 2022 - 2035 ($ Mn)
- 7.1 Key trends
- 7.2 In-Vehicle Payment
- 7.2.1 Charging & Refueling
- 7.2.2 Tolls & Parking
- 7.2.3 In-car commerce
- 7.2.4 Other
- 7.3 Mobility-as-a-Service (MaaS)
- 7.4 Vehicle Ownership & Financing
- 7.5 Vehicle Operations & Lifecycle Services
Chapter 8 Market Estimates and Forecast, By End-Use, 2022 - 2035 ($ Mn)
- 8.1 Key trends
- 8.2 OEMs
- 8.3 Commercial Fleets
- 8.4 Mobility Service Providers
- 8.5 Retail Consumers
- 8.6 Others
Chapter 9 Market Estimates & Forecast, By Region, 2022 - 2035 ($Mn)
- 9.1 Key trends
- 9.2 North America
- 9.2.1 US
- 9.2.2 Canada
- 9.3 Europe
- 9.3.1 Germany
- 9.3.2 UK
- 9.3.3 France
- 9.3.4 Italy
- 9.3.5 Spain
- 9.3.6 Poland
- 9.3.7 Norway
- 9.3.8 Netherlands
- 9.4 Asia Pacific
- 9.4.1 China
- 9.4.2 India
- 9.4.3 Japan
- 9.4.4 Australia
- 9.4.5 Indonesia
- 9.4.6 South Korea
- 9.4.7 Thailand
- 9.4.8 Vietnam
- 9.5 Latin America
- 9.5.1 Brazil
- 9.5.2 Mexico
- 9.5.3 Argentina
- 9.6 MEA
- 9.6.1 South Africa
- 9.6.2 Saudi Arabia
- 9.6.3 UAE
Chapter 10 Company Profiles
- 10.1 Global players
- 10.1.1 Mastercard
- 10.1.2 Visa
- 10.1.3 Mercedes-Benz
- 10.1.4 PayPal
- 10.1.5 Hyundai Motor
- 10.1.6 BMW
- 10.1.7 Parkopedia
- 10.1.8 Cerence AI
- 10.1.9 Aisin
- 10.2 Regional players
- 10.2.1 Verra Mobility
- 10.2.2 ryd
- 10.2.3 CarPay-Diem
- 10.2.4 PACE Telematics
- 10.2.5 Cubic3
- 10.3 Emerging players
- 10.3.1 Sheeva.AI
- 10.3.2 Car IQ
- 10.3.3 Aiden Automotive
- 10.3.4 Pairpoint

 港口營運情報市場預測至2034年-按營運部門、資料來源、情報功能、港口資產、最終用戶和區域分類的全球分析
 全球自動駕駛汽車市場規模、佔有率、趨勢和成長分析報告(2026-2034)
 自動駕駛汽車ECU市場規模、佔有率和成長分析:按ECU類型、車輛類型、自動化程度、銷售管道、最終用戶和地區分類-2026-2033年產業預測自動駕駛汽車晶片市場規模、佔有率、成長、全球產業分析、區域趨勢及2026-2034年預測。
 自動駕駛汽車市場-2026-2032年全球市場預測2034年自動駕駛汽車市場預測:按自動駕駛等級、車輛類型、感測器類型、推進方式、應用、最終用戶和地區分類的全球分析自動駕駛汽車市場:2026-2032年全球市場預測(按自動駕駛等級、車輛類型、組件、技術、動力系統、最終用戶和應用分類)
 自動駕駛汽車市場分析及至2035年的預測:類型、產品、服務、技術、組件、應用、部署、最終用戶、功能、解決方案自動駕駛汽車市場分析及至2035年的預測:類型、產品類型、服務、技術、組件、應用、部署狀態、最終用戶、功能
 自動駕駛汽車:市場佔有率分析、產業趨勢與統計、成長預測(2025-2030 年)