


 |
市場調查報告書
商品編碼
2097360
自動駕駛汽車:市場佔有率分析、產業趨勢與統計、成長預測(2025-2030 年)Autonomous Vehicle - Market Share Analysis, Industry Trends & Statistics, Growth Forecasts (2025 - 2030) |
||||||

※ 本網頁內容可能與最新版本有所差異。詳細情況請與我們聯繫。
據 Mordor Intelligence 稱,2025 年自動駕駛汽車市場價值 2,314.7 億美元,預計到 2030 年將達到 7,477.3 億美元。
預計從 2025 年到 2030 年,其複合年成長率將達到 26.43%。
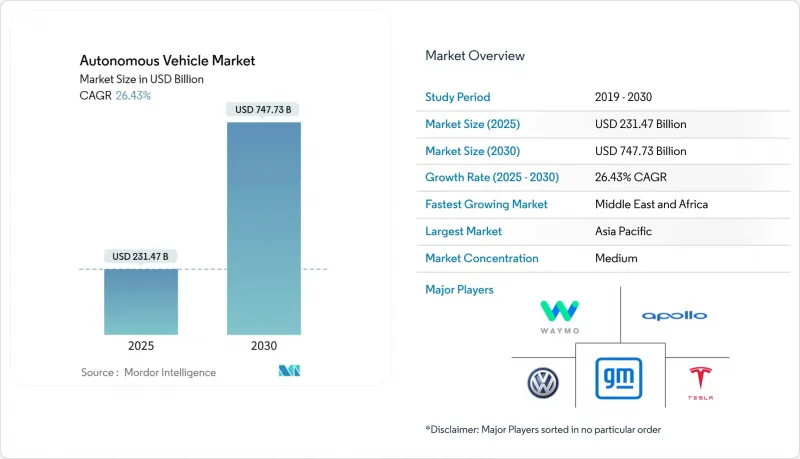
本報告按自動化等級(1級:駕駛輔助,2級:部分自動化等)、車輛類型(乘用車和商用車)、動力系統(內燃機等)、出行方式(私家車和共享出行)、零件(硬體等)以及地區進行細分。市場預測以美元計價。
全球自動駕駛汽車市場趨勢及洞察
歐盟和中國政府關於安全法規(主要是ADAS)的強制規定。
兩地嚴格的ADAS安全法規迫使自動駕駛汽車產業加快軟體檢驗週期,使供應商能夠更早獲利。歐盟委員會的跨境測試平台計畫以及中國多個城市發放的無人駕駛計程車許可證,有效地為供應商提供了清晰的核准流程藍圖,預計將在2025年推動研發投入的成長。因此,一個顯著的變化是,主要開發人員正在拆分其程式碼庫以滿足特定地區的要求,導致功能集重疊但不完全相同。這種拆分將悄悄增加軟體總量,進而影響維修成本和人員需求。
亞洲特大城市自動駕駛計程車示範計畫迅速擴張
在武漢和上海等城市,無人駕駛計程車的票價如今已低於傳統的叫車服務。這一趨勢表明,即使在所有地區完全取消駕駛人之前,自動駕駛共享出行方式也可能優於人工駕駛的出行方式。這種成本差異主要得益於基於車庫的車輛管理以及在離峰時段減少車輛閒置時間,而這些措施是傳統計程車難以複製的。值得注意的是,在自動駕駛汽車的早期討論中經常被忽視的低收入通勤者,正因票價降低而成為目標客戶,這可能導致公眾對自動駕駛汽車的接受度比預期更快地提高。
美國各州自動駕駛汽車法規的差異正在減緩其商業推廣速度。
由於29個州各自製定了自動駕駛法規,在多個州運營的服務供應商必須維護不同的報告、駕駛員監控和保險系統,這導致營運成本增加,從而限制了自動駕駛汽車在短期內所能獲得的市場佔有率。有證據表明,一些開發商目前將服務部署路線限制在法規較為寬鬆的地區,無意中忽略了一些高需求的貨運路線。由此可見,缺乏統一的框架可能間接導致投資轉向模擬而非實地測試,從而延長開發週期。
細分市場分析
2024年,L1級(駕駛輔助)功能佔自動駕駛汽車市場佔有率的45.21%,但預計到2030年,L5級(完全自動駕駛)將以27.23%的複合年成長率成長,這意味著隨著自動化程度的提高,兩者之間的差距將迅速縮小。有關條件性和高級自動化功能的法規細化促使供應商著手認證冗餘的轉向和煞車子系統,從而立即提升了硬體收入。此外,保險公司修訂費率表,將某些駕駛模式下的責任轉移給製造商,這也產生了微妙的影響,這意味著未來終端用戶的保險費可能會降低。
豪華車買家對L3級自動駕駛的興趣日益濃厚,這降低了每輛車的研發成本攤銷,間接為L4級自動駕駛汽車的研發提供了資金。例如,配備「個人駕駛輔助系統(L3級)」的BMW7系列車型表明,早期用戶願意支付更高的價格,而利潤也有助於抵消持續的地圖繪製成本。此外,從L3級車輛收集的駕駛輔助模式資料正被用於L4級自動駕駛測試中使用的機器學習模型,從而縮短了各細分市場的資料收集週期。
到2024年,乘用車將佔據自動駕駛汽車市場78.92%的佔有率。然而,許多汽車製造商現在不再將自動駕駛視為一次性的硬體升級,而是將其視為持續軟體訂閱的契機,從而將經營模式轉向長期收入來源。空中下載(OTA)更新延長了功能的生命週期,使用戶能夠在生命週期中期獲得新增功能,從而有可能提高平均擁有率。隨著越來越多的家庭訂閱部分自動駕駛服務,售後市場供應商對傳統導航硬體的需求可能會下降,這預示著配件市場格局的重組。
預計到2030年,商用車市場將以25.72%的複合年成長率成長,隨著物流和貨運領域自動駕駛技術的加速應用,其市場規模擴張速度可望超過乘用車。由於人手不足和法定駕駛時間限制,自動駕駛正成為車隊營運商,尤其是長途運輸營運商,更具經濟吸引力的選擇。一個意想不到的附帶效應是,車輛維修站正在投資機器人維護工具,以適應卡車自動駕駛技術的應用,從而實現整個維修站運作的現代化。
區域分析
2024年,亞太地區以46.52%的市佔率領先全球自動駕駛汽車市場。這主要得益於中國多個城市大規模部署無人駕駛計程車以及5G基礎設施的廣泛發展。政府各部門的協調支援簡化了測試、保險和網路安全等核准流程,顯著縮短了專案週期。一個新趨勢是直接在二線城市引入自動駕駛班車,無需升級傳統公共交通系統,這表明自動駕駛汽車的市場滲透範圍已擴展到主要都市區以外。同時,日本和新加坡等國家正在利用聯盟主導的模式,結合學術界和自動駕駛行業的專業知識,在預算有限的情況下高效地擴大研發規模。
中東和非洲是成長最快的地區,預計2025年至2030年的複合年成長率將達到28.11%。尤其值得一提的是,阿拉伯聯合大公國(阿拉伯聯合大公國)已將自動駕駛汽車置於其國家智慧城市目標的核心位置,而杜拜的目標是到2030年實現25%的交通運輸實現自動駕駛。該地區擁有專用的自動駕駛車道基礎設施,使其在自動駕駛系統方面比那些事後才添加到傳統城市結構中的系統更具優勢。另一個意想不到的優勢是,該地區陽光充足的沙漠氣候能夠提供高精度的感測器數據,加速視覺系統的檢驗。
北美雖然在自動駕駛汽車市場佔有率上不如亞洲,但憑藉其強大的資本市場和技術叢集,仍然是至關重要的地區。聯邦政府對5G-V2X走廊的津貼以及蓬勃發展的新創企業正在推動創新,但各州之間監管政策的差異正在減緩全國範圍內的推廣。大規模共享出行平台的存在意味著,一旦相關法規明確,商業部署即可立即實現。一個根本性的轉變是,以卡車運輸為主的各州在通用準則方面日益趨於一致,這預示著一條自下而上、最終形成事實上的國家標準的路徑。
其他好處:
- Excel格式的市場預測(ME)表
- 3個月的分析師支持
目錄
第1章:引言
- 研究假設和市場定義
- 調查範圍
第2章:調查方法
第3章執行摘要
第4章 市場狀況
- 市場概覽
- 市場促進因素
- 歐盟和中國政府關於安全法規(主要是ADAS)的強制規定。
- 亞洲特大城市自動駕駛計程車示範計畫迅速擴張
- 雷射雷達和人工智慧運算成本的降低使得L3技術得以大規模市場部署。
- 用於實現車載邊緣人工智慧的低功耗汽車SoC
- 在北美貨運網路中部署 5G-V2X 走廊
- 歐洲的車輛脫碳目標正在加速自動駕駛中程物流的發展。
- 市場限制因素
- 美國各州自動駕駛汽車法規的差異正在減緩其商業化的擴張。
- 中國發生的自動駕駛計程車事故引起了公眾的關注,加劇了大眾對自動駕駛計程車的不信任感。
- 汽車人工智慧晶片供不應求以及晶圓廠產能受限
- 新興市場高精度地圖的維修成本
- 價值供應鏈分析
- 監理展望
- 技術展望
- 波特五力模型
第5章 市場規模與成長預測
- 按自動化級別
- 一級 - 駕駛輔助
- 二級 - 部分自動化
- 第三級 - 條件自動化
- 4級 - 高級自動化
- 5級 - 全自動
- 車輛類型
- 搭乘用車
- 商用車輛
- 依推進類型
- 內燃機(ICE)
- 電池式電動車(BEV)
- 混合動力電動車(HEV)
- 依行程類型
- 個人所有
- 共乘(無人駕駛計程車、接駁車)
- 按組件
- 硬體
- 感測器(LiDAR、雷達、攝影機、超音波、慣性測量單元)
- 運算平台(SoC、GPU)
- 執行器和控制系統
- 軟體
- 感知與規劃套件
- 地圖和定位引擎
- 駕駛員監控和人機介面
- 服務
- 整合與檢驗
- 遠端控制和遙操作
- 硬體
- 地區
- 北美洲
- 美國
- 加拿大
- 其他北美國家
- 南美洲
- 巴西
- 阿根廷
- 其他南美國家
- 歐洲
- 德國
- 法國
- 英國
- 義大利
- 西班牙
- 其他歐洲國家
- 亞太地區
- 中國
- 日本
- 韓國
- 印度
- 其他亞太國家
- 中東和非洲
- 南非
- 埃及
- 阿拉伯聯合大公國
- 沙烏地阿拉伯
- 土耳其
- 其他中東和非洲國家
- 北美洲
第6章 競爭情勢
- 市場集中度
- 策略趨勢
- 市佔率分析
- 公司簡介
- Waymo LLC
- Tesla, Inc.
- General Motors Co.(Cruise LLC)
- Baidu Inc.(Apollo)
- Toyota Motor Corporation
- Volkswagen AG
- Mercedes-Benz Group AG
- BMW AG
- Nissan Motor Co. Ltd.
- Volvo Car AB
- Hyundai Motor Group
- BYD Company Ltd.
- Pony.ai Inc.
- AutoX Inc.
- Uber Technologies Inc.
- Aptiv PLC
- Mobileye Global Inc.
- NVIDIA Corporation
- Magna International Inc.
- Continental AG
第7章 市場機會與未來展望
According to Mordor Intelligence, the autonomous vehicle market size is valued at USD 231.47 billion in 2025 and is projected to reach USD 747.73 billion by 2030, expanding at a compound annual growth rate (CAGR) of 26.43% during 2025-2030.
This report is Segmented by Level of Automation (Level 1 - Driver Assistance, Level 2 - Partial Automation, and More), Vehicle Type (Passenger Cars and Commercial Vehicles), Propulsion Type (Internal Combustion Engine and More), Mobility Form (Personal Ownership and Shared Mobility), Component (Hardware and More), and Geography. The Market Forecasts are Provided in Terms of Value (USD).
Global Autonomous Vehicle Market Trends and Insights
Government Mandates for ADAS-Centric Safety Regulations in the EU and China
Stringent ADAS safety rules in both regions are pushing the autonomous car industry to accelerate software validation cycles, which in turn drives earlier supplier revenue. The European Commission's cross-border testbed program and China's multi-city robo taxi permits are effectively giving vendors clear roadmaps for approval gates, encouraging higher R&D outlays in 2025. An observable consequence is that leading developers are partitioning their codebases to meet region-specific requirements, creating overlapping but not identical feature sets. This segregation subtly increases total software volume, which later influences maintenance costs and talent needs.
Rapid Expansion of Robo Taxi Pilots Across Asian Megacities
Robo taxi fares in cities like Wuhan and Shanghai are now lower than those of traditional ride-hailing services. This trend underscores the potential of autonomous shared mobility to outpace human-driven alternatives, even prior to the complete removal of drivers in all districts. The cost gap is mainly achieved through depot-style fleet management and lower off-peak idle time, an approach that is difficult for traditional taxis to replicate. A notable inference is that lower-income commuters, often overlooked in early AV narratives, are becoming target customers due to these cheaper fares, potentially widening public acceptance faster than anticipated.
Patchwork State-Level AV Regulations in the United States Delay Commercial Scale
With 29 states legislating unique autonomous rules, multi-state service providers must maintain varied reporting, driver-monitoring, and insurance structures, inflating overhead and thereby limiting the autonomous vehicles market share they can capture quickly. Evidence shows that some developers now pick launch corridors strictly within permissive clusters, which unintentionally sidelines certain high-demand freight lanes. An emerging takeaway is that the lack of a unified framework indirectly channels investment toward simulation rather than on-road testing, potentially stretching development timelines.
Other drivers and restraints analyzed in the detailed report include:
- Falling LiDAR and AI Compute Costs Are Unlocking Mass-Market Level 3 Launches
- Power-Efficient Automotive SoCs Enabling In-Vehicle Edge AI
- Public Mistrust Intensified by High-Profile Robo Taxi Incidents in China
For complete list of drivers and restraints, kindly check the Table Of Contents.
Segment Analysis
Level 1 (Driver Assistance) features held 45.21% of the autonomous vehicle market share in 2024, but Level 5 (Full Automation) is projected to grow at a 27.23% CAGR through 2030, meaning higher automation will narrow the gap quickly. Legislative clarity for conditional and high-automation functions encourages suppliers to certify redundant steering and braking subsystems, raising immediate hardware revenue. A subtle effect is that insurers are revising actuarial tables to shift liability to manufacturers for specific modes, hinting at future premium reductions for end users.
Growing interest in Level 3 from luxury buyers brings down development amortization per unit, indirectly funding Level 4 autonomous car research. Models such as the BMW 7-Series with Personal Pilot Level 3 illustrate that early adopters pay premium prices, a margin that helps offset ongoing mapping costs. Additionally, pilot-mode data harvested from Level 3 vehicles is feeding machine-learning models used in Level 4 trucks, shortening data-collection loops across segments.
Passenger cars commanded 78.92% of the autonomous vehicle market share during 2024. Yet, many OEMs now view autonomy as a recurring software subscription opportunity rather than a one-time hardware upgrade, shifting the business model toward long-term revenue streams. Over-the-air updates extend feature life cycles, which could lengthen average ownership as buyers anticipate new capabilities mid-cycle. As more households subscribe to partial autonomy, aftermarket suppliers may see declining demand for traditional navigation hardware, suggesting a reshaping of accessory markets.
Commercial vehicles are projected to grow at a 25.72% CAGR through 2030, outpacing passenger cars in market size expansion as autonomy adoption accelerates in logistics and freight segments. Labor shortages and mandated driving-hour limits make autonomy economically compelling for fleet operators, especially in long-haul corridors. An unexpected by-product is that depots invest in robotic maintenance tools to match truck autonomy, thereby modernizing entire yard operations.
Complete Report Scope:
- By Level of Automation
- Level 1- Driver Assistance
- Level 2 - Partial Automation
- Level 3 - Conditional Automation
- Level 4 - High Automation
- Level 5 - Full Automation
- By Vehicle Type
- Passenger Cars
- Commercial Vehicles
- By Propulsion Type
- Internal Combustion Engine (ICE)
- Battery Electric Vehicles (BEV)
- Hybrid Electric Vehicles (HEV)
- By Mobility Form
- Personal Ownership
- Shared Mobility (Robo-Taxi, Shuttle)
- By Component
- Hardware
- Sensors (LiDAR, RADAR, Cameras, Ultrasonic, IMU)
- Computing Platforms (SoCs, GPUs)
- Actuators and Control Systems
- Software
- Perception and Planning Suites
- Mapping and Localization Engines
- Driver Monitoring and HMI
- Services
- Integration and Validation
- Remote Operation and Tele-operation
- Hardware
- Geography
- North America
- United States
- Canada
- Rest of North America
- South America
- Brazil
- Argentina
- Rest of South America
- Europe
- Germany
- France
- United Kingdom
- Italy
- Spain
- Rest of Europe
- Asia-Pacific
- China
- Japan
- South Korea
- India
- Rest of Asia-Pacific
- Middle East and Africa
- South Africa
- Egypt
- United Arab Emirates
- Saudi Arabia
- Turkey
- Rest of Middle East and Africa
- North America
Geography Analysis
Asia-Pacific led the autonomous vehicle market in 2024 with a 46.52% share, driven largely by China's expansive multi-city robo taxi deployments and widespread 5G infrastructure. Coordinated government support across ministries enables streamlined testing, insurance, and cybersecurity approvals, significantly reducing project timelines. An emerging trend is that second-tier cities are bypassing traditional public transport upgrades by adopting autonomous shuttles directly, signaling market diffusion beyond major urban hubs. Meanwhile, countries like Japan and Singapore leverage consortium-led models combining academic and autonomous industry expertise, allowing efficient R&D scaling despite smaller budgets.
The Middle East and Africa are the fastest-growing regions, projected to grow at a 28.11% CAGR from 2025 to 2030. National strategies, particularly in the United Arab Emirates, place autonomous vehicles at the heart of smart-city goals, with Dubai aiming for 25% of all trips to be autonomous by 2030. Purpose-built infrastructure with autonomous vehicle lanes gives the region an edge over retrofitted systems in legacy urban layouts. A surprising benefit is that the region's clear-weather desert conditions deliver high-fidelity sensor data, accelerating vision system validation.
North America remains pivotal because of its deep capital markets and technology clusters, despite holding a smaller autonomous vehicle market share than Asia. Federal grants for 5G-V2X corridors and a vibrant startup pipeline sustain innovation momentum, even as fragmented state rules slow nationwide scaling. The presence of large ride-hailing platforms offers immediate commercial distribution once regulatory clarity emerges. An underlying shift is that trucking-focused states are coalescing around common guidelines, hinting at a bottom-up path to de facto national standards.
- Waymo LLC
- Tesla, Inc.
- General Motors Co. (Cruise LLC)
- Baidu Inc. (Apollo)
- Toyota Motor Corporation
- Volkswagen AG
- Mercedes-Benz Group AG
- BMW AG
- Nissan Motor Co. Ltd.
- Volvo Car AB
- Hyundai Motor Group
- BYD Company Ltd.
- Pony.ai Inc.
- AutoX Inc.
- Uber Technologies Inc.
- Aptiv PLC
- Mobileye Global Inc.
- NVIDIA Corporation
- Magna International Inc.
- Continental AG
Additional Benefits:
- The market estimate (ME) sheet in Excel format
- 3 months of analyst support
TABLE OF CONTENTS
1 Introduction
- 1.1 Study Assumptions & Market Definition
- 1.2 Scope of the Study
2 Research Methodology
3 Executive Summary
4 Market Landscape
- 4.1 Market Overview
- 4.2 Market Drivers
- 4.2.1 Government Mandates for ADAS-Centric Safety Regulations in EU and China
- 4.2.2 Rapid Expansion of Robo-Taxi Pilots across Asian Mega-Cities
- 4.2.3 Falling LiDAR and AI Compute Costs Unlocking Mass-Market L3 Launches
- 4.2.4 Power-Efficient Automotive SoCs Enabling In-Vehicle Edge AI
- 4.2.5 5G-V2X Corridor Roll-outs in North American Freight Networks
- 4.2.6 Fleet Decarbonization Targets Accelerating Autonomous Middle-Mile Logistics in Europe
- 4.3 Market Restraints
- 4.3.1 Patchwork State-Level AV Regulations in the United States Delay Commercial Scale
- 4.3.2 Public Mistrust Intensified by High-Profile Robo Taxi Incidents in China
- 4.3.3 Automotive-Grade AI Chip Shortages and Fab Capacity Constraints
- 4.3.4 High-Definition Map Maintenance Costs in Emerging Markets
- 4.4 Value / Supply-Chain Analysis
- 4.5 Regulatory Outlook
- 4.6 Technological Outlook
- 4.7 Porter's Five Forces
- 4.7.1 Threat of New Entrants
- 4.7.2 Bargaining Power of Buyers
- 4.7.3 Bargaining Power of Suppliers
- 4.7.4 Threat of Substitutes
- 4.7.5 Intensity of Competitive Rivalry
5 Market Size & Growth Forecasts (Value and Volume)
- 5.1 By Level of Automation
- 5.1.1 Level 1- Driver Assistance
- 5.1.2 Level 2 - Partial Automation
- 5.1.3 Level 3 - Conditional Automation
- 5.1.4 Level 4 - High Automation
- 5.1.5 Level 5 - Full Automation
- 5.2 By Vehicle Type
- 5.2.1 Passenger Cars
- 5.2.2 Commercial Vehicles
- 5.3 By Propulsion Type
- 5.3.1 Internal Combustion Engine (ICE)
- 5.3.2 Battery Electric Vehicles (BEV)
- 5.3.3 Hybrid Electric Vehicles (HEV)
- 5.4 By Mobility Form
- 5.4.1 Personal Ownership
- 5.4.2 Shared Mobility (Robo-Taxi, Shuttle)
- 5.5 By Component
- 5.5.1 Hardware
- 5.5.1.1 Sensors (LiDAR, RADAR, Cameras, Ultrasonic, IMU)
- 5.5.1.2 Computing Platforms (SoCs, GPUs)
- 5.5.1.3 Actuators and Control Systems
- 5.5.2 Software
- 5.5.2.1 Perception and Planning Suites
- 5.5.2.2 Mapping and Localization Engines
- 5.5.2.3 Driver Monitoring and HMI
- 5.5.3 Services
- 5.5.3.1 Integration and Validation
- 5.5.3.2 Remote Operation and Tele-operation
- 5.5.1 Hardware
- 5.6 Geography
- 5.6.1 North America
- 5.6.1.1 United States
- 5.6.1.2 Canada
- 5.6.1.3 Rest of North America
- 5.6.2 South America
- 5.6.2.1 Brazil
- 5.6.2.2 Argentina
- 5.6.2.3 Rest of South America
- 5.6.3 Europe
- 5.6.3.1 Germany
- 5.6.3.2 France
- 5.6.3.3 United Kingdom
- 5.6.3.4 Italy
- 5.6.3.5 Spain
- 5.6.3.6 Rest of Europe
- 5.6.4 Asia-Pacific
- 5.6.4.1 China
- 5.6.4.2 Japan
- 5.6.4.3 South Korea
- 5.6.4.4 India
- 5.6.4.5 Rest of Asia-Pacific
- 5.6.5 Middle East and Africa
- 5.6.5.1 South Africa
- 5.6.5.2 Egypt
- 5.6.5.3 United Arab Emirates
- 5.6.5.4 Saudi Arabia
- 5.6.5.5 Turkey
- 5.6.5.6 Rest of Middle East and Africa
- 5.6.1 North America
6 Competitive Landscape
- 6.1 Market Concentration
- 6.2 Strategic Moves
- 6.3 Market Share Analysis
- 6.4 Company Profiles (Includes Global Level Overview, Market Level Overview, Core Segments, Financials as Available, Strategic Information, Market Rank/Share for Key Companies, Products and Services, SWOT Analysis, and Recent Developments)
- 6.4.1 Waymo LLC
- 6.4.2 Tesla, Inc.
- 6.4.3 General Motors Co. (Cruise LLC)
- 6.4.4 Baidu Inc. (Apollo)
- 6.4.5 Toyota Motor Corporation
- 6.4.6 Volkswagen AG
- 6.4.7 Mercedes-Benz Group AG
- 6.4.8 BMW AG
- 6.4.9 Nissan Motor Co. Ltd.
- 6.4.10 Volvo Car AB
- 6.4.11 Hyundai Motor Group
- 6.4.12 BYD Company Ltd.
- 6.4.13 Pony.ai Inc.
- 6.4.14 AutoX Inc.
- 6.4.15 Uber Technologies Inc.
- 6.4.16 Aptiv PLC
- 6.4.17 Mobileye Global Inc.
- 6.4.18 NVIDIA Corporation
- 6.4.19 Magna International Inc.
- 6.4.20 Continental AG
7 Market Opportunities & Future Outlook
- 7.1 White-Space & Unmet-Need Assessment

 2026年全球自動駕駛汽車晶片市場報告
 港口營運情報市場預測至2034年-按營運部門、資料來源、情報功能、港口資產、最終用戶和區域分類的全球分析
 全球自動駕駛汽車市場規模、佔有率、趨勢和成長分析報告(2026-2034)
 自動駕駛汽車ECU市場規模、佔有率和成長分析:按ECU類型、車輛類型、自動化程度、銷售管道、最終用戶和地區分類-2026-2033年產業預測自動駕駛汽車晶片市場規模、佔有率、成長、全球產業分析、區域趨勢及2026-2034年預測。
 自動駕駛汽車市場-2026-2032年全球市場預測2034年自動駕駛汽車市場預測:按自動駕駛等級、車輛類型、感測器類型、推進方式、應用、最終用戶和地區分類的全球分析自動駕駛汽車市場:2026-2032年全球市場預測(按自動駕駛等級、車輛類型、組件、技術、動力系統、最終用戶和應用分類)
 自動駕駛汽車市場分析及至2035年的預測:類型、產品、服務、技術、組件、應用、部署、最終用戶、功能、解決方案自動駕駛汽車市場分析及至2035年的預測:類型、產品類型、服務、技術、組件、應用、部署狀態、最終用戶、功能