


 |
市場調查報告書
商品編碼
2083099
軍用輔助電源系統市場機會、成長要素、產業趨勢分析及2026-2035年預測Military Auxiliary Power Unit Market Opportunity, Growth Drivers, Industry Trend Analysis, and Forecast 2026 - 2035 |
||||||

2025年全球軍用輔助動力裝置市場規模預計為19億美元,預計2035年將以4.7%的複合年成長率成長至31億美元。
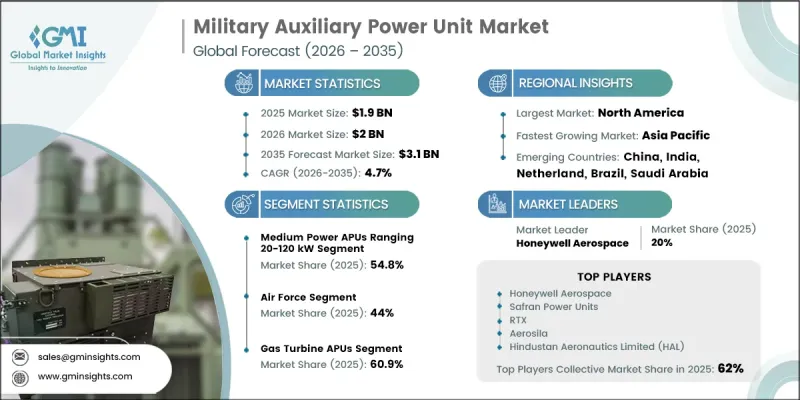
軍用輔助動力裝置 (APU) 在支援飛機運作方面發揮著至關重要的作用,它無需依賴外部地面支援系統即可提供電力、氣壓和機械動力。這些系統增強了各種軍用航空平台的作戰柔軟性和任務準備。市場涵蓋燃氣渦輪機APU、柴油和內燃機 APU、電動裝置、混合動力配置以及專為國防應用開發的新興燃料電池技術。全球國防費用的成長,以及軍用飛機採購計畫和集群現代化舉措的支持,持續為市場擴張創造有利條件。隨著各國軍隊以技術先進的飛機取代老舊平台,對更有效率、高性能輔助動力系統的需求不斷成長。日益加劇的地緣政治不確定性和提高運轉率的需求,也推動了對輔助動力基礎設施的維護、升級和現代化項目的投資。這些因素正在推動先進 APU 技術的應用,以支援提高作戰效率、增強飛機性能,並實現全球軍用航空群的長期防禦態勢目標。
| 市場範圍 | |
|---|---|
| 開始年份 | 2025 |
| 預測期 | 2026-2035 |
| 初始市場規模 | 19億美元 |
| 預計金額 | 31億美元 |
| 複合年成長率 | 4.7% |
功率範圍在20千瓦至120千瓦之間的中功率輔助動力裝置(APU)預計在2025年將佔據54.8%的市場佔有率。該細分市場服務多種軍用飛機,並持續受益於眾多航空應用領域的成熟需求。由於市場成熟和現有技術的不斷發展,該類別的市場成長保持穩定。目前,燃氣渦輪機系統在該功率範圍內仍佔據主導地位,但隨著軍用飛機運營商尋求更高的效率和運行柔軟性,對電動和混合動力替代技術的興趣日益濃厚,這正推動著市場的逐步多元化。
預計到2025年,燃氣渦輪機輔助動力裝置(APU)市佔率將達到60.9%。其廣泛應用得益於多年的運行可靠性、高功率密度以及在惡劣環境條件下高效運行的能力。這些系統旨在提供電氣、氣壓和液壓支持,並在各種動作溫度和海拔高度下保持穩定的性能。其久經考驗的性能使其成為眾多軍用航空應用領域的首選技術。
預計到2025年,北美軍用輔助動力裝置(APU)市佔率將達到36.6%。該市場以成熟的國防航空領域為特徵,投資主要集中在機隊維護、現代化舉措和技術升級方面,而非大規模飛機擴充。持續重視維持作戰準備狀態和提昇平台性能預計將支撐全部區域對先進輔助動力系統的需求。
目錄
第1章:調查方法和範圍
第2章執行摘要
第3章 行業洞察
- 產業生態系分析
- 供應商情況
- 利潤率
- 成本結構
- 每個階段增加的價值
- 影響價值鏈的因素
- 中斷
- 影響產業的因素
- 促進因素
- 全球國防費用增加
- 擴大軍用飛機機隊
- 增加輔助動力裝置的維護與升級
- 燃油效率更高的輔助動力裝置(APU)技術進展
- 擴大軍用無人機的使用
- 產業潛在風險與挑戰
- 開發和整合先進的軍用級輔助動力裝置(APU)成本高昂。
- 供應鏈中斷與地緣政治貿易限制
- 市場機遇
- 對混合動力和純電動軍用飛機的需求日益成長
- 新興國家擴大國內國防製造計劃
- 促進因素
- 成長潛力分析
- 價格分析
- 對過去價格趨勢的分析
- 依球員類型分類的定價策略(高級球員、超值球員、成本加成球員)
- 監理情勢
- 北美洲
- 歐洲
- 亞太地區
- 拉丁美洲
- 中東和非洲
- 波特的分析
- PESTLE分析
- 技術與創新展望
- 最新科技趨勢
- 新興技術
- 新興經營模式
- 合規要求
- 專利和智慧財產權分析
- 貿易數據分析
- 進出口量及進口額趨勢
- 主要貿易路線及關稅的影響
- 人工智慧和生成式人工智慧對市場的影響
- 利用人工智慧改造現有經營模式
- 按細分市場分類的生成式人工智慧用例和部署藍圖
- 生產能力和生產情況
- 主要製造商的生產能力
- 運轉率和擴張計劃
第4章 競爭情勢
- 介紹
- 企業市佔率分析
- 按地區
- 北美洲
- 歐洲
- 亞太地區
- 拉丁美洲
- 中東和非洲
- 市場集中度分析
- 按地區
- 主要市場公司的競爭分析
- 競爭定位矩陣
- 主要進展
- 併購
- 夥伴關係和聯盟
- 新產品發布
- 業務拓展計劃及資金籌措
- 按公司規模進行基準測試
- 排名分類標準與遴選標準
- 按銷售額、地區和創新能力分類的層級定位矩陣。
第5章 市場估算與預測:依輔助動力裝置(APU)技術類型分類,2022-2035年
- 燃氣渦輪機(APU)
- 柴油/內燃機輔助動力裝置
- 電動輔助動力裝置
- 混合APU
- 燃料電池輔助動力裝置(APU)
第6章 市場估計與預測:依平台類型分類,2022-2035年
- 載人固定翼飛機
- 載人旋翼機
- 地面作戰和戰術車輛
- 水面艦艇和潛水艇
- 無人系統(UAS/UGV)
第7章 市場估算與預測:額定功率,2022-2035年
- 低功率(小於20千瓦)
- 中功率(20千瓦至120千瓦)
- 高功率(>120千瓦)
第8章 市場估算與預測:依最終使用者分類,2022-2035年
- 空軍
- 軍隊
- 海軍和海軍陸戰隊
第9章 市場估計與預測:依地區分類,2022-2035年
- 北美洲
- 美國
- 加拿大
- 歐洲
- 德國
- 英國
- 法國
- 西班牙
- 義大利
- 亞太地區
- 中國
- 印度
- 日本
- 澳洲
- 韓國
- 拉丁美洲
- 巴西
- 墨西哥
- 阿根廷
- 中東和非洲
- 南非
- 沙烏地阿拉伯
- UAE
第10章:公司簡介
- 全球主要公司
- Honeywell Aerospace
- Safran Power Units
- RTX
- Aerosila
- Hindustan Aeronautics Limited(HAL)
- 該地區的主要公司
- 北美洲
- The Marvin Group/Marvin Land Systems
- Dewey Electronics Corporation
- Aegis Power Systems
- 亞太地區
- Motor Sich
- UAV Turbines, Inc.
- 歐洲
- Liebherr-Aerospace
- PBS Group
- Suter Industries
- Fischer Panda GmbH
- 北美洲
- 小眾玩家/顛覆者
- Suter Industries
The Global Military Auxiliary Power Unit Market was valued at USD 1.9 billion in 2025 and is estimated to grow at a CAGR of 4.7% to reach USD 3.1 billion by 2035.
Military auxiliary power units play a critical role in supporting aircraft operations by supplying electrical, pneumatic, and mechanical power independently of external ground-based support systems. These systems enhance operational flexibility and mission readiness across a wide range of military aviation platforms. The market includes gas turbine APUs, diesel and internal combustion APUs, electric-powered units, hybrid configurations, and emerging fuel-cell-based technologies developed for defense applications. Growing defense expenditures worldwide continue to create favorable conditions for market expansion, supported by aircraft procurement programs and fleet modernization initiatives undertaken by military organizations. As armed forces replace aging platforms with technologically advanced aircraft, demand for more efficient and capable auxiliary power systems continues to rise. Increasing geopolitical uncertainty and the need for higher fleet availability are also driving investments in maintenance, upgrade, and modernization programs focused on auxiliary power infrastructure. These factors are encouraging the adoption of advanced APU technologies that improve operational efficiency, enhance aircraft performance, and support long-term defense readiness objectives across global military aviation fleets.
| Market Scope | |
|---|---|
| Start Year | 2025 |
| Forecast Year | 2026-2035 |
| Start Value | $1.9 Billion |
| Forecast Value | $3.1 Billion |
| CAGR | 4.7% |
The medium-power APUs with output capacities ranging from 20 kW to 120 kW segment held a 54.8% share in 2025. This segment serves a broad range of military aircraft categories and continues to benefit from established demand across numerous aviation applications. Market growth within this category remains stable due to its maturity and the ongoing evolution of existing technologies. Gas turbine systems currently maintain a strong presence in this power range, although increasing interest in electric and hybrid alternatives is contributing to gradual diversification as military operators seek improved efficiency and operational flexibility.
The gas turbine APUs segment held a 60.9% share in 2025. Their widespread adoption is supported by a long history of operational reliability, high power density, and the ability to perform effectively under demanding environmental conditions. These systems are designed to deliver electrical, pneumatic, and hydraulic support functions while maintaining consistent performance across a broad range of operating temperatures and altitude conditions. Their proven capability continues to make them the preferred technology for many military aviation applications.
North America Military Auxiliary Power Unit Market accounted for 36.6% share in 2025. The market is characterized by a mature defense aviation environment where investments are primarily focused on fleet sustainment, modernization initiatives, and technology upgrades rather than large-scale fleet expansion. Continued emphasis on maintaining operational readiness and improving platform performance is expected to support ongoing demand for advanced auxiliary power systems throughout the region.
Key companies operating in the Global Military Auxiliary Power Unit Market include Honeywell Aerospace, Safran Power Units, RTX, PBS Group, Aerosila, The Marvin Group / Marvin Land Systems, Motor Sich, Dewey Electronics Corporation, Suter Industries, Aegis Power Systems, Falck Schmidt Defence Systems, Liebherr-Aerospace, Hindustan Aeronautics Limited (HAL), UAV Turbines, Inc., and Fischer Panda GmbH. Companies active in the Military Auxiliary Power Unit Market are pursuing several strategic initiatives to strengthen their market position and expand their competitive advantage. Product innovation remains a primary focus, with manufacturers investing in advanced technologies that improve fuel efficiency, reduce weight, enhance reliability, and support next-generation military aircraft requirements. Many companies are increasing research and development spending to advance electric, hybrid, and alternative power solutions while maintaining high-performance operational capabilities.
Table of Contents
Chapter 1 Methodology and Scope
- 1.1 Market scope and definition
- 1.2 Research design
- 1.2.1 Research approach
- 1.2.2 Data collection methods
- 1.3 Data mining sources
- 1.3.1 Global
- 1.3.2 Regional/Country
- 1.4 Base estimates and calculations
- 1.4.1 Base year calculation
- 1.4.2 Key trends for market estimation
- 1.5 Primary research and validation
- 1.5.1 Primary sources
- 1.6 Forecast model
- 1.7 Research assumptions and limitations
Chapter 2 Executive Summary
- 2.1 Industry 360° synopsis, 2022 - 2035
- 2.2 Key market trends
- 2.2.1 APU Technology Type trends
- 2.2.2 Platform Type trends
- 2.2.3 Power Rating trends
- 2.2.4 End-user industry trends
- 2.2.5 Regional trends
- 2.3 TAM Analysis, 2026-2035
- 2.4 CXO perspectives: Strategic imperatives
Chapter 3 Industry Insights
- 3.1 Industry ecosystem analysis
- 3.1.1 Supplier Landscape
- 3.1.2 Profit Margin
- 3.1.3 Cost structure
- 3.1.4 Value addition at each stage
- 3.1.5 Factor affecting the value chain
- 3.1.6 Disruptions
- 3.2 Industry impact forces
- 3.2.1 Growth drivers
- 3.2.1.1 Rising Global Defense Spending
- 3.2.1.2 Expansion of Military Aircraft Fleets
- 3.2.1.3 Increasing APU Maintenance and Upgrades
- 3.2.1.4 Advancements in Fuel-Efficient APU Technologies
- 3.2.1.5 Growing Adoption of Military UAVs
- 3.2.2 Industry pitfalls and challenges
- 3.2.2.1 High development and integration costs for advanced military-grade APUs
- 3.2.2.2 Supply chain disruptions and geopolitical trade restrictions
- 3.2.3 Market opportunities
- 3.2.3.1 Growing demand for hybrid-electric and more-electric military aircraft
- 3.2.3.2 Expansion of indigenous defense manufacturing programs in emerging economies
- 3.2.1 Growth drivers
- 3.3 Growth potential analysis
- 3.4 Pricing Analysis (Driven by Primary Research)
- 3.4.1 Historical Price Trend Analysis
- 3.4.2 Pricing Strategy by Player Type (Premium / Value / Cost-plus)
- 3.5 Regulatory landscape
- 3.5.1 North America
- 3.5.2 Europe
- 3.5.3 Asia Pacific
- 3.5.4 Latin America
- 3.5.5 Middle East & Africa
- 3.6 Porter’s analysis
- 3.7 PESTEL analysis
- 3.8 Technology and Innovation landscape
- 3.8.1 Current technological trends
- 3.8.2 Emerging technologies
- 3.9 Emerging Business Models
- 3.10 Compliance Requirements
- 3.11 Patent and IP analysis
- 3.12 Trade Data Analysis (Based on Paid Database)
- 3.12.1 Import/Export Volume & Value Trends
- 3.12.2 Key Trade Corridors & Tariff Impact
- 3.13 Impact of AI & Generative AI on the Market (Driven by Primary Research)
- 3.13.1 AI-Driven Disruption of Existing Business Models
- 3.13.2 GenAI Use Cases & Adoption Roadmap by Segment
- 3.14 Capacity & Production Landscape (Driven by Primary Research)
- 3.14.1 Production Capacity by Key Producer
- 3.14.2 Capacity Utilization Rates & Expansion Pipelines
Chapter 4 Competitive Landscape, 2025
- 4.1 Introduction
- 4.2 Company market share analysis, 2025
- 4.2.1 By Region
- 4.2.1.1 North America
- 4.2.1.2 Europe
- 4.2.1.3 Asia-Pacific
- 4.2.1.4 Latin America
- 4.2.1.5 Middle East and Africa
- 4.2.2 Market Concentration Analysis
- 4.2.1 By Region
- 4.3 Competitive analysis of major market players
- 4.4 Competitive positioning matrix
- 4.5 Key developments
- 4.5.1 Mergers & acquisitions
- 4.5.2 Partnerships & collaborations
- 4.5.3 New product launches
- 4.5.4 Expansion plans and funding
- 4.6 Company tier benchmarking
- 4.6.1 Tier classification criteria & qualifying thresholds
- 4.6.2 Tier positioning matrix by revenue, geography & innovation
Chapter 5 Market Estimates and Forecast, By APU Technology Type, 2022 - 2035 (USD Billion)
- 5.1 Key trends
- 5.2 Gas Turbine APU
- 5.3 Diesel/ICE APU
- 5.4 Electric APU
- 5.5 Hybrid APU
- 5.6 Fuel Cell APU
Chapter 6 Market Estimates and Forecast, By Platform Type, 2022 - 2035 (USD Billion)
- 6.1 Key trends
- 6.2 Manned Fixed-Wing Aircraft
- 6.3 Manned Rotary-Wing Aircraft
- 6.4 Ground Combat & Tactical Vehicles
- 6.5 Naval Surface Ships & Submarines
- 6.6 Unmanned Systems (UAS/UGV)
Chapter 7 Market Estimates and Forecast, By Power Rating, 2022 - 2035 (USD Billion)
- 7.1 Key trends
- 7.2 Low Power (<20 kW)
- 7.3 Medium Power (20 kW to 120 kW)
- 7.4 High Power (>120 kW)
Chapter 8 Market Estimates and Forecast, By End-User, 2022 - 2035 (USD Billion)
- 8.1 Key trends
- 8.2 Air Force
- 8.3 Army
- 8.4 Navy & Marine Corps
Chapter 9 Market Estimates and Forecast, By Region, 2022 - 2035 (USD Billion)
- 9.1 Key trends
- 9.2 North America
- 9.2.1 U.S.
- 9.2.2 Canada
- 9.3 Europe
- 9.3.1 Germany
- 9.3.2 UK
- 9.3.3 France
- 9.3.4 Spain
- 9.3.5 Italy
- 9.4 Asia Pacific
- 9.4.1 China
- 9.4.2 India
- 9.4.3 Japan
- 9.4.4 Australia
- 9.4.5 South Korea
- 9.5 Latin America
- 9.5.1 Brazil
- 9.5.2 Mexico
- 9.5.3 Argentina
- 9.6 Middle East and Africa
- 9.6.1 South Africa
- 9.6.2 Saudi Arabia
- 9.6.3 UAE
Chapter 10 Company Profiles
- 10.1 Global Key Players
- 10.1.1 Honeywell Aerospace
- 10.1.2 Safran Power Units
- 10.1.3 RTX
- 10.1.4 Aerosila
- 10.1.5 Hindustan Aeronautics Limited (HAL)
- 10.2 Regional key players
- 10.2.1 North America
- 10.2.1.1 The Marvin Group / Marvin Land Systems
- 10.2.1.2 Dewey Electronics Corporation
- 10.2.1.3 Aegis Power Systems
- 10.2.2 Asia Pacific
- 10.2.2.1 Motor Sich
- 10.2.2.2 UAV Turbines, Inc.
- 10.2.3 Europe
- 10.2.3.1 Liebherr-Aerospace
- 10.2.3.2 PBS Group
- 10.2.3.3 Suter Industries
- 10.2.3.4 Fischer Panda GmbH
- 10.2.1 North America
- 10.3 Niche Players/Disruptors
- 10.3.1 Suter Industries

 飛機輔助動力系統市場報告:趨勢、預測與競爭分析(至2035年)
 航太與軍用輔助動力系統市場-2026-2032年全球市場預測
 飛機輔助動力裝置(APU)市場機會、成長要素、產業趨勢分析及2026-2035年預測全球輔助動力裝置市場:2026-2036年全球國防輔助動力裝置(APU)市場:2026-2036年
 全球飛機輔助動力裝置(APU)市場規模、佔有率、趨勢和成長分析報告(2026-2034年)
 2026年全球飛機輔助動力系統市場報告飛機輔助動力裝置(APU)市場規模、佔有率、成長及全球產業分析:按類型、應用和地區分類的洞察,2026-2034年預測
 全球飛機輔助動力裝置(APU)市場評估:依飛機類型、安裝類型、燃料類型、地區、機會及預測,2018-2032
 輔助動力裝置市場 - 全球產業規模、佔有率、趨勢、機會和預測,按 APU 類型、按功率輸出(小型 APU、中型 APU、大型 APU)、按行業垂直、按地區和競爭細分,2020-2030 年