


 |
市場調查報告書
商品編碼
2071403
汽車無線測試系統市場機會、成長促進因素、產業趨勢分析及2026-2035年預測Automotive Over-the-Air Testing System Market Opportunity, Growth Drivers, Industry Trend Analysis, and Forecast 2026 - 2035 |
||||||

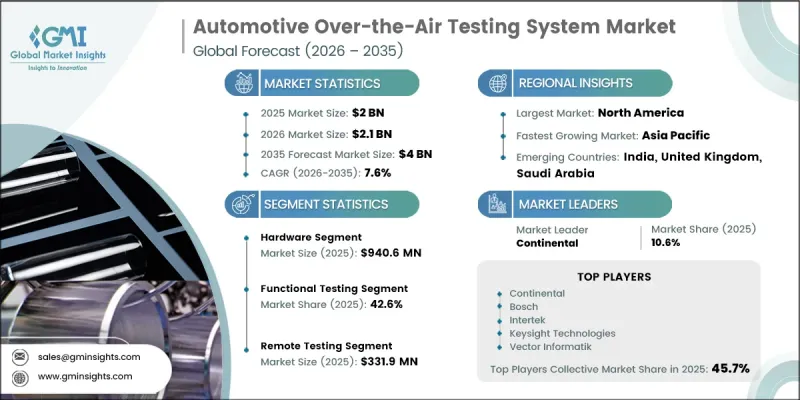
2025 年全球汽車空中下載 (OTA) 測試系統市場價值為 20 億美元,預計到 2035 年將以 7.6% 的複合年成長率成長至 40 億美元。
這一成長是由聯網汽車生態系統的日益複雜化、電動汽車 (EV) 軟體堆疊的擴展以及監管機構對網路安全和更新完整性的日益重視所驅動的。現代汽車高度依賴控制電池性能、溫度控管、能量回收煞車、充電調節和動力傳動系統最佳化的軟體系統,這顯著提高了對強大檢驗框架的需求。隨著汽車架構向集中式域控制器和區域運算系統演進,各個運算單元必須管理更高的軟體負載和相互依賴性,這需要能夠模擬真實駕駛條件的複雜測試環境。這加速了硬體在環 (HIL)、軟體在環 (SIL) 和基於雲端的編配平台的普及,這些平台能夠全面檢驗大規模車隊中的軟體更新。一個完整的 OTA 測試生態系統通常整合射頻測試室、網路模擬系統、網路安全檢驗工具、模擬軟體和合規性報告框架,以確保安全可靠的部署。
| 市場範圍 | |
|---|---|
| 開始年份 | 2025 |
| 預測期 | 2026-2035 |
| 起始金額 | 20億美元 |
| 預測金額 | 40億美元 |
| 複合年成長率 | 7.6% |
累計到2025年,硬體領域將創造9.406億美元的收入,佔市場佔有率的47.4%。到2035年,該領域預計將達到17.5億美元,複合年成長率(CAGR)為6.8%。硬體需求包括消音室和半消音室、硬體在環(HIL)測試平台、網路模擬系統、頻譜分析儀以及蜂窩協議測試平台,這些設備旨在評估OTA通訊性能和天線在各種條件下的行為。儘管由於一些成熟市場的現有基礎設施,該領域的成長相對緩慢,但仍需要不斷升級以適應不斷發展的通訊標準,例如5G Sub-6 GHz和毫米波,以及多天線車載配置。
預計到2025年,功能測試市場規模將達到8.466億美元,佔市場佔有率的42.6%。該市場專注於檢驗整個聯網汽車平台的更新安裝、執行準確性、回溯機制、ECU互通性和系統穩定性。 NI VeriStand和ETAS ISOLAR等功能檢驗平台被廣泛用於整合硬體在環(HIL)工作流程,並確保複雜汽車架構的軟體可靠性。
預計2025年,北美汽車無線測試系統市場規模將達到8.522億美元,市佔率為42.9%。這一主導地位得益於該地區聯網汽車的高滲透率、健全的網路安全框架以及OTA技術在主要汽車平台上的廣泛應用。
目錄
第1章:調查方法和範圍
第2章執行摘要
第3章 行業洞察
- 產業生態系分析
- 供應商情況
- 原物料供應商
- 零件供應商
- 製造商
- 服務供應商
- 分銷管道
- 最終用途
- 成本結構
- 利潤率
- 每個階段增加的價值
- 垂直整合趨勢
- 顛覆者
- 供應商情況
- 影響產業的因素
- 促進因素
- 聯網汽車的普及
- 電動車的迅速普及
- 嚴格的汽車網路安全和軟體法令遵循。
- 汽車軟體生態系統正變得日益複雜。
- 產業潛在風險與挑戰
- 測試基礎設施高成本且複雜
- 分散式車輛架構與ECU多樣性
- 市場機遇
- 基於雲端的遠端測試基礎設施
- 利用人工智慧最佳化測試覆蓋率
- 5G 和 C-V2X 網路仿真
- 網路安全認證服務
- 促進因素
- 成長潛力分析
- 價格分析
- 對過去價格趨勢的分析
- 依球員類型分類的定價策略(高級球員、超值球員、成本加成球員)
- 監理情勢
- 北美洲
- 美國國家公路交通安全管理局(NHTSA)
- 美國國家標準協會(ANSI)
- 歐洲
- 車輛認證機構(VCA)
- Centre National de Reception des Vehicules(CNRV)
- UTAC CERAM
- 亞太地區
- 工業資訊化部(MIIT)
- 國家市場監督管理總局(SAMR)
- 中國汽車技術研究中心(CATARC)
- 拉丁美洲
- Secretaria Nacional de Transito(SENATRAN)
- 國家計量、品質與技術研究院(Inmetro)
- 中東和非洲
- 國家監管服務機構(NRCS)強制性標準
- 海灣標準化組織(GSO)
- 北美洲
- 技術與創新展望
- 最新技術
- 新興技術
- 波特的分析
- PESTLE分析
- 專利分析
- 人工智慧和生成式人工智慧對市場的影響
- 利用人工智慧改造現有經營模式
- 設計自動化最佳化
- 用於需求預測的供應鏈人工智慧
- 按細分市場分類的生成式人工智慧用例和部署藍圖
- 風險、限制和監管考量
- 永續性和環境方面
- 永續計劃
- 減少廢棄物策略
- 生產中的能源效率
- 具有環保意識的舉措
- 考慮碳足跡
- 預測假設和情境分析
- 基本案例:驅動複合年成長率的關鍵宏觀經濟與產業變量
- 樂觀情境:宏觀經濟與產業的順風
- 悲觀情景:宏觀經濟放緩或產業逆風
第4章 競爭情勢
- 介紹
- 企業市佔率分析
- 北美洲
- 歐洲
- 亞太地區
- 拉丁美洲
- 中東和非洲
- 競爭定位矩陣
- 主要進展
- 併購
- 夥伴關係和聯盟
- 新產品發布
- 業務拓展計劃及資金籌措
- 按公司規模進行基準測試
- 排名分類標準與遴選標準
- 按收入、地區和創新能力分類的層級定位矩陣。
第5章 市場估計與預測:依組件分類,2022-2035年
- 硬體
- 軟體
- 服務
第6章 市場估計與預測:依測試方法分類,2022-2035年
- 現場測試
- 實驗室測試
- 遠距考試
第7章 市場估算與預測:依產品類型分類,2022-2035年
- 功能測試
- 安全測試
- 相容性測試
- 性能測試
第8章 市場估計與預測:依應用領域分類,2022-2035年
- 軟體更新
- 安全補丁
- 診斷測試
- 其他
第9章 市場估價與預測:依車輛類型分類,2022-2035年
- 搭乘用車
- SUV
- 轎車
- 掀背車
- 商用車輛
- LCV
- MCV
- HCV
第10章 市場估價與預測:依最終用戶分類,2022-2035年
- 汽車原廠設備製造商
- 通訊業者
- 汽車服務供應商
- 研究與發展機構
第11章 市場估價與預測:按地區分類,2022-2035年
- 北美洲
- 美國
- 加拿大
- 歐洲
- 英國
- 德國
- 法國
- 義大利
- 西班牙
- 比利時
- 荷蘭
- 瑞典
- 俄羅斯
- 亞太地區
- 中國
- 印度
- 日本
- 澳洲
- 新加坡
- 韓國
- 越南
- 印尼
- 泰國
- 拉丁美洲
- 巴西
- 墨西哥
- 阿根廷
- 中東和非洲
- 南非
- 沙烏地阿拉伯
- UAE
第12章:公司簡介
- 世界公司
- Bosch
- Continental
- Vector Informatik
- ETAS
- Keysight
- dSPACE
- Intertek
- Rohde & Schwarz
- Anritsu
- Spirent Communications
- 當地公司
- NI(Emerson Test & Measurement)
- ETS-Lindgren
- Microwave Vision
- DEKRA
- TUV SUD
- SEA Datentechnik
- Bluetest
- SGS
- TOYO
- RanLOS
The Global Automotive Over-The-Air Testing System Market was valued at USD 2 billion in 2025 and is estimated to grow at a CAGR of 7.6% to reach USD 4 billion by 2035.
Growth is driven by the rising complexity of connected vehicle ecosystems, the expansion of electric vehicle software stacks, and increasing regulatory emphasis on cybersecurity and update integrity. Modern vehicles rely heavily on software systems controlling battery performance, thermal regulation, regenerative braking, charging coordination, and powertrain optimization, which significantly increases the need for robust validation frameworks. As automotive architectures evolve toward centralized domain controllers and zonal computing systems, individual computing units manage higher software loads and interdependencies, requiring advanced testing environments capable of simulating real-world vehicle conditions. This has accelerated adoption of hardware-in-the-loop (HIL), software-in-the-loop (SIL), and cloud-based orchestration platforms that collectively validate software updates across large vehicle fleets. A complete OTA testing ecosystem typically integrates RF chambers, network emulation systems, cybersecurity validation tools, simulation software, and compliance reporting frameworks to ensure safe and reliable deployment.
| Market Scope | |
|---|---|
| Start Year | 2025 |
| Forecast Year | 2026-2035 |
| Start Value | $2 Billion |
| Forecast Value | $4 Billion |
| CAGR | 7.6% |
The hardware segment generated USD 940.6 million in 2025, accounting for 47.4% share, and is projected to reach USD 1.75 billion by 2035, growing at a CAGR of 6.8%. Hardware demand includes anechoic and semi-anechoic chambers, HIL testing benches, network simulation systems, spectrum analyzers, and cellular protocol testing platforms designed to evaluate OTA communication performance and antenna behavior under varied conditions. Growth in this segment is relatively moderate due to the presence of established infrastructure in several mature markets, although ongoing upgrades are required to support evolving communication standards such as 5G Sub-6 GHz and mmWave, as well as multi-antenna vehicle configurations.
The functional testing segment captured USD 846.6 million in 2025, representing 42.6% share. This segment focuses on validating update installation, execution accuracy, rollback mechanisms, ECU interoperability, and system stability across connected vehicle platforms. Functional validation platforms such as NI VeriStand and ETAS ISOLAR are widely used for integrating HIL workflows and ensuring software reliability across complex automotive architectures.
North America Automotive Over-The-Air Testing System Market reached USD 852.2 million in 2025, representing 42.9% share. This leadership is supported by strong connected vehicle penetration, stringent cybersecurity frameworks, and widespread OTA deployment across leading automotive platforms in the region.
Major players operating in the global automotive over-the-air testing system market include Rohde & Schwarz, Keysight Technologies, Anritsu, NI (Emerson Test & Measurement), Vector Informatik, dSPACE GmbH, ETS-Lindgren, Microwave Vision (MVG), DEKRA, and TUV SUD. Companies in the automotive over-the-air (OTA) testing system market are strengthening their position by expanding cloud-native testing platforms that enable scalable, remote validation of software updates across large vehicle fleets. They are investing heavily in AI-driven simulation environments to improve predictive testing accuracy and reduce validation cycles. Strategic partnerships with automakers and Tier-1 suppliers are increasing to integrate testing systems directly into vehicle development pipelines. Firms are also enhancing cybersecurity testing capabilities to address growing regulatory requirements around secure software deployment. Continuous upgrades to hardware-in-the-loop and software-in-the-loop systems support compatibility with evolving vehicle architectures.
Table of Contents
Chapter 1 Methodology & Scope
- 1.1 Research approach
- 1.2 Quality Commitments
- 1.2.1 GMI AI policy & data integrity commitment
- 1.2.1.1 Source consistency protocol
- 1.2.1 GMI AI policy & data integrity commitment
- 1.3 Research Trail & Confidence Scoring
- 1.3.1 Research Trail Components
- 1.3.2 Scoring Components
- 1.4 Data Collection
- 1.4.1 Partial list of primary sources
- 1.5 Data mining sources
- 1.5.1 Paid sources
- 1.5.1.1 Sources, by region
- 1.5.1 Paid sources
- 1.6 Base estimates and calculations
- 1.6.1 Base year calculation
- 1.7 Forecast
- 1.7.1 Quantified market impact analysis
- 1.7.1.1 Mathematical impact of growth parameters on forecast
- 1.7.1 Quantified market impact analysis
- 1.8 Research transparency addendum
- 1.8.1 Source attribution framework
- 1.8.2 Quality assurance metrics
- 1.8.3 Our commitment to trust
Chapter 2 Executive Summary
- 2.1 Industry 360° synopsis
- 2.2 Key market trends
- 2.2.1 Regional
- 2.2.2 Component
- 2.2.3 Testing Method
- 2.2.4 Offering
- 2.2.5 Application
- 2.2.6 Vehicle
- 2.2.7 End User
- 2.3 TAM Analysis, 2026-2035
- 2.4 CXO perspectives: Strategic imperatives
Chapter 3 Industry Insights
- 3.1 Industry ecosystem analysis
- 3.1.1 Supplier landscape
- 3.1.1.1 Raw material suppliers
- 3.1.1.2 Component suppliers
- 3.1.1.3 Manufacturers
- 3.1.1.4 Service providers
- 3.1.1.5 Distribution channel
- 3.1.1.6 End Use
- 3.1.2 Cost structure
- 3.1.3 Profit margin
- 3.1.4 Value addition at each stage
- 3.1.5 Vertical integration trends
- 3.1.6 Disruptors
- 3.1.1 Supplier landscape
- 3.2 Industry impact forces
- 3.2.1 Growth drivers
- 3.2.1.1 Increasing Adoption of Connected Vehicles
- 3.2.1.2 Rapid Growth of Electric Vehicles (EVs)
- 3.2.1.3 Stringent Vehicle Cybersecurity and Software Compliance Regulations
- 3.2.1.4 Rising Complexity of Vehicle Software Ecosystems
- 3.2.2 Industry pitfalls & challenges
- 3.2.2.1 High Cost and Complexity of Testing Infrastructure
- 3.2.2.2 Fragmented Vehicle Architectures and ECU Diversity
- 3.2.3 Market opportunities
- 3.2.3.1 Cloud-Based Remote Testing Infrastructure
- 3.2.3.2 AI-Augmented Test Coverage Optimization
- 3.2.3.3 5G and C-V2X Network Simulation
- 3.2.3.4 Cybersecurity Certification Services
- 3.2.1 Growth drivers
- 3.3 Growth potential analysis
- 3.4 Pricing Analysis (Driven by Primary Research)
- 3.4.1 Historical Price Trend Analysis
- 3.4.2 Pricing Strategy by Player Type (Premium / Value / Cost-plus)
- 3.5 Regulatory landscape
- 3.5.1 North America
- 3.5.1.1 National Highway Traffic Safety Administration (NHTSA)
- 3.5.1.2 American National Standards Institute (ANSI)
- 3.5.2 Europe
- 3.5.2.1 Vehicle Certification Agency (VCA)
- 3.5.2.2 Centre National de Reception des Vehicules (CNRV)
- 3.5.2.3 UTAC CERAM
- 3.5.3 Asia-Pacific
- 3.5.3.1 Ministry of Industry and Information Technology (MIIT)
- 3.5.3.2 State Administration for Market Regulation (SAMR)
- 3.5.3.3 China Automotive Technology and Research Center (CATARC)
- 3.5.4 Latin America
- 3.5.4.1 Secretaria Nacional de Transito (SENATRAN)
- 3.5.4.2 Instituto Nacional de Metrologia, Qualidade e Tecnologia (Inmetro)
- 3.5.5 Middle East & Africa
- 3.5.5.1 National Regulator for Compulsory Specifications (NRCS)
- 3.5.5.2 Gulf Standardization Organization (GSO)
- 3.5.1 North America
- 3.6 Technology and Innovation landscape
- 3.6.1 Current technologies
- 3.6.2 Emerging technologies
- 3.7 Porter's analysis
- 3.8 PESTEL analysis
- 3.9 Patent analysis (Driven by Primary Research)
- 3.10 Impact of AI & generative AI on the market
- 3.10.1 AI-Driven Disruption of Existing Business Models
- 3.10.2 Automated design optimization
- 3.10.3 Supply chain AI for demand forecasting
- 3.10.4 GenAI use cases & adoption roadmap by segment
- 3.10.5 Risks, Limitations & Regulatory Considerations
- 3.11 Sustainability and environmental aspects
- 3.11.1 Sustainable practices
- 3.11.2 Waste reduction strategies
- 3.11.3 Energy efficiency in production
- 3.11.4 Eco-friendly Initiatives
- 3.11.5 Carbon footprint considerations
- 3.12 Forecast assumptions & scenario analysis (Driven by Primary Research)
- 3.12.1 Base Case - key macro & industry variables driving CAGR
- 3.12.2 Optimistic Scenarios - Favorable Macro and Industry Tailwinds
- 3.12.3 Pessimistic Scenario - Macroeconomic slowdown or industry headwinds
Chapter 4 Competitive Landscape, 2025
- 4.1 Introduction
- 4.2 Company market share analysis
- 4.2.1 North America
- 4.2.2 Europe
- 4.2.3 Asia-Pacific
- 4.2.4 Latin America
- 4.2.5 Middle East & Africa
- 4.3 Competitive positioning matrix
- 4.4 Key developments
- 4.4.1 Mergers & acquisitions
- 4.4.2 Partnerships & collaborations
- 4.4.3 New product launches
- 4.4.4 Expansion plans and funding
- 4.5 Company tier benchmarking
- 4.5.1 Tier classification criteria & qualifying thresholds
- 4.5.2 Tier positioning matrix by revenue, geography & innovation
Chapter 5 Market Estimates & Forecast, By Component, 2022 - 2035 ($Mn)
- 5.1 Key trends
- 5.2 Hardware
- 5.3 Software
- 5.4 Services
Chapter 6 Market Estimates & Forecast, By Testing Method, 2022 - 2035 ($Mn)
- 6.1 Key trends
- 6.2 Field Testing
- 6.3 Lab Testing
- 6.4 Remote Testing
Chapter 7 Market Estimates & Forecast, By Offering, 2022 - 2035 ($Mn)
- 7.1 Key trends
- 7.2 Functional Testing
- 7.3 Security Testing
- 7.4 Compatibility Testing
- 7.5 Performance Testing
Chapter 8 Market Estimates & Forecast, By Application, 2022 - 2035 ($Mn)
- 8.1 Key trends
- 8.2 Software Updates
- 8.3 Security Patches
- 8.4 Diagnostic Testing
- 8.5 Others
Chapter 9 Market Estimates & Forecast, By Vehicle, 2022 - 2035 ($Mn)
- 9.1 Key trends
- 9.2 Passenger Vehicles
- 9.2.1 SUV
- 9.2.2 Sedan
- 9.2.3 Hatchback
- 9.3 Commercial Vehicles
- 9.3.1 LCV
- 9.3.2 MCV
- 9.3.3 HCV
Chapter 10 Market Estimates & Forecast, By End User, 2022 - 2035 ($Mn)
- 10.1 Key trends
- 10.2 Automotive OEMs
- 10.3 Telecommunication Companies
- 10.4 Automotive Service Providers
- 10.5 Research & Development Institutes
Chapter 11 Market Estimates & Forecast, By Region, 2022 - 2035 ($Mn)
- 11.1 North America
- 11.1.1 US
- 11.1.2 Canada
- 11.2 Europe
- 11.2.1 UK
- 11.2.2 Germany
- 11.2.3 France
- 11.2.4 Italy
- 11.2.5 Spain
- 11.2.6 Belgium
- 11.2.7 Netherlands
- 11.2.8 Sweden
- 11.2.9 Russia
- 11.3 Asia Pacific
- 11.3.1 China
- 11.3.2 India
- 11.3.3 Japan
- 11.3.4 Australia
- 11.3.5 Singapore
- 11.3.6 South Korea
- 11.3.7 Vietnam
- 11.3.8 Indonesia
- 11.3.9 Thailand
- 11.4 Latin America
- 11.4.1 Brazil
- 11.4.2 Mexico
- 11.4.3 Argentina
- 11.5 MEA
- 11.5.1 South Africa
- 11.5.2 Saudi Arabia
- 11.5.3 UAE
Chapter 12 Company Profiles
- 12.1 Global Players
- 12.1.1 Bosch
- 12.1.2 Continental
- 12.1.3 Vector Informatik
- 12.1.4 ETAS
- 12.1.5 Keysight
- 12.1.6 dSPACE
- 12.1.7 Intertek
- 12.1.8 Rohde & Schwarz
- 12.1.9 Anritsu
- 12.1.10 Spirent Communications
- 12.2 Regional Players
- 12.2.1 NI (Emerson Test & Measurement)
- 12.2.2 ETS-Lindgren
- 12.2.3 Microwave Vision
- 12.2.4 DEKRA
- 12.2.5 TUV SUD
- 12.2.6 S.E.A. Datentechnik
- 12.2.7 Bluetest
- 12.2.8 SGS
- 12.2.9 TOYO
- 12.2.10 RanLOS

 訪客和員工尋呼系統市場規模、佔有率和成長分析:按產品、通訊技術、部署方式、最終用戶和地區分類-2026-2033年產業預測
 汽車OTA(空中下載)技術更新:市場佔有率分析、行業趨勢與統計數據、成長預測(2026-2031年)
 汽車OTA更新市場預測至2034年-全球分析(按更新類型、車輛類型、驅動系統、部署狀態、連接方式、應用程式、最終用戶、銷售模式和地區分類)汽車無線升級市場預測至2034年-按升級類型、部署模式、技術、組件、驅動系統、最終用戶和地區分類的全球分析汽車空中下載 (OTA) 更新市場預測至 2034 年—按更新類型、技術、車輛類型、驅動系統、應用程式、最終用戶和地區分類的全球分析
 汽車OTA(空中下載)市場分析與預測(至2035年):按類型、產品、服務、技術、組件、應用、部署方式、最終用戶和功能分類
 全球空中下載(OTA)汽車系統更新市場規模、佔有率、趨勢和成長分析報告(2026-2034)
 汽車空中下載 (OTA) 市場:按技術類型、連接類型、驅動系統、應用和車輛類型分類——2026-2032 年全球市場預測
 全球汽車空中下載(OTA)市場報告(2026年更新)
 汽車空中下載 (OTA) 更新市場機會、成長促進因素、產業趨勢分析及預測(2026-2035 年)